Daily Major Forex Pair Scanning Session – 18 (27.01.25)Scanning multiple forex pairs to filter high-quality trade setups. No trades are forced—only structure-based opportunities.
Note: There may be a delay in this video due to upload processing time.
Disclaimer: FX trading involves high leverage and substantial risk, and losses can exceed your initial investment. This content is for educational purposes only and should not be considered financial advice. Trade at your own risk.
Harmonic Patterns

XAGUSD | Bearish RetracementSilver has hit its all time high and formed a strong resistance.It may make a short retracement which may go deep further considering the international politics.

WTI OIL closing its first green month after 5 straight red.One month ago (December 30 2025, see chart below), we gave a strong long-term buy signal on WTI Oil (USOIL), as it hit its 8-month Support on a 1W RSI Bullish Divergence:
The price reacted very positively and is about to close its first green 1M candle after 5 straight red. This is why we bring you this time the same chart but on the 1M time-frame. At the same time pay close attention to the 1M MA200 (orange trend-line), which delivered the last strong rejection for the market, which last time closed a month above it exactly a year ago (Jan 2025).
This is why we stay firm on our $69.00 Target, which isn't only on the 0.618 Fibonacci retracement level (where all 3 previous Bullish Legs of the 2-year Channel Down retraced) but also below the long-term Resistance posed by the 1M MA200.
As a side-note, to get an idea of how bearish the market is on the long-term (and why a sell at the top of the Channel Down is later suggested), Oil hasn't closed a month above its 1M MA50 (blue trend-line) since July 2024.
---
** Please LIKE 👍, FOLLOW ✅, SHARE 🙌 and COMMENT ✍ if you enjoy this idea! Also share your ideas and charts in the comments section below! This is best way to keep it relevant, support us, keep the content here free and allow the idea to reach as many people as possible. **
---
💸💸💸💸💸💸
👇 👇 👇 👇 👇 👇

XAUUSD Delivered 5100 benchmark!!Gold has successfully reached the $5,100.80/oz target, My 1st Benchmark was 4900 which delivered very early beyond expectations, I started buying and delivered my commentary and setups in advance when price was still trading below 4100
Congratulations to traders who followed the medium-term buying strategy and are now enjoying the rewards of patience and conviction.

#JKLAKSHMI - LONG#JKLAKSHMI - LONG
Near Low Cheat, 2 quarters of sales growth acceleration, 2 quarters of earnings growth acceleration, IV Pause Move
Favorable R:R
Tracking!!

NMRA- Buying zoneNMRA
Buying zone.
Early entry at consolidation range. And wait for next one upon breaking out.
.
US STOCKS- WALL STREET DREAM- LET'S THE MARKET SPEAK!

Porsche Automobil Holding SE (PAH3)P/E ~3.2x Price to earnings. EXTREMELY LOW ✅. The market values it very conservatively due to its structure.
Forward P/E ~2.9x - 3.1x Forecast price to future earnings. VERY CHEAP ✅. A slight improvement in earnings is expected in 2026.
Free Cash Flow ~$705 million. Real cash after expenses. STABLE ✅, but highly dependent on the dividends it receives from VW and Porsche AG.
ROE ~15.6% Return on equity. GOOD ✅. Covers your criterion of 14.5%.
Debt/Equity ~19.6% (0.20) Debt to equity. EXCELLENT ✅. The holding company has debt of ~$7 billion compared to equity of ~$36 billion - very stable.
Revenue Growth N/A The holding company technically does not have "income" from sales, but from investments. However, earnings are expected to grow significantly in 2026.
PEG ~0.32 Price to Growth. PERFECT ✅. A value below 1.0 indicates a serious underestimation of expected earnings growth.
Dividend Yield ~5.14% Dividend yield. EXCELLENT ✅. Traditionally strong payer, suitable for yield.
Cash on Hand ~$1.95 billion Liquid cash. GOOD ✅. Enough to service interest and current operations.
FCF Margin N/A Not applicable for holding structure.
Quick Ratio 12.5x Immediate liquidity. EXTREMELY HIGH ✅. Can cover their current liabilities 12 times.
Inst. Ownership ~52% (Core) The main stake is held by the Porsche and Piëch families, but the rest is institutional.
Current Ratio ~6.0 Current liquidity. EXCELLENT ✅. Financially extremely stable structure.
Gross Margin 0% / N/A Since it is a holding company, the margin is realized at the Volkswagen/Porsche AG level (where it is around 18-25%).
Sales Growth N/A Sales are reported at the subsidiaries. The forecast for Porsche AG for 2026 is for "recovery".
Altman Z-Score ~1.8 - 2.2 Bankruptcy risk. ATTENTION AREA ⚠️. The value is low, but this is normal for holding companies with large long-term assets (shares in factories).

BITCOIN - time to buy BTCUSD nowBITCOIN (BTC/USD) has recently been stuck inside a triangle channel pattern and has struggled to break out for a few weeks. However, the price has recently broken a strong resistance level (the white trend line shown on the chart) - The price is currently above the trend line which acted as a strong resistance level and is now very likely to hit the next resistance zone which is labeled as the take profit level. Buy BTCUSD now!

EURUSD ...Time To Buy NowEURUSD was in a recent downtrend for the last few weeks and struggled to stay bullish, but recently it has just broken a strong resistance trend line which it tested several times and failed to break through. EURUSD is very likely to hit the next major resistance zone which is market as the "TAKE PROFIT" LEVEL. There are many clear signs of new bullish movements. Time To Buy EURUSD.

SPX.. time to buy nowSPX 500 is in a clear upwards channel and has broken the last bit of resistance (white trendline line shown) - this is a clear confirmation that the next target will be the next resistance zone to the upside shown above (this is a great buy trade opportunity) - time to buy SPX 500 now...
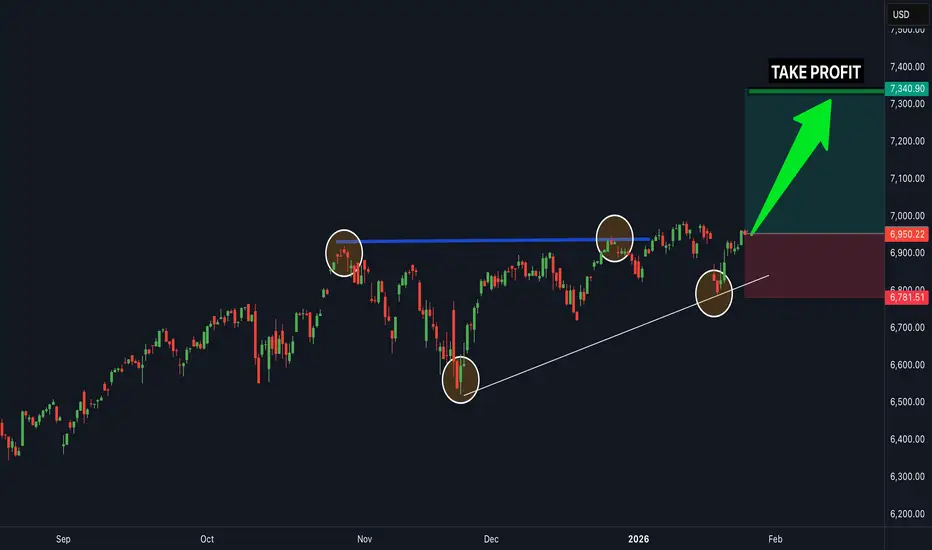
NZDUSD - Time To BuyNZDUSD was in a recent downtrend for the last few weeks and was struggling to stay bullish, but recently it has just broken a strong resistance trend line which it tested several times and failed to break through. NZDUSD is very likely to hit the next major resistance zone which is market as the "TAKE PROFIT" LEVEL. There are many clear signs of new bullish movements. BUY NZDUSD now.

Time To BUY Gold(xauusd)XAUUSD (GOLD) was recently in a short term downtrend for a few weeks but has now shown some clear bullish movements ahead. XAUUSD (Gold) has broken out of a downward trend channel that was acting as strong resistance, The price is very likely to head to the next strong resistance level which is marked as the take profit zone (green line). Time to buy gold XAUUSD now.

BUY USDJPY now...USDJPY has been in a very clear uptrend for the last few weeks but recently dropped a slight bit in the last 24 hours down to a powerful support level! It is currently held by strong support levels which means it is extremely likely to keep heading to the upside for much longer. The next target will be the fibonacci extension zone which is shown on the chart. USDJPY has struggled to break below support but has constantly been breaking through resistance levels. time to BUY USDJPY.

Buy AUDUSD nowAUDUSD was in a recent downtrend for the last few weeks and struggled to stay bullish, but recently it has just broken a strong resistance trend line which it tested several times and failed to break through. AUDUSD is very likely to hit the next major resistance zone which is market as the "TAKE PROFIT" LEVEL. There are many clear signs of new bullish movements. BUY AUDUSD now

buy GBPUSD nowGBPUSD was in a recent downtrend for the last few weeks and struggled to stay bullish, but recently it has just broken a strong resistance trend line which it tested several times and failed to break through. GBPUSD is very likely to hit the next major resistance zone which is marked as the "TAKE PROFIT" LEVEL. There are many clear signs of new bullish movements. Time to Buy GBPUSD.

CEG BEFORE EARNINGSCEG is in a corrective leg after a clear rejection from the 330–345 supply zone, with prior distribution also visible around 360–370 (failed holds and heavy selling response on retests). The breakdown through the rising structure shifts control to sellers unless price can reclaim 330+.
Demand/absorption is currently concentrated at 280 (buyers repeatedly defending the level). If that bid weakens, the market likely seeks liquidity into the 280–255 gap, and then the next vacuum/rotation zone 230–210, with a deeper institutional support shelf near 200.
Targets
Upside targets (if 280 holds + reclaim 330): 330–345 first, then 360–370. Extension target: 410 (major overhead cap).
Downside targets (if 280 breaks): 255 first (gap fill), then 230–210, then 200.

DASH/USDT potential moveSentiment is very bearish but bullish on HTF(1-2 week charts)move is just starting and momentum is building. Nice higher lows on 15min TF and and rising volume on daily TF. Theres also a bunch of short liquidations around 71-72 area which aligns with mentioned earlier things.
Im looking for a potential relief bounce to the blue zone(local golden pocket) and if volume keeps on rising we can see a push towards 93-106. This is not a FA just my personal view on this pair, please always make your own bias before entering the trade.

DOGE Can we really time the Cycle bottom??Dogecoin (DOGEUSD) is already deep into its new Bear Cycle and basically since the October 06 2025 flash crash that hit its 1W MA350 (red trend-line) and rebounded, has been trading within that level as Support and the 1W MA50 (blue trend-line) as Resistance.
The 1W MA350 in particular is of the utmost importance as it held as Support during both previous Bear Cycles. As a result, if it breaks now, there are high probabilities to initiate Phase 2 of the Bear Cycle. This either bottoms on the 0.786 Fibonacci retracement level of Doge's historic Fib Channel Up at around $0.0600 or extend to a full -93.00% decline (as much as the previous two corrected by) around $0.03500.
Whatever the price bottom might be, history has shown that it is much more efficient to just buy at the right time rather than at the right price. And that's because the use of the Sinewaves have helped at not only timing the Cycle Tops but also the Cycle Bottoms. And according to this, the next bottom should be around October 2026. So whatever price Doge is trading at around that time, we turn again into long-term buyers.
---
** Please LIKE 👍, FOLLOW ✅, SHARE 🙌 and COMMENT ✍ if you enjoy this idea! Also share your ideas and charts in the comments section below! This is best way to keep it relevant, support us, keep the content here free and allow the idea to reach as many people as possible. **
---
💸💸💸💸💸💸
👇 👇 👇 👇 👇 👇

BTCUSD – 1H Long Setup AnalysisBTCUSD – 1H Long Setup Analysis
Educational purpose only
Market Context
Price formed a weak low near 87,300 and is showing a short-term recovery.
Structure indicates a possible corrective bounce after the recent sell-off.
Price is trying to hold above short-term EMAs, suggesting early bullish strength, but higher resistance remains overhead.
Long Setup (Bullish Scenario)
Entry zone (pullback / hold area): 87,600 – 87,800
This area aligns with short-term support and recovery structure.
Stop Loss (SL)
Stop Loss: 87,200
Below the recent swing low and invalidation of the bullish idea.
Targets
Target 1: 88,450 – 88,650
Target 2: 89,400 – 89,700
Extended Target: 90,300 (previous supply / resistance zone)
Invalidation
A strong 1H close below 87,200 would invalidate the long setup and may open further downside.
Summary
Long idea is counter-trend / recovery-based.
Works best with confirmation and support hold.
Conservative approach: partial profits near first resistance.
For educational purposes only.

GBPUSD 1📌 GBPUSD – Buy Limit Setup (Professional Analysis)
🔹 Entry: 1.34200
🔹 Stop Loss: 1.33300
🔹 Take Profit: 1.36000
📈 Market Structure & Bias:
GBPUSD continues to trade within a bullish market structure, supported by strong upside momentum. The recent impulsive move to the upside confirms sustained buying pressure and market strength.
🔍 Technical Confluence:
The 1.34200 level marks a key support and demand zone, aligned with a previous consolidation area.
This zone also represents a pullback area following the bullish impulse, increasing the probability of continuation.
Historical price action shows strong bullish reactions from this level, reinforcing its validity.
🛡 Risk Management:
Stop loss is positioned below the previous swing low to invalidate the setup if bullish structure fails.
Take profit is placed near a major resistance level, offering a clean and favorable risk-to-reward ratio.
📌 Trade Expectation:
Price is expected to retrace into the demand zone before resuming bullish continuation toward the upside target.
⚠️ Disclaimer:
This analysis is for educational purposes only. Always manage risk appropriately.

S&P500 short-term Channel Up targeting 7040.The S&P500 index (SPX) has been trading within a highly symmetrical Channel Up and following last week's Higher Low on its bottom, marginally above the 1D MA100 (red trend-line), we are seeing the new Bullish Leg unfolding.
The previous one, which also bottomed on the 0.786 Fibonacci retracement level rose my a little over +4.00%, similar to the Bullish Leg before. With the 4H RSI entering a slow down phase just below its 70.00 overbought level, we expect the price rise to get more neutral as well. Regardless of the pace, we expect the index to reach 7040 at least before pulling back towards the bottom of the Channel Up.
Note that only a 1W closing below the 1D MA100 can be technically considered as a trend switch to bearish long-term.
---
** Please LIKE 👍, FOLLOW ✅, SHARE 🙌 and COMMENT ✍ if you enjoy this idea! Also share your ideas and charts in the comments section below! This is best way to keep it relevant, support us, keep the content here free and allow the idea to reach as many people as possible. **
---
💸💸💸💸💸💸
👇 👇 👇 👇 👇 👇

BTR PRO Delivers Again – +50 Points INTRADAY! 27 Jan 2026🔥 BTR PRO DELIVERS AGAIN – +50 POINTS INTRADAY! 🔥
📅 Date: 27 Jan 2026
Stock: BSE LTD
Indicator: BTR PRO Price Action (SL + Targets)
✅ BUY ENTRY: 2705
🎯 T1 HIT
🎯 T2 HIT
🎯 T3 HIT
📈 INTRADAY EXIT: 2755
💰 PROFIT: +50 POINTS CLEAN MOVE
No noise.
No emotions.
Pure Price Action + Rule-Based Targets.
📌 Intraday traders booked full 50 points
📌 Swing targets worked perfectly
👉 Follow BTR PRO
👉 Trade with structure, not hope
#BTRPRO #50Points #IntradayTrading #BSELTD #PriceAction #TradingView #NoEmotionTrading #ConsistencyWins 💪📊

$BNB (1H) LAST BUYING ZONE IN PLAY!!!BINANCE:BNBUSDT is trading around $879 and is currently pulling back into a strong demand and entry zone at $873. As long as the price holds above $870, the bullish setup remains valid.
Looking ahead, the $874.47 - $871.71 zone remains the key psychological and structural Demand zone. A clean acceptance above this range is required to open the path toward $888. The bullish setup is invalidated on a sustained breakdown below $870.
On the upside, $880 is the first target where some resistance is expected. If buyers push through with good momentum, the next upside level to watch is $888, which aligns with the previous high and the selling zone.
