NZDEUR, Major BULL-Flag-Formation, Targets Objections!Hello There!
Welcome to my new analysis of NZDEUR. In recent times I have spotted many gems within the forex market. With NZDEUR I have analyzed the underlying dynamics and spotted important determinations that have the potential to elevate NZDEUR into a massive bullish breakout development with expanding price-action dynamics and activation of important target-zones. In this case, NZDEUR is a considerable long-side opportunity, and when continuing with a total-return approach as I am doing it the best is to also consider other short-side opportunities in the market.
When looking at my chart NZDEUR moved forward with completing a highly important formation here which is this major ascending channel formation and NZDEUR continued with an appropriate breakout above the upper boundary confirming the boundary as the main support level together with the 65EMA and 35EMA. Furthermore, NZDEUR has the main structure support within the range marked in orange in my chart. NZDEUR already bounced several times in these important support zones and is now building a greatly determined bull-flag formation above the prevalent support levels.
Taking all the major factors into consideration here the next time the final bull-flag completion breakout of NZDEUR should be considered. Once the final bull flag has been completed as marked in my chart with the final bullish bull-flag breakout setup this is going to be the origin of the major wave-E expansion movements toward the upside dynamics, and once this final breakout has shown up it is going to activate the initial minimum target-zone as marked in my chart at 0.5708, above this the second target-zone will be at 0.57382, and the final target-zone will be within the 0.577 level.
Thank you everybody for watching my idea about NZDEUR. Support from your side is greatly appreciated.
“I always knew I was going to be rich. I don't think I ever doubted it for a minute. ”
VP
Harmonic Patterns

Ethereum at the Edge: Compression, Volatility & the Next RegimeThis idea looks at Ethereum through a volatility, volume, and macro lens.
To frame this properly, I’m using volume and a loosely defined time boundary that aligns with what many perceive as the four-year cycle in crypto markets. The goal isn’t to be exact, but to highlight key volume inflection points and what they may represent structurally.
There’s a widely held belief that “smart money” — often assumed to be institutions or market makers — accumulates at certain phases and distributes at others. The assumption is that this capital tends to buy well and sell well. Whether that’s fully accurate or not, I’ve used those same labels here as a conceptual framework.
Different platforms and brokers show slightly different data, so I’ve kept this analysis broad. The levels referenced are directional markers rather than precise figures.
Key Volume Inflection Points
The first major point of interest is March 2017, when Ethereum traded around $57. This period marked a notable volume spike.
The next significant volume inflection occurred in January 2021, when ETH traded near $1,313. From there, price accelerated aggressively, peaking in May 2021 at $4,385.
That May 2021 candle was the largest monthly candle in Ethereum’s history, accompanied by the second-highest monthly volume ever recorded. Price moved roughly $2,600 intramonth.
My interpretation: this was a major distribution event.
What makes May 2021 especially important is that price has effectively oscillated within that candle’s range ever since. Despite multiple attempts, neither the highs nor the lows have been meaningfully broken and sustained. Both sides have been swept—but the range remains intact.
The Four-Year Lens
There’s a common belief that crypto operates in four-year cycles. Using volume as a guide, we can loosely frame:
Expansion: January 2018 → November 2021
Compression: November 2021 → September 2025
Potential Expansion: September 2025 → 2029
In September 2025, we saw a volume spike that wasn’t dramatic—but it was meaningful. What followed was a 47% decline in roughly 92 days. The speed of that move matters.
The question is simple but important:
Was that volume spike accumulation for a larger downward expansion, or was the decline a corrective move setting up a future expansion?
The Macro Reality
If institutional adoption alone was going to send Ethereum to the moon, it would have happened already in my opinion. In reality, total Ethereum volume has declined steadily since November 2021, despite periodic spikes.
Yes, there’s been broader institutional acceptance and regulatory acknowledgment, but price has remained trapped in the same macro range.
What has changed since 2021 is interest rates. We moved from near-zero to ~4%, and Ethereum has struggled to sustain prices near the $4,000 area under those conditions.
A simple—but powerful—idea emerges:
If policy shifts toward meaningful rate cuts, that could fuel a large-scale expansion. But if higher rates persist or rise further, that pressure could remain a headwind.
This matters because crypto has never existed in a prolonged high-rate environment. Its entire lifespan has been shaped by cheap money. We genuinely don’t know how it behaves under sustained monetary tightening.
The Dollar Factor
The dollar also matters. Crypto tends to perform better during periods of dollar weakness. While the dollar has softened at times, it’s also compressing structurally.
If the dollar enters a sustained bull market alongside high interest rates, that combination could be extremely hostile for crypto.
Conversely, a weakening dollar, easing rates, and improving global liquidity could ignite a powerful multi-year expansion.
This framework isn’t predictive—it’s contextual.
The goal isn’t certainty, but clarity.
This idea is meant to spark thought, not provide answers.

OIL, Crucial Wedge-Formation, Huge PLUNGE to Follow Next!Hello There!
Welcome to my new analysis of OIL. Within the recent high inflation development with continued rate hikes in a lot of economic fields, it has to be mentioned that OIL could be on the brink of major market disruptions especially when the rate hikes continue to rise further together with the DXY printing the next new highs. In this case, I have detected important underlying dynamics within the analytics dashboard and I have put them into perspective to determine what should be considered with OIL in the upcoming times.
As when looking at my chart now, OIL could since May 2023 recover from the crucial bearish wave lows nonetheless this wave does not have a fundamental open interest and volume backing and this is why it can turn any time especially when a massive bearish supply wave is entering the market because of grievous rate hikes and potential new supply-chain disruptions that are going to trigger a supply shortage. Taking these crucial factors into consideration a major bearish decline and bearish momentum acceleration may be just around the corner.
OIL has also formed this gigantic descending channel formation in which it has the major bearish distribution resistances within the upper boundary as marked. The most determining factor here is the massive ascending triangle formation that leads directly into the upper resistance zone and is now about to complete the wave count within the ascending triangle. This means, that as the wave-count directly approaches the crucial upper resistance zone it is going to lead to an increased bearish volatility breakout below the boundaries within the next times.
Once the gigantic ascending triangle formation has been completed it is going to activate the next bearish continuation below the 100EMA and 300EMA. Especially, once the price-action formed the breakouts below the levels this is going to massively accelerate the bearish dynamics towards the lower levels and continue into the bearish momentum direction.
The bearish price dynamic is going to continue till the final targets have been reached and in this case, it will be highly determining how the final targets are actually approached especially when the interest rates continue to rise together with supply-chain disruptions to accelerate this is going to trigger the next bearish waves even below the final target zones.
Taking all the factors into consideration and because of the gigantic ascending triangle, together with the underlying indications with the interest rate dynamic as well as the supply-chain disruptions dynamic I am keeping the symbol on my watchlist and I am going to re-evaluate the situation once important changes happened within the bearish formation.
In this manner, thank you everybody for watching my analysis of OIL. Support from your side is greatly appreciated.
VP

IBM, This is Huge, Massive BULL-Acceleration, BREAKOUT-Setup!Hello There!
Welcome to my new analysis of IBM. In recent times I have analyzed the stock and I have detected major important historical determinations within the analytics backend that are actually indicating an epical breakout has a high potential to emerge within the next times. Not every stock within the market is bullish however with IBM there are clear signs that it already had the potential to rebound since the grievous corona market shock lows and now as digitization increases this is already building a bullish base for IBM.
Within my chart, I have detected this gigantic inverse head-shoulder formation in combination with the paramount bull flag formation, both being two bullish formations that have the potential to be major bullish trend accelerants once the breakout above the boundary has shown up this is going to activate a major double confirmation here. The trend is supported by the major underlying demand structure as well as the EMAs and the main ascending trend line. Once the final breakout above the upper boundary of the inverse head-shoulder formation in combination with the upper boundary of the bull flag has shown up this is going to accelerate the demand trend dynamics.
Taking all these factors into consideration here as digitization since the corona pullback lows have been completed increased massively this is increasing the actual digitization demand within the market and for a stock like IBM, this means that there is a main underlying demand base that is accelerating a bullish trend dynamic. Once the main breakouts as mentioned within the next times have shown up this is going to activate the minimum target of 250 and above further continuations have an increased potential once the main demand and momentum spread into the trend direction increases. Because of the importance of this setup forming here, I am keeping the stock in my current watchlist.
In this manner, thank you everybody for watching my analysis of IBM. Support from your side is greatly appreciated.
VP

XAUUSD-Elliott Wave analysisGoal achieved. Now let's see what happens.
Do you think there will be a sharp decline or just a correction?

AGI, GOLD-Market GEM, Major EXTENSION Because of THIS Factor!Hello There!
Welcome to my new analysis about AGI, a major gold-market gem I recently spotted, and added to my watchlist because of the major underlying factors prevalent here. As I already pointed out the major gold-market gems that are going to emerge with epic growth rates similar to those seen in the gold rushes within the gold market history, the most important part in my analysis and watchlist is to distinguish the diverging gold stock categories.
Because the major gold-backed currency-system implementation acceleration is not going to affect all of the gold stocks in the same manner!
The implementation of a gold-back currency system is important for three categories of Gold Stocks I detected:
1.) Gold Stocks that will emerge with a massive bullish volatility increase no matter the size of the gold-backed currency system implementation.
2.) Gold Stocks that will emerge with a massive bullish volatility increase when the necessary technology and high-tech are backing the gold-backed currency system implementation.
3.) Gold Stocks that will only emerge with a massive bullish volatility increase when the gold-backed currency system is implemented in a big enough economic field together with the necessary technology and high-tech backing.
Now, with distinguishing the major categories of gold stocks within the gold stocks market it is necessary to spot primarily those stocks that have the most potential to move along with the important real-time developments in the actual gold-backed currency-system implementation. Because, when the gold-backed currency-system implementation is moving forward with a simultaneous acceleration of the actual technology and high-tech gold market stocks of all three categories will have a substantial potential to accelerate with heavy bullish volatility growth rates when the economic field of gold-backed currency-system implementation is big enough.
Therefore, as I have analyzed AGI the gold stock falls into the first category of gold stocks within the market as the major bullish wave is already established and the underlying factors are supporting this bullish wave expansion. The gold-backed currency-system implementation no matter the size of the economic field is going to accelerate this trend dynamics heavily and the already established trend is going to increase at a minimum of 8x faster pace. AGI is a typical gold stock of category 1 as it is emerging with the underlying technicals as well as gold market backing to emerge with this major price action acceleration.
When looking at my chart AGI already completed this massive descending channel formation with a huge upper boundary breakout above which it accelerated and now moved further to mark a major formation structure with the main diamond-continuation-formation that is building up above the breakout areas. Furthermore, AGI already established the main underlying price-action-trend-dynamic with the coherent wave-count that is going to unfold the full potential once the breakout above the upper boundary has emerged as it is seen within my chart. Also highly important here is the fact that AGI already completed the main bullish EMA crossover with the 35-EMA marked in orange crossing above the 65-EMA.
Taking all these factors into consideration AGI is on the verge of the most epic breakout development within the whole price-action chart. Especially as it is already rallying this rally will accelerate heavily on the upcoming gold-backed currency-system implementations. The target zone only for this current ongoing trend is as marked within my chart within the 100 level and especially with the further continuation of the gold-backed currency-system trend with the necessary technology high-tech backing there is also potential to move beyond this level. Nonetheless, in this case, it is also highly crucial that not a severe inflation wave shows up within the market or the potential recession accelerates to a major depression because this is going to reverse into a more bearish perspective.
Nonetheless, currently, there are more factors determining this historical gold-backed currency trend expansion to emerge and therefore it should be the prevalent considerable scenario. Therefore I am going to keep the gold market gem on my watchlist and adjust to the most determining factors with the changes emerging.
In this manner, thank you everybody for watching my analysis of AGI. Support from your side is greatly appreciated.
VP

DHR, Massive BULLISH Wedge-Formation, Major BREAKOUT Incoming!Hello There!
Welcome to my new analysis of DHR. The stock market is in a really important condition currently as there are many interesting stock gems within the market I have spotted in my analytics backend. One of the interesting gems I recently spotted for a major opportunity on the long side of the market is DHR. This gem has major underlying potential to increase a huge breakout dynamic in the upcoming times.
When looking at my chart now DHR is bouncing several times within the major ascending channel formation, this channel formation is a substantial origin of several support bounces from where DHR could increase with bullish momentum volatility. Now, DHR is bouncing within the range for the next consecutive time and is already marking the level as a main support from where the next main bullish expansion spike is likely to emerge.
What is so important within this whole newly developed formational structure is that DHR is now also forming this momentous descending wedge-formation in which it already completed the coherent wave count especially bouncing within the lower boundary of the wedge and is now building up the further determinations. The fact that DHR already completed the wave count and bounced within the lower boundary is already nearly completing the whole descending wedge formation.
With these main underlying confirmational developments, DHR is building a massive bullish base here. Putting this into perspective this means that DHR is likely to emerge with the final wedge-breakout within the next times which is going to form the completion-setup with the breakout above the boundary as marked in my chart. Once DHR has formed this completion-setup it is going to be the main origin of the bullish wave-expansion towards the upper directions and reaching the target zones with the wave-C extension.
Thank you everybody for watching my idea about DHR. Support from your side is greatly appreciated.
VP

ADBE, Second BEAR-Fractal, SHORT-Momentum DOOMSDAY Incoming!Hello There!
Welcome to my new analysis of ADBE. This stock has been massively battered by the major bear market decline setup in the gigantic bear channel. This stock did not exceed any new highs and did not have the potential to emerge with new bull momentum. The bears are still present within this stock and this is exactly why the bear momentum for this stock can accelerate heavily any time soon. There are several major bearish indications that are underlining the bearish scenario for the stock in an overwhelmingly precarious way.
Three reasons why the bear doomsday scenario for the stock is present, starting any time soon:
1.) Massive Liquidations: Over 250 Billion positions have been liquidated within the previous bearish doomsday market decline wave towards the downside.
2.) Weak Momentum: The momentum with which the recent meager recovery wave setup is highly fragile and is likely to turn anytime soon.
3.) Major Short-Side Positioning: A vast amount of institutional and smart money operators are positioning their selves on the short side. Always an important indication especially with retail traders positioned in the other direction.
Why shorting the stock through the upcoming second bear doomsday scenario will be the best approach in the current and upcoming market conditions:
1.) Second bearish ascending wedge fractal: The stock is going to complete exactly the same bearish ascending wedge fractal towards the downside once again.
2.) Total-Return Approach: By shorting the stock a trader has the candidature to a total-return approach, the trader is profiting when prices fall and at other times when they go up.
3.) Liquidation Acceleration: Once the whole ascending fractal has been completed it will trigger a fast-paced bearish wave making profits much faster than in an uptrend.
The most prevalent determining indications that are going to activate the upcoming bear market scenario wave for the stock:
As it is seen in my chart ADBE completed the huge bearish ascending triangle fractal exactly by moving into the upper distribution zone from where it emerged with the pullback towards the downside and set up the massive 250 Billion bearish liquidation wave towards the downside. This wave developed very fast and by positioning oneself before this huge bearish wave and completion of the fractal towards the downside a trader could make a big load of profit in the market.
Now, ADBE is still trading within the gigantic descending channel formation in which it has the most prevalent upper resistance distribution channel which has been the origin of the massive bearish waves towards the downside before and is now already setting up the upcoming 300 Billion bearish liquidation wave towards the downside which is going to activate the completion of the second ascending wedge fractal and the preceding wave C towards the bearish direction.
In the next times, the whole bearish ascending wedge fractal will be completed with the breakout below the lower boundary followed by the breakout below the 65EMA and 100EMA from where the bearish trend acceleration is going to unfold huge accelerations towards the downside and the severe bearish continuations towards the lower target zones. Especially, in this case, the market could still continue beyond this level in the bearish direction.
Upcoming Perspectives and the major underlying factors that are primarily important for consideration on the short side for the stock, the sector, and the economic field:
It has to be mentioned that an economic field with high interest rates, spreading inflation, a stagnation within the sector is setting up the determination to increase this whole bearish wave development, especially with a more bearish volume moving into the market. Also, highly determining in this case is the actual technology developments because when they reverse in an economic field this will have massive bearish effects on the stock as well.
Now, for traders it is highly important to follow such market situations with the appropriate setup within the market, especially in such times it is necessary to have the right positioning within the market because a massive bearish pressure acceleration can start anytime soon considering a huge acceleration in the inflation, a smart money operator bearish market making in which the bearish conclusion will be inevitable, an expiring futures market in which a lot of futures turn to an bearish volatility in the market. This is why traders need to position their selves before all these heavy bearish scenarios are set up.
In this manner, thank you everybody for watching my analysis of ADBE. Support from your side is greatly appreciated.
VP

EURAUD, Huge Formation, WEDGE to Setup BEARISH BREAKOUT!Hello There!
Welcome to my new analysis of EURAUD from the 4-hour timeframe perspective. In recent times the EXY, European Currency Index has shown up with crucial bearish inclinations which are pointing to a bearish market sentiment especially with massive inflation spreading like wildfire seemingly not reacting to exponential rate hikes pulled out by the ECB. Such developments could point to a major bearish setup emerging for the EURAUD also. Besides that, there are important formational structures that need to be considered here. In this case, it is necessary to determine the final completions and changes within the market before rushing to anything else.
Formational Developments, Resistance, Bearish Momentum, and Setup:
When looking at my chart now EURAUD continued to form this preceding huge bearish descending channel trend in which it already pulled back several times bearishly off the upper boundary increasing the high possibility likelihood of such pullbacks to holding on and printing the next bearish waves with continued lower lows to be determined. Especially as EURAUD already pulled back several times from the 65-EMA in red as well as the 35-EMA in grey these EMAs are substantial resistances from where continued pullbacks are more likely than anything else. Currently, EURAUD is approaching the EMAs together with the upper boundary resistance of the channel once again which is pointing to the next bearish wave to set up from here on.
Upcoming Determinations, Bearish Breakout, Target Activation, and Underlying Drivers:
Furthermore, what is the most important formation in my whole chart is this crucial descending wedge formation. Such a formation is pointing to an increased continuation toward the bearish direction in almost all of the cases. This formation will be completed with a final breakout below the lower boundary as it is marked within my chart and as EURAUD already completed the wave-count within the formation this final breakout is likely to emerge within the near future. Once the breakout has shown up as it is marked this is going to be the origin of the wave C extension and bearish momentum acceleration as it is marked. Once this wave C acceleration and bearish wave has shown up it is going to activate the final target zone as marked.
Once this final target zone has been reached further assumptions need to be made. The pair is on my watchlist to determine important changes once they have shown up here, especially with the target projections and bearish developments to be expected. Especially, a massive inflation increase together with failed monetary policies are going to fuel a bearish momentum inclination here therefore these underlying factors also need to be considered then.
In this manner, thank you everybody for watching my analysis of CHFAUD. Support from your side is greatly appreciated.
VP

EUR/USD short-to-medium term bullish phaseTechnical Observations
Support/Resistance Zone: There is a major horizontal resistance band (highlighted in green) around the 1.2000 - 1.2150 level. This area has acted as a significant pivot point since 2015.
Current Price Action: The pair is currently trading at 1.1771.
Ascending Channel/Wedge: On the far right, the price is consolidating within an ascending structure (yellow trendlines). This suggests a steady "grind" higher toward the major resistance zone.
Fibonacci Extensions: The chart utilizes Fibonacci levels projected from the recent 2024/2025 low:
1.272 Extension: Currently being challenged near the 1.1800 area.
1.618 Extension: Aligns perfectly with the major 1.2100 resistance zone (marked with "???").
Higher Targets: The 2.272 (approx. 1.2600) and 4.236 (approx. 1.4100) are mapped as very long-term targets should a full trend reversal occur.
Detailed Summary
The EUR/USD is currently in a short-to-medium term bullish phase within a much larger consolidation range.
Bullish Case: If the price breaks the current ascending consolidation, the primary target is the 1.2100 area (the 1.618 Fibonacci level and major historical resistance).
Bearish Case: The price is approaching a "heavy" zone. Failure to break the 1.2000 - 1.2100 area could result in a rejection back toward the 1.1000 level, maintaining the multi-year range.
Key takeaway: The pair is approaching a critical decision point at the 1.2100 handle. Watch for price exhaustion or a breakout at this level to determine the trend for the remainder of 2026.

XAU Bullish continuation1️⃣ Market Structure & Trend
Overall trend: Strong bullish
Price is respecting an ascending channel (clean higher highs & higher lows).
Momentum is intact, no structural break to the downside yet.
The recent move shows impulsive expansion after a consolidation, which is healthy continuation behaviour.
✅ Bias: Bullish continuation
2️⃣ Key Technical Elements on Your Chart
🔹 Ascending Channel
Price is currently trading in the upper half of the channel, showing strength.
🔹 Fibonacci Levels
1.272 & 1.618 extensions are acting as magnet levels.
TP sits just below a key fib extension
This suggests measured-move continuation, not exhaustion yet.
🔹 Break & Retest Logic
Price has broken above prior resistance (~4,49x–4,53x zone).
That zone is now acting as support / entry area.
Clean structure-based entry, not FOMO.
3️⃣ Trade Setup Quality (Risk Management)
📈 Long Position Breakdown
Risk: ~6.3%
Reward: ~14.3%
R:R ≈ 2.25 ✅ (solid for swing trading)
Stop is placed:
Below structure
Below the channel midline
Below prior consolidation
4️⃣ Key Levels to Watch
🟩 Support Zones
4,49x – 4,45x → must hold for bullish continuation
4,38x – 4,36x → deeper support / demand zone
A daily close below 4,42x would weaken the setup
🟥 Resistance / Targets
5,09x (current target area)
Above that:
5,20x
5,40x–5,60x (upper channel projection)

GBPUSD – 4H Medium–long term = Bearish1. Market Structure (Higher Timeframe Bias)
Primary structure:
Price has been moving inside a large descending channel for months.
Recent development:
From the November low, price formed a rising internal channel (counter-trend move) → this is a pullback within a broader downtrend, not yet a confirmed trend reversal.
Bias:
🔸 Medium–long term = Bearish
🔸 Short term = Bullish corrective rally
2. Key Zones & Levels
🔻 Major Support
~1.3010 – 1.3040
Channel low
Strong reaction point (blue marker)
Previous demand
If this breaks → continuation bearish scenario accelerates
🔺 Key Resistance
~1.3590 – 1.3710
Descending channel top
Prior structure high
Confluence with trendline resistance
~1.3860 – 1.4150
Higher supply zone
Valid only if price breaks and holds above 1.3710 with structure shift
3. Current Price Action Insight
Price is approaching the upper boundary of the rising channel
Momentum is bullish, but:
Rally is compressed
Approaching HTF resistance
Risk/reward for fresh longs is worsening
4. Trade Scenarios (High-Probability Plans)
🟥 Scenario A: Trend Continuation (Preferred)
Sell the rally
Entry: 1.3550 – 1.3700 (rejection + bearish confirmation)
Stop: Above 1.3860
Targets:
TP1: 1.3300
TP2: 1.3050
TP3 (runner): Channel low continuation
✔ Best RR
✔ Aligned with HTF trend
✔ Matches your “Risk Entry” idea
🟩 Scenario B: Break & Retest (Reduced Risk Long)
Only if structure flips
Conditions:
Clean break above 1.3710
4H close above
Retest holds as support
Entry: Retest of 1.3710
Stop: Below 1.3590
Targets: 1.3860 → 1.4150
⚠ Counter-trend until the descending channel is fully invalidated

TheGrove | EURUSD buy | Idea Trading AnalysisEURUSD is moving in an UP trend channel and moving on Resistance area .
The chart is above the support level, which has already become a reversal point twice.
We expect a decline in the channel after testing the current level.
We expect a decline in the channel after testing the current level which suggests that the price will continue to rise
Hello Traders, here is the full analysis.
I think we can soon see more fall from this range! GOOD LUCK! Great BUY opportunity EURUSD
I still did my best and this is the most likely count for me at the moment.
-------------------
Traders, if you liked this idea or if you have your own opinion about it, write in the comments. I will be glad

EURUSDHello Traders! 👋
What are your thoughts on EURUSD?
EURUSD has been trading within a well-defined weekly range for an extended period. Currently, the price has reached the major resistance zone (Range High), coinciding with the 0.707 and 0.786 Fibonacci retracement levels.
Technical Outlook:
Overbought Conditions: On the Daily timeframe, the price is currently in overbought territory. This suggests that the bullish momentum might fade temporarily, leading to a healthy correction.
Expected Move: We anticipate a retracement toward the equilibrium level (mid-range)before any further attempt to break the resistance.
Ultimate Target: After building liquidity at the lower/mid levels, a move to break the range high is the primary long-term scenario.
Trading Plan:
We are avoiding any long positions at the current peak. Our execution plan is:
Waiting for a proper correction to enter long at a better Risk/Reward ratio.
Or, waiting for a clear breakout and retest above the range high.
Don’t forget to like and share your thoughts in the comments! ❤️

ETHUSDT Hello Traders! 👋
What are your thoughts on ETHEREUM?
Ethereum has experienced a sharp decline from recent highs and has now entered a corrective phase. Price is currently consolidating within a short-term ascending channel.
At the moment, ETH is trading near the lower boundary of the channel. In the short term, as long as price remains above the key support zone, we expect some consolidation in this area followed by a corrective bullish move toward the upper boundary of the channel.ut trades.
Don’t forget to like and share your thoughts in the comments! ❤️

Bitcoin (BTCUSD) – 1-Day Timeframe Tradertilki AnalysisGuys,
There have been many requests for me to share a new Bitcoin analysis, so here I am with my latest one.
My friends, Bitcoin is currently stuck between the levels of $94,500 and $84,000. This consolidation has two possible outcomes: it will break strongly in one direction.
If Bitcoin closes a daily candle above $94,500, it means that major buyers will push the price toward the $104,000 target level. In this case, my target level after a breakout above $94,500 will be $104,000.
If Bitcoin closes a daily candle below $80,000, the first target will be testing the $74,000 level.
This is only an informational Bitcoin analysis for you.
My friends, unlike some who throw out random targets, I analyze the data and follow the major buyers. In trading, the most important thing is to move together with those big buyers.✨
My friends, I share these analyses thanks to each like I receive from you. Your likes increase my motivation and encourage me to support you in this way.🙏
Thank you to all my friends who support me with their likes.❤️

WEEK 5 FORECAST - DECEMBER 2025 - A Quick Sunday Market Breakdown for the Fifth Week of December 2025.
- Do Enjoy, Like & Comment.

VanEck Rare Earth ETF - pamp itVanEck Rare Earth ETF - China monopoly play - played out
Been working this one for awhile now. The final crescendo is in full swing.. i think. IF it all rolls over here, and lacks any real impulse ,, well we'll know whatsup. and jump ship accordingly.
Or valhalla awaits with a few decent reasonably far out option plays.

Eurjpy the Best speculation If you look closely you'd notice price is on a premium level... Waiting patiently to buy the deep next week ...

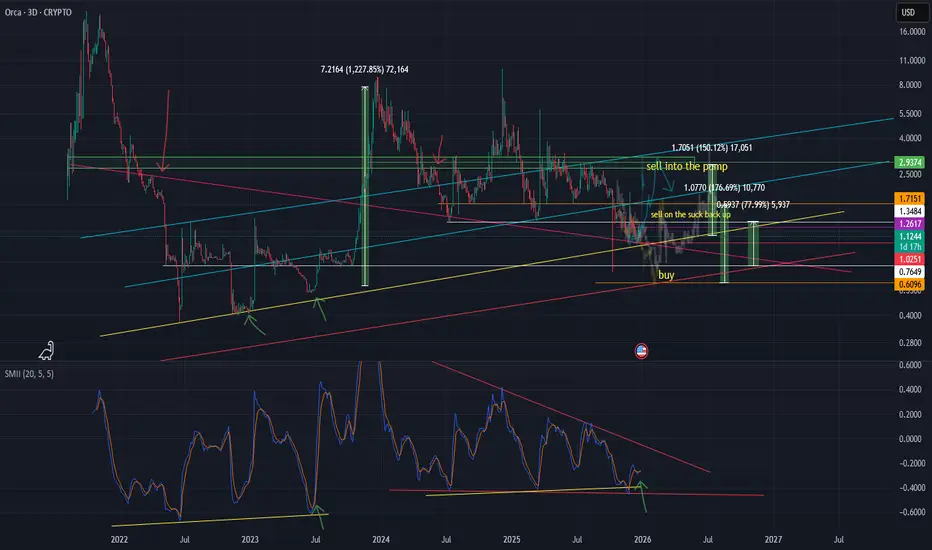
Orca - The Crypto Whale SanctuaryOrca - The Crypto Whale Sanctuary
plan is to see if the price action turns to poo here, ie doesn't just green di$$o right to the sanctuary. should be reasonably obvious. edging higher like this and ramping is good.
momentum is trending up on higher time frames. could be good.
btc looking very scary bad. so theres that on the negative bias.
if it is a pump its a sell-into one imo.
risky
USDCHF at a Key Range | Breakdown or BreakoutHello and welcome to all TradingView traders 👋
I hope you’re having profitable and successful trades 📈
Today, I’m sharing a comprehensive analysis of USD/CHF, which is currently trading around key technical levels and may offer interesting trading opportunities.
📌 General Overview of USDCHF
The USD/CHF pair is widely known as a safe-haven currency pair.
At the moment, considering the broader macroeconomic environment:
🔴 From a fundamental perspective:
Based on recent news and market expectations, the US dollar is generally losing strength.
Factors such as interest rate cut expectations, weaker economic data, and reduced demand for the dollar have shifted market attention toward safer currencies like the Swiss Franc.
📉 Long-Term Trend Analysis
Looking at higher timeframes (Weekly & Daily):
🔻 The overall market structure remains bearish
Clear lower highs and lower lows are visible
Price is still trading below the long-term descending trendline
➡️ As long as this structure remains intact, the dominant bias stays bearish (sell-side).
📦 Current Market Condition (Daily Range)
On the daily timeframe:
🟡 Price is currently moving inside a well-defined range
Upper boundary acting as resistance
Lower boundary acting as support
The market is in a consolidation phase, waiting for a clear directional decision.
📐 Key Technical Levels & Chart Explanation
🔹 Resistance Zone:
A strong area where price has been rejected multiple times, aligned with the descending trendline
🔹 Support Zone:
The lower boundary of the daily range; a confirmed break could trigger stronger downside momentum
🔹 Descending Trendline:
Each interaction with this trendline may offer potential sell opportunities
🎯 Trading Scenarios
🔵 Scenario 1: Range Trading
Buy near support ⬆️
Sell near resistance ⬇️
Suitable for range traders
⚠️ Always place stop loss outside the range
🔴 Scenario 2: Bearish Breakdown (Support Break)
If price confirms a daily close below support:
📉
Continuation of the bearish trend
Lower targets become active
Pullbacks toward the broken support may provide sell entries
🟢 Scenario 3: Bullish Breakout (Resistance Break)
If price confirms a strong daily close above resistance:
📈
Short-term corrective move or potential trend shift
Higher targets come into play
Prefer entries after a pullback for better risk-to-reward
⚠️ Risk Management
✔️ Do not trade without confirmation
✔️ Use proper position sizing
✔️ Always wait for the daily candle close
❗ Disclaimer
This analysis reflects personal opinion only and is not financial advice.
All trading decisions are made at your own risk 🧠💼
📊 What’s Your View?
Which side do you think USDCHF will break from the range? 🤔
🔼 Upside breakout
🔽 Downside breakdown
💬 Share your thoughts in the comments
🔖 Tags:
#USDCHF #Forex #TechnicalAnalysis #PriceAction
#RangeTrading #Breakout #FundamentalAnalysis
#TradingView #SmartMoney #RiskManagement

Navigating Risks in an Interconnected World1. Geopolitical Tensions and Trade Wars
One of the most immediate threats to global trade comes from geopolitical conflicts and trade wars. Trade policies are often influenced by diplomatic relations, military posturing, and national security concerns. For instance, disputes between major economies can lead to the imposition of tariffs, quotas, or embargoes, disrupting supply chains and increasing costs for businesses and consumers. The US-China trade tensions in recent years exemplify how prolonged trade disputes can ripple across industries, impacting technology, manufacturing, and agriculture sectors globally. Additionally, regional conflicts, such as those in the Middle East or Eastern Europe, can interrupt energy supply routes and logistics networks, further destabilizing international trade.
2. Protectionism and Nationalistic Policies
Protectionist measures, often motivated by the desire to safeguard domestic industries, pose a subtle but persistent threat to trade flows. Nationalistic policies, including subsidies, import restrictions, and domestic content requirements, can distort markets and reduce the efficiency of global supply chains. While protectionism may offer short-term benefits to certain industries, it often leads to retaliatory measures from trading partners, eroding trust and cooperation. Over time, excessive protectionism can fragment the global trading system, undermining economic integration and growth.
3. Supply Chain Vulnerabilities
Global trade is heavily dependent on complex and interlinked supply chains. While these networks enable efficiency and cost savings, they also create significant vulnerabilities. Natural disasters, pandemics, labor strikes, or infrastructure failures can disrupt production and distribution. The COVID-19 pandemic highlighted the fragility of global supply chains, causing shortages of essential goods, medical supplies, and electronics. Similarly, events like the Suez Canal blockage demonstrated how a single chokepoint in logistics can halt the movement of goods worldwide. Businesses must now adopt more resilient and diversified supply chain strategies to mitigate these risks.
4. Cybersecurity Threats
As trade becomes increasingly digitized, cybersecurity has emerged as a critical concern. International trade relies on digital platforms for order processing, logistics management, and financial transactions. Cyberattacks, such as ransomware, data breaches, and infrastructure sabotage, can disrupt trade operations, compromise sensitive information, and erode trust among trading partners. For instance, a successful cyberattack on a major port or logistics hub could create widespread delays, impacting multiple industries simultaneously. Cybersecurity threats also intersect with geopolitical tensions, as state-sponsored cyber operations target foreign businesses and critical infrastructure.
5. Environmental and Climate Risks
Climate change and environmental degradation pose long-term threats to global trade. Extreme weather events, rising sea levels, and resource scarcity can damage infrastructure, disrupt transportation routes, and affect agricultural production. Ports, railways, and shipping routes are particularly vulnerable to storms, floods, and rising ocean levels. Furthermore, countries are increasingly implementing environmental regulations and carbon tariffs, which can affect trade flows and alter comparative advantages. Businesses must now consider sustainability and climate resilience as integral components of their trade strategies to ensure long-term viability.
6. Economic Volatility and Financial Risks
Global trade is closely linked to macroeconomic stability. Economic shocks—such as recessions, currency fluctuations, inflationary pressures, or debt crises—can reduce demand for exports and increase costs for importers. Volatility in commodity prices, interest rates, or exchange rates can destabilize international trade agreements and make long-term planning difficult. Financial disruptions can be particularly damaging for developing countries that rely heavily on trade revenues for economic growth. Multilateral cooperation and effective risk management are essential to mitigate the impact of financial instability on global trade.
7. Technological Disruptions
While technology drives efficiency in global trade, it also introduces risks. Automation, artificial intelligence, and digital platforms are reshaping supply chains, logistics, and customs procedures. However, reliance on emerging technologies can create vulnerabilities, such as system failures, compatibility issues, or technological monopolies. Moreover, rapid technological change can leave some countries or industries unprepared, creating imbalances in trade competitiveness. The rise of digital currencies and blockchain-based trade finance is promising but requires robust regulation to prevent fraud, cybercrime, and market manipulation.
8. Legal and Regulatory Challenges
Global trade operates within a framework of international agreements, national laws, and regulatory standards. Divergence in legal systems, trade regulations, and compliance requirements can create friction and increase operational costs for businesses. Intellectual property disputes, customs enforcement inconsistencies, and complex documentation procedures can delay shipments and disrupt trade flows. Furthermore, evolving international standards on labor, environment, and taxation can impose additional compliance burdens. Harmonization of trade rules and regulatory cooperation are critical to reducing these risks.
9. Social and Political Instability
Domestic unrest, political instability, and social movements in key trading nations can disrupt economic activity and trade relations. Protests, strikes, or government changes can affect production, transportation, and consumer confidence. Countries with unstable political environments may also impose sudden trade restrictions or renegotiate agreements, creating uncertainty for international businesses. Social and political stability, therefore, is an essential prerequisite for predictable and secure trade.
10. Global Health Crises
The COVID-19 pandemic underscored the profound impact health crises can have on global trade. Lockdowns, travel restrictions, and labor shortages disrupted production, logistics, and consumer demand worldwide. Future pandemics or health emergencies remain a potential threat to trade continuity. Strengthening global health systems, improving supply chain flexibility, and adopting contingency planning are essential to safeguard trade against similar crises.
Conclusion
Global trade is both an engine of economic growth and a complex system susceptible to a wide range of threats. Geopolitical conflicts, protectionism, supply chain vulnerabilities, cybersecurity risks, climate change, economic volatility, technological disruptions, regulatory inconsistencies, social instability, and health crises all pose significant challenges to the smooth functioning of international commerce. The interconnected nature of modern trade means that disruptions in one region or sector can cascade across the global economy, amplifying risks.
Addressing these threats requires coordinated efforts among governments, businesses, and international institutions. Diversifying supply chains, investing in technology and cybersecurity, adhering to environmental standards, and fostering stable political and economic environments are critical strategies. By proactively understanding and mitigating these risks, nations and businesses can enhance resilience, sustain growth, and ensure that global trade continues to serve as a driver of prosperity in an increasingly uncertain world.

Understanding the Forces Shaping Worldwide Economies1. Economic Drivers of Market Movements
At the core of global market fluctuations are economic indicators that provide insights into growth, inflation, and employment. Gross Domestic Product (GDP) growth rates, unemployment figures, and consumer spending patterns all influence investor confidence. For instance, when major economies like the United States, China, or the European Union show slower growth, global markets often react negatively, fearing reduced demand for goods and services worldwide. Conversely, strong economic performance in leading nations can boost market sentiment and fuel investment across sectors.
Monetary policies also play a crucial role. Central banks, such as the Federal Reserve or the European Central Bank, control interest rates and money supply. A rate hike to curb inflation can reduce liquidity in markets, affecting stock and bond prices globally. Similarly, quantitative easing or stimulus measures can inject capital into financial systems, boosting asset prices. Exchange rates and currency stability further affect international trade and investments, especially for emerging markets that depend heavily on foreign capital flows.
2. Geopolitical Events and Market Volatility
Global markets are extremely sensitive to geopolitical tensions, including conflicts, sanctions, and trade wars. For example, tensions between major powers can disrupt supply chains, increase commodity prices, and reduce investor confidence. Trade disputes, such as tariffs imposed between countries, directly affect multinational corporations, altering profit expectations and causing stock market fluctuations. Political instability in key regions, such as the Middle East or parts of Africa, can impact oil prices and global energy markets, influencing inflation and production costs worldwide.
Natural disasters and environmental issues are increasingly significant in affecting markets. Hurricanes, floods, or wildfires disrupt production and logistics, affecting commodity supply chains. Climate change concerns drive investment shifts toward sustainable technologies, reshaping global market priorities and creating winners and losers in different sectors.
3. Technological Disruption and Market Adaptation
Technology has transformed global markets, accelerating the pace at which information is disseminated and trades are executed. Innovations in artificial intelligence, blockchain, and financial technologies (FinTech) have created new investment opportunities while also introducing risks. Rapid changes in technology can disrupt traditional industries; for example, renewable energy innovations impact the fossil fuel sector, while automation reshapes manufacturing labor dynamics. Investors react quickly to these shifts, often leading to volatility in global stock exchanges.
Additionally, digital trading platforms and algorithmic trading amplify the speed and scale of market reactions. News spreads globally in seconds, influencing investor behavior and triggering rapid market movements. While these technological advancements increase market efficiency, they also create susceptibility to sudden corrections and speculative bubbles.
4. Globalization and Interconnectedness
One of the defining features of modern markets is globalization. No country’s market operates in isolation. Financial integration means that an economic shock in one nation can have cascading effects worldwide. The 2008 global financial crisis is a prime example: the collapse of the U.S. housing market and financial institutions triggered recessions in Europe, Asia, and beyond. Similarly, a slowdown in China, the world’s manufacturing hub, can affect commodity prices, supply chains, and corporate earnings globally.
Trade networks, investment flows, and multinational corporations link countries economically, while global indices and mutual funds spread exposure across continents. This interconnectedness allows for diversification but also means that systemic risks can propagate quickly.
5. Market Sentiment and Investor Psychology
Investor psychology significantly impacts global markets. Fear, uncertainty, and speculation can lead to sudden sell-offs or bubbles. Market sentiment often amplifies the effect of fundamental events. For instance, even minor geopolitical news can trigger sharp declines if investors perceive risk, while positive economic announcements can fuel rallies. Behavioral finance highlights that emotions, herd behavior, and perception of risk often override rational decision-making, causing markets to react disproportionately.
Media coverage, social networks, and financial news outlets shape market sentiment globally. The instantaneous spread of information allows sentiment to influence international markets simultaneously, creating synchronized movements across regions.
6. Emerging Markets and Their Vulnerability
Emerging markets are particularly vulnerable to global market fluctuations. These economies often rely on exports, foreign investments, and commodity revenues. Changes in global demand, interest rates in developed nations, or capital outflows can destabilize emerging markets’ currencies, stock exchanges, and debt markets. While emerging markets offer high growth potential, they are highly sensitive to global volatility, highlighting the asymmetric impact of global market shocks.
7. The Role of Commodities and Energy Markets
Commodities—oil, metals, agricultural products—are highly sensitive to global market trends. Price fluctuations in these markets affect inflation, corporate costs, and trade balances. Energy markets, particularly oil and gas, are closely tied to geopolitical developments. A disruption in supply due to political conflicts or natural disasters can lead to global price spikes, affecting industries and consumers worldwide. Similarly, agricultural market disruptions can lead to food inflation and social unrest in dependent regions.
8. Strategies for Navigating Global Market Uncertainty
Investors, corporations, and governments employ several strategies to mitigate the impact of market fluctuations. Diversification across regions, sectors, and asset classes reduces exposure to localized shocks. Hedging through derivatives, such as options and futures, allows market participants to manage risk. Central banks and regulatory authorities also intervene with policies to stabilize financial systems during crises.
For businesses, understanding global supply chains, geopolitical risks, and currency exposure is critical. Long-term planning involves scenario analysis, stress testing, and adapting business models to changing global dynamics. Individual investors increasingly focus on sustainable and resilient investments, considering environmental, social, and governance (ESG) factors, which have shown relative stability during turbulent periods.
Conclusion
Global markets are inherently interconnected and influenced by a broad spectrum of economic, political, technological, and environmental factors. Their behavior reflects both tangible indicators, like GDP growth or commodity prices, and intangible forces, such as investor sentiment and geopolitical uncertainty. Understanding these influences is essential for investors, policymakers, and businesses to navigate risks and capitalize on opportunities.
The impact of global market fluctuations extends far beyond stock prices—it affects employment, production, trade, and the overall well-being of societies. As markets become increasingly complex and technology-driven, participants must remain vigilant, adaptable, and informed. Awareness of the intricate forces shaping global markets enables smarter decisions, resilience in the face of volatility, and a proactive approach to both challenges and opportunities in the world economy.
