CEG BEFORE EARNINGSCEG is in a corrective leg after a clear rejection from the 330–345 supply zone, with prior distribution also visible around 360–370 (failed holds and heavy selling response on retests). The breakdown through the rising structure shifts control to sellers unless price can reclaim 330+.
Demand/absorption is currently concentrated at 280 (buyers repeatedly defending the level). If that bid weakens, the market likely seeks liquidity into the 280–255 gap, and then the next vacuum/rotation zone 230–210, with a deeper institutional support shelf near 200.
Targets
Upside targets (if 280 holds + reclaim 330): 330–345 first, then 360–370. Extension target: 410 (major overhead cap).
Downside targets (if 280 breaks): 255 first (gap fill), then 230–210, then 200.
Harmonic Patterns

Nvidia - The -25% correction starts now!✂️Nvidia ( NASDAQ:NVDA ) is about to create a correction:
🔎Analysis summary:
After Nvidia retested major support in mid 2025, we saw another rally of about +125%. But now, Nvidia is rejecting a major resistance trendline and is about to create bearish confirmation. Quite likely that Nvidia will create a major -25% correction in the future.
📝Levels to watch:
$140
SwingTraderPhil
SwingTrading.Simplified. | Investing.Simplified. | #LONGTERMVISION

USDCHF Oversold and approaching an 11-year Low.The USDCHF pair has been trading within a Channel Down since its November 2022 High rejection on the 1M MA200 (orange trend-line). This month isn't only approaching the bottom of that pattern but also Support 1, which consists of the January 2015 Low (0.74250).
With the 1M RSI almost oversold and similar to December 2020 (every oversold 1M RSI has historically been a massive long-term buy signal), we don't technically believe that this decline has much more room to extend to, beyond at least the -17.86% of the previous Bearish Leg.
Instead, we treat this as an excellent long-term buy opportunity, with a first Target on the 0.5 Fibonacci retracement level (again similar as the previous Channel Down rebound) at 0.83450. Note that this is more suited to long-term investors and not shorter term traders.
---
** Please LIKE 👍, FOLLOW ✅, SHARE 🙌 and COMMENT ✍ if you enjoy this idea! Also share your ideas and charts in the comments section below! This is best way to keep it relevant, support us, keep the content here free and allow the idea to reach as many people as possible. **
---
💸💸💸💸💸💸
👇 👇 👇 👇 👇 👇

Gold Is Breaking Higher — Next Move Depends on Pullback BehavesHello traders,
Gold has just delivered a strong impulsive expansion, lifting price decisively away from the prior consolidation and pushing the market toward new all time highs. The breakout was clean, vertical, and accompanied by clear follow-through a hallmark of initiative buying rather than short-term speculation. This confirms that the broader bullish structure remains firmly in control.
After such an aggressive push, the market is now entering a natural pause phase. This is not a signal of weakness. In strong trends, price rarely moves in a straight line. Instead, it often rotates or pulls back modestly to rebalance liquidity and allow momentum to reset. The projected retracement toward the five thousand one hundred ninety to five thousand one hundred seventy area aligns with prior structural interaction, making it a logical zone for buyers to reassess and defend.
As long as pullbacks remain corrective and contained above the highlighted support zone, the bullish thesis stays intact. Acceptance above this area would favor continuation toward the upper resistance and new ATH region around five thousand four hundred, where price discovery may temporarily slow again. This level should be viewed as a reaction zone, not a guaranteed destination.
Invalidation remains clearly defined. A decisive breakdown below the support zone would disrupt the current structure and shift focus toward a deeper consolidation or corrective phase. Until then, downside moves are best interpreted as part of a healthy trend digestion process.
Gold has already shown its hand. Now patience and structure will determine the next expansion.

BTC.D - Technical Analysis: Trendline Breakdown & Key LevelsWelcome to another Mubite technical update. Today we are focusing purely on the market structure of Bitcoin Dominance (BTC.D) on the 1H timeframe.
The index has just confirmed a significant structural shift that suggests a change in the immediate trend direction.
Here is the technical breakdown of the chart.
1. The Trendline Breakdown For several days, BTC.D has been respecting a steep ascending trendline (White Line), creating a series of higher lows.
The Signal: As shown on the chart, the price has now decisively broken below this trendline support. This invalidates the immediate uptrend structure on this timeframe.
2. The Immediate Support (Yellow Zone) The decline is currently approaching a critical demand cluster—the Yellow Zone located between 4,600 and 4,620.
Technical Importance: This zone previously acted as a consolidation base before the last leg up. We expect it to act as the first line of defense, potentially pausing the initial drop.
3. The Forecast: The "Break & Retest" Pattern Based on the breakdown, we are projecting a classic bearish continuation pattern, as illustrated by the white arrows:
Phase A (The Bounce): Upon hitting the Yellow Zone (4,600), we anticipate a bounce.
Phase B (The Retest): The index will likely attempt to rally back up to test the Broken Trendline. This trendline, which was previously support, should now flip to act as Resistance.
Phase C (Continuation): If the retest rejects at the trendline, it confirms the bearish structure, likely leading to a lower low below the yellow zone.
Summary
Trend: Bearish (Trendline Broken).
Key Support: 4,600 - 4,620.
Key Resistance: The underside of the ascending trendline.
Disclaimer: This analysis by Mubite is for educational purposes only and does not constitute financial advice. Always manage your risk.
What is your technical bias on this chart? Do you see a bounce or a straight drop? Let us know below.
-TuffyCalls (Team Mubite)

#XAUUSD | Gold – Daily Higher Timeframe Analysis 📊 **#XAUUSD | Gold – Daily Higher Timeframe Analysis 🥇**
⚖️ **We are now at a true make-or-break zone.**
Today’s **daily candle will decide the fate of gold**.
---
🚀 **Bullish Breakout Scenario**
* ✅ If today’s **daily candle sustains and closes bullish above 4380–4382**
(the **previous lifetime high**),
* 💥 We could witness **one of the biggest moves ever in gold**.
📈 From that breakout zone, I’m expecting a **minimum ~10% move**,
🎯 which projects gold toward **4700–4900** in a **very short span of time**.
---
⚠️ **Rejection / Pullback Scenario**
* ❌ If the daily candle **sweeps the previous lifetime high**
* 🕯️ And gives **strong rejection with a large upper wick**,
📉 That would signal a **temporary corrective move** toward:
* 📍 **4230–4179** → **Daily demand zone**
* 🟦 Along with a **small Daily FVG**, making it an **ideal buy-on-dips area**.
---
📌 Daily close is the key
📌 Patience over prediction
📌 Let the higher timeframe decide the next major leg 🧠🔥

CRYTPO SEASONAnother beautiful looking chart which tells us how much Cryptocurrencies are undervalued.
Good days are coming soon.
Nfa.

Gold prices may rise to $5220-$5250 today.Gold prices may rise to $5220-$5250 today.
Gold prices have reached the expected $5150-$5200 range, and we have once again seized this upward opportunity.
We have already profited over 100 points today.
I had already predicted this possibility in advance through public channels.
Next, we need to clarify a few key signals:
1: The short-term target price for this round of gold price increases is $5220-$5250. Please note that gold prices are likely to experience a pullback within this resistance range.
2: Gold prices are likely to continue fluctuating upwards during the upcoming Asian and European trading sessions, forming a high-level consolidation structure.
3: Gold prices still have significant upside potential. The final top remains unclear because current market forces are collectively accelerating the upward trend. The surge in gold prices will undoubtedly accelerate. However, we also need to be wary of potential future sell-off risks.
4. Gold prices will definitely fall, but there are two types of declines: a healthy structural correction and a sell-off-driven trend crash. As gold prices surge, the risk of a sharp drop from the highs also increases.
5. In the short term, always trust the bottom support level of the gold price trend. Buying on dips is the best strategy for intraday trading.
As shown in the chart: I predict the maximum potential upside for gold prices on Wednesday will be in the $5220-$5250 range.
Please continue to follow my channel; I will continuously analyze real-time trends and share the latest trading signals. If you have any questions, please leave a message, and I will answer them for you.

Gold High-Range Consolidation Trading SignalsGold traded in a strong consolidation pattern at highs today, extending the recent bullish trend of six consecutive positive days. However, short-term overbought conditions are building pullback pressure, with market sentiment turning cautious ahead of the Federal Reserve's monetary policy meeting.
Core Support Levels:5050-5060 (5-day MA + recent pullback low, heavy buying zone);
Secondary Support: 5010-5015 (intraday low + round number, dual psychological and technical support);
Strong Support: 4980-4990 (previous consolidation range, key defensive level for the bullish trend).
Core Resistance Levels:5090-5100 (intraday high + round number, concentrated short-term selling pressure);
Secondary Resistance: 5120-5130 (previous high extension, requires volume to break through);
Strong Resistance: 5150-5160 (trend extension, needs positive catalyst for a breakout).
Trading Strategy:
Buy 5050 - 5060
SL 5040
TP 5090 - 5100 - 5110
Sell 5090 - 5100
SL 5110
TP 5070 - 5060 - 5050

AUDUSD 1📌 AUDUSD – Buy Limit Setup (Professional Analysis)
🔹 Entry: 0.69600
🔹 Stop Loss: 0.68700
🔹 Take Profit: 0.71400
📈 Market Structure & Bias:
AUDUSD remains in a strong bullish market structure on the higher timeframe, with price consistently forming higher highs and higher lows. The recent impulsive rally confirms sustained bullish momentum and buyer dominance.
🔍 Technical Confluence:
The 0.69600 level aligns with a key support and demand zone, acting as a previous resistance turned support.
This area represents a pullback zone following the recent bullish expansion.
Historical price action shows clear bullish reactions from this level, validating it as a high-probability entry zone.
🛡 Risk Management:
Stop loss is placed below the previous swing low to invalidate the setup if bullish structure fails.
Take profit is positioned near a major resistance level, offering a favorable risk-to-reward ratio.
📌 Trade Expectation:
Price is expected to retrace into the demand zone before resuming bullish continuation toward the upside target.
⚠️ Disclaimer:
This analysis is for educational purposes only. Always apply proper risk management and trade responsibly.

WTI OIL closing its first green month after 5 straight red.One month ago (December 30 2025, see chart below), we gave a strong long-term buy signal on WTI Oil (USOIL), as it hit its 8-month Support on a 1W RSI Bullish Divergence:
The price reacted very positively and is about to close its first green 1M candle after 5 straight red. This is why we bring you this time the same chart but on the 1M time-frame. At the same time pay close attention to the 1M MA200 (orange trend-line), which delivered the last strong rejection for the market, which last time closed a month above it exactly a year ago (Jan 2025).
This is why we stay firm on our $69.00 Target, which isn't only on the 0.618 Fibonacci retracement level (where all 3 previous Bullish Legs of the 2-year Channel Down retraced) but also below the long-term Resistance posed by the 1M MA200.
As a side-note, to get an idea of how bearish the market is on the long-term (and why a sell at the top of the Channel Down is later suggested), Oil hasn't closed a month above its 1M MA50 (blue trend-line) since July 2024.
---
** Please LIKE 👍, FOLLOW ✅, SHARE 🙌 and COMMENT ✍ if you enjoy this idea! Also share your ideas and charts in the comments section below! This is best way to keep it relevant, support us, keep the content here free and allow the idea to reach as many people as possible. **
---
💸💸💸💸💸💸
👇 👇 👇 👇 👇 👇

WTI CrudeVolatility has been moderate with occasional swings tied to macro headlines (e.g., inventory data and geopolitical cues), but no persistent trend acceleration. Range contraction has defined much of the recent sessions.
WTI pricing has been influenced by:
Geopolitical risk repricing, including geopolitical headlines that caused short-term spikes and retracements.
U.S. crude inventory builds and supply concerns, exerting downward pressures at times.
Mixed supply/demand signals and market focus on physical fundamentals ahead of major inventory reports have kept traders cautious.
Over this ten-day window, WTI has failed to sustain a strong directional trend, instead trading within a structurally narrow band. The market remains range-oriented.
Like & Share...

EURJPY H4 | Could We See A Bullish Reversal?Based on the H4 chart analysis, we can see that the price has bounced off our buy entry level at 182.42, which his an overlap support.
Our stop loss is set at 181.36, which is a pullback support.
Our take profit is set at 184.77, which is a pullback resistance.
High Risk Investment Warning
Stratos Markets Limited fxcm.com Stratos Europe Ltd fxcm.com
CFDs are complex instruments and come with a high risk of losing money rapidly due to leverage. 69% of retail investor accounts lose money when trading CFDs with this provider. You should consider whether you understand how CFDs work and whether you can afford to take the high risk of losing your money.
Stratos Global LLC fxcm.com Losses can exceed deposits.
Please be advised that the information presented on TradingView is provided to FXCM (‘Company’, ‘we’) by a third-party provider (‘TFA Global Pte Ltd’). Please be reminded that you are solely responsible for the trading decisions on your account. Any information and/or content is intended entirely for research, educational and informational purposes only and does not constitute investment or consultation advice or investment strategy. The information is not tailored to the investment needs of any specific person and therefore does not involve a consideration of any of the investment objectives, financial situation or needs of any viewer that may receive it. Past performance is not a reliable indicator of future results. Actual results may differ materially from those anticipated in forward-looking or past performance statements. We assume no liability as to the accuracy or completeness of any of the information and/or content provided herein and the Company cannot be held responsible for any omission, mistake nor for any loss or damage including without limitation to any loss of profit which may arise from reliance on any information supplied by TFA Global Pte Ltd.
Stratos Trading Pty. Limited fxcm.com
Trading FX/CFDs carries significant risks. FXCM AU (AFSL 309763), please read the Financial Services Guide, Product Disclosure Statement, Target Market Determination and Terms of Business at fxcm.com

Nifty SpotA sharp downturn occurred on January 23, when the index dropped to approximately 25,048.65, reflecting intense selling and risk aversion. This was one of the more pronounced near-term drops within the ten-day window.
The recent weakness was influenced by:
Global trade concerns and geopolitical noise, which weighed on risk assets and dragged domestic benchmark performance.
Foreign portfolio investor outflows, particularly around mid-January, which compounded selling pressure.
Sector-specific weakness, notably in technology and mid/small-cap segments during the down phase.
Run up to Budget on FEB 1 ... volatility will increase
marked important price action levels marked...
Like and share

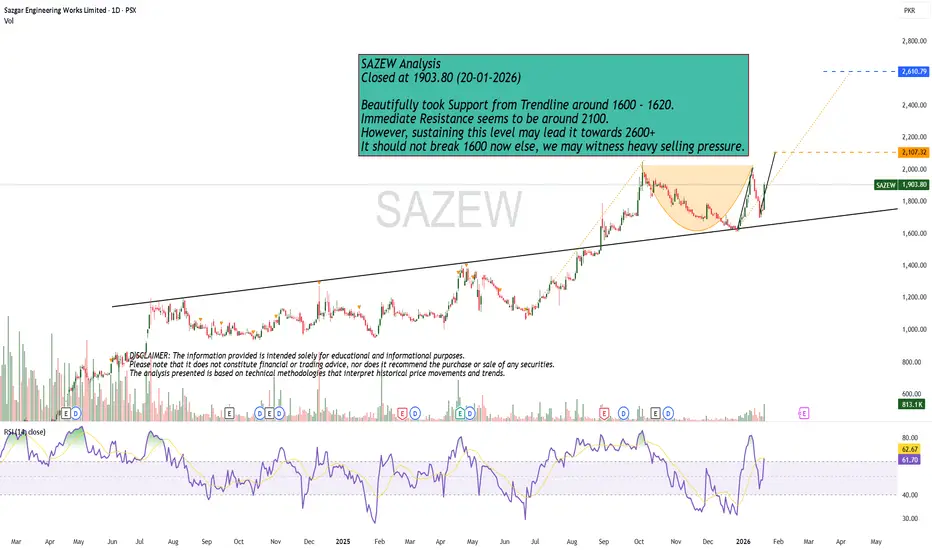
Nice Patterns !SAZEW Analysis
Closed at 1903.80 (20-01-2026)
Beautifully took Support from Trendline around 1600 - 1620.
Immediate Resistance seems to be around 2100.
However, sustaining this level may lead it towards 2600+
It should not break 1600 now else, we may witness heavy selling pressure.
GBPCAD H1 | Bullish Bounce Off Pullback SupportMomentum: Bullish
Price is currently above the ichimoku cloud.
Buy entry: 1.87666
- Pullback support
- 50% Fib retracement
- 78.6% Fib projection
Stop Loss: 1.87393
- Overlap support
Take Profit: 1.88027
- Swing high resistance
High Risk Investment Warning
Stratos Markets Limited (fxcm.com/uk), Stratos Europe Ltd (fxcm.com/eu):
CFDs are complex instruments and come with a high risk of losing money rapidly due to leverage. 69% of retail investor accounts lose money when trading CFDs with this provider. You should consider whether you understand how CFDs work and whether you can afford to take the high risk of losing your money.
Stratos Global LLC (fxcm.com/en): Losses can exceed deposits.
Please be advised that the information presented on TradingView is provided to FXCM (‘Company’, ‘we’) by a third-party provider (‘TFA Global Pte Ltd’). Please be reminded that you are solely responsible for the trading decisions on your account. Any information and/or content is intended entirely for research, educational and informational purposes only and does not constitute investment or consultation advice or investment strategy. The information is not tailored to the investment needs of any specific person and therefore does not involve a consideration of any of the investment objectives, financial situation or needs of any viewer that may receive it. Past performance is not a reliable indicator of future results. Actual results may differ materially from those anticipated in forward-looking or past performance statements. We assume no liability as to the accuracy or completeness of any of the information and/or content provided herein and the Company cannot be held responsible for any omission, mistake nor for any loss or damage including without limitation to any loss of profit which may arise from reliance on any information supplied by TFA Global Pte Ltd.
Stratos Trading Pty. Limited (fxcm.com/au):
Trading FX/CFDs carries significant risks. FXCM AU (AFSL 309763), please read the Financial Services Guide, Product Disclosure Statement, Target Market Determination and Terms of Business at fxcm.com/au

USDCAD H4 | Bearish Reaction Off Pullback ResistanceMomentum: Bearish
Price is currently below the ichimoku cloud.
Sell entry: 1.37831
- Pullback resistance
- 61.8% Fib retracement
- Fair value gap
Stop Loss: 1.38336
- Swing high resistance
Take Profit: 1.36765
- Swing low support
High Risk Investment Warning
Stratos Markets Limited (fxcm.com/uk), Stratos Europe Ltd (fxcm.com/eu):
CFDs are complex instruments and come with a high risk of losing money rapidly due to leverage. 69% of retail investor accounts lose money when trading CFDs with this provider. You should consider whether you understand how CFDs work and whether you can afford to take the high risk of losing your money.
Stratos Global LLC (fxcm.com/en): Losses can exceed deposits.
Please be advised that the information presented on TradingView is provided to FXCM (‘Company’, ‘we’) by a third-party provider (‘TFA Global Pte Ltd’). Please be reminded that you are solely responsible for the trading decisions on your account. Any information and/or content is intended entirely for research, educational and informational purposes only and does not constitute investment or consultation advice or investment strategy. The information is not tailored to the investment needs of any specific person and therefore does not involve a consideration of any of the investment objectives, financial situation or needs of any viewer that may receive it. Past performance is not a reliable indicator of future results. Actual results may differ materially from those anticipated in forward-looking or past performance statements. We assume no liability as to the accuracy or completeness of any of the information and/or content provided herein and the Company cannot be held responsible for any omission, mistake nor for any loss or damage including without limitation to any loss of profit which may arise from reliance on any information supplied by TFA Global Pte Ltd.
Stratos Trading Pty. Limited (fxcm.com/au):
Trading FX/CFDs carries significant risks. FXCM AU (AFSL 309763), please read the Financial Services Guide, Product Disclosure Statement, Target Market Determination and Terms of Business at fxcm.com/au

QuyetP | EURUSD: Buy Until the Trend BreaksFX:USDOLLAR is in a strong bearish trend as we all see.
OANDA:EURUSD price just retraced exactly at the 1H base zone and swept previous 1H low - just a breakout + retest setup.
That is enough reasons for me to enter a continuation buy setup.
"If a trading setup needs too much explanation, it’s probably not a good trade." :)

PIAHCL I am Anticipating that PIA is on a potentially deeply retracement after a long rally but peoples are worrying is it going to crash there is no need to worry it’s a healthy correction for next move . But be cautious take entries with strict stop loss which is highlight on chart .
As we are all know trading is just probility game please do your own research before investing it’s a highly volatile stock with weak fundamentals .

It's a time for Richtech Robotics - 40% potential profit - 5 USDThe chart of Richtech Robotics Inc. (RR) shows a consolidation phase following a strong prior downtrend, which in recent sessions has begun to form a potential trend reversal structure. Price has repeatedly defended the $3.40–$3.60 support zone, indicating strong demand and the formation of a local bottom.
The stock is now holding above short-term moving averages, with those averages starting to flatten, a technical condition that often precedes an upside move. In addition, the price action is forming higher lows, suggesting that buyers are gradually gaining control.
A confirmed break and hold above the $3.60–$3.70 level could act as a trigger for further upside, as there is relatively low supply above this area until the next major resistance around $5.00, which aligns with previous swing highs.
A move toward $5.00 represents roughly 40% upside potential, consistent with the stock’s historical volatility and the measured move projected on the chart. This bullish scenario remains valid as long as price continues to hold above the $3.50–$3.60 support zone.
Potential TP: 5 $
Disclaimer:
This analysis is provided for informational and educational purposes only and does not constitute investment advice or a recommendation to buy or sell any financial instrument. Trading and investing involve risk, including the potential loss of capital. Always conduct your own research and make investment decisions based on your individual risk tolerance.

28 Jan USOIL outlook: Bullish momentum persistsUSOIL surged, extending gains amid supply disruptions and geopolitical concerns that are boosting crude demand.
Severe winter storms in the US curtailed production by up to 2 million barrels per day, roughly 15% of national output, while halting Gulf Coast exports. Delays in restarting infrastructure amid icy conditions may sustain tight supply in the near term.
Meanwhile, inventories and currency dynamics provided additional support. API data showed a surprise draw in US crude stocks, while a weaker US dollar made dollar-denominated oil more attractive to global buyers.
Elsewhere, geopolitical risks added further upside. Market attention remains on US military activity in the Middle East and potential escalation, keeping traders cautious and supportive of oil prices.
From a technical perspective, USOIL broke the weekly breaker block and rebounded from the zone. The higher swings suggest the uptrend persists, with potential for further upside. Holding above 60.90 may prompt a further rally toward the swing high at 66.42. Conversely, breaking below 60.90 may prompt a consolidation within the weekly breaker block in grey.
By Li Xing Gan, Financial Markets Strategist Consultant to Exness

Bullish bounce off pullback support?AUD/NZD is falling towards the pivot, which has been identified as a pullback support and could bounce to the 1st resistance.
Pivot: 1.15978
1st Support: 1.15645
1st Resistance: 1.16583
Disclaimer:
The opinions given above constitute general market commentary and do not constitute the opinion or advice of IC Markets or any form of personal or investment advice.
Any opinions, news, research, analyses, prices, other information, or links to third-party sites contained on this website are provided on an "as-is" basis, are intended to be informative only, and are not advice, a recommendation, research, a record of our trading prices, an offer of, or solicitation for, a transaction in any financial instrument and thus should not be treated as such. The information provided does not involve any specific investment objectives, financial situation, or needs of any specific person who may receive it. Please be aware that past performance is not a reliable indicator of future performance and/or results. Past performance or forward-looking scenarios based upon the reasonable beliefs of the third-party provider are not a guarantee of future performance. Actual results may differ materially from those anticipated in forward-looking or past performance statements. IC Markets makes no representation or warranty and assumes no liability as to the accuracy or completeness of the information provided, nor any loss arising from any investment based on a recommendation, forecast, or any information supplied by any third party

Bullish continuation?NZD/CAD is falling towards the pivot and could bounce to the 1st resistance.
Pivot: 0.81236
1st Support: 0.80788
1st resistance: 0.82094
Disclaimer:
The opinions given above constitute general market commentary and do not constitute the opinion or advice of IC Markets or any form of personal or investment advice.
Any opinions, news, research, analyses, prices, other information, or links to third-party sites contained on this website are provided on an "as-is" basis, are intended to be informative only, and are not advice, a recommendation, research, a record of our trading prices, an offer of, or solicitation for, a transaction in any financial instrument and thus should not be treated as such. The information provided does not involve any specific investment objectives, financial situation, or needs of any specific person who may receive it. Please be aware that past performance is not a reliable indicator of future performance and/or results. Past performance or forward-looking scenarios based upon the reasonable beliefs of the third-party provider are not a guarantee of future performance. Actual results may differ materially from those anticipated in forward-looking or past performance statements. IC Markets makes no representation or warranty and assumes no liability as to the accuracy or completeness of the information provided, nor any loss arising from any investment based on a recommendation, forecast, or any information supplied by any third party
