Buy ideaReverse head and shoulders looks to be forming, with rejection at the left shoulder’s support, could see a push up to 88 if no break below support! Let me know what you think!! Comments and/or suggestion highly appreciated :)
Head and Shoulders

ASTER (ASTERUSDT): Will Dump to 1.00$? Here's Why!📉ASTER formed a nice head and shoulders pattern on a hourly time frame.
The bearish violation of its neckline is a strong bearish reversal signal.
We can expect more decline and test of 1.198 / 1.00 level soon.

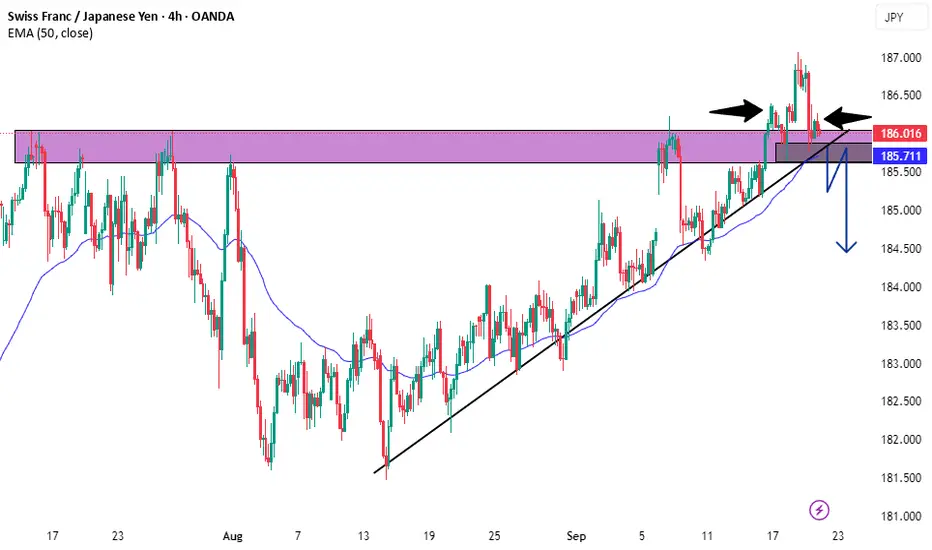
CHFJPY False Breakout & Bearish Reversal Trade.- Price broke Key Resistance level at (186.049 - 185.625) and close above the level.
- Price later retested Key Resistance Level & formed Head & Shoulders pattern Neckline at (185.883 - 185.633).
- Rising Bullish Trendline Tested Multiple Times.
* Break of Trendline Entry since we are going against the dominant uptrend.
* Wait for Break & Retest of Head & Neckline at (185.883 - 185.633)) for Entry .
Without either of these 2 conditions the bearish trade setup is invalidated.
EURUSDPrice has been playing around the weekly support zone for more than two months now and is showing and inverse head a shoulders pattern. Approximately at the neckline area, Lets see what price action we get this week.

GBPUSD: Bullish Cypher Pattern + Price Action Opportunity In today’s video, we break down two potential bullish trading opportunities on GBPUSD.
🔹 The first setup is a bullish Cypher pattern, offering a high-probability harmonic trading opportunity.
🔹 The second is a price action trade, based on a key level of structure that has been tested multiple times in recent market history.
If you have any questions, comments or just want to share your ideas, please feel free to do so below & as always show some support by hitting that LIKE button before you go!
Akil

CZ's DOG Broccoli - potential inv. head & shoulders.With #BNB cruising past the key $1000 mark.
Let's take a look at the CZ memecoin based on his pet dog #Broccoli.
*Memes should be fun gambles*
any allocation above 1% can start causing financial damage in your portfolio!
But as lesson in speculation they can be great tools!
And a chart is a chart.
Let's see if this coin can bust through that wide neckline.

YOU MAY LIVE TO SEE MANMADE HORRORS BEYOND YOUR COMPREHENSION :)"Beyond Technical Analysis" aka "Wave Analysis > Shingo Waves"
Some very notable calls in recent years:
SPREADEX:NIKKEI and TVC:DJI both to 40k (over 1y in advance)
CRYPTOCAP:BTC pico bottom at 15k and recent local top at 70k
FX:EURUSD pico bottom & TVC:DXY pico top at 115
TVC:USOIL pico bottom at 68
NASDAQ:SMCI mega breakout at 100
NASDAQ:NVDA mega support at 120
NASDAQ:TSLA pico bottom at 105
NASDAQ:NFLX pico bottom at 165
I've also absolutely NAILED _both_ OANDA:XAUUSD and OANDA:XAGUSD breakouts in their entirety (@ see history)
EURAUD – Wave Analysis OutlookEURAUD has reacted well from the green support zone, completing a corrective (X) leg and bouncing higher. Current price action is testing the neckline area of a potential reversal setup.
If consolidation holds at this level, I’ll look for long opportunities, with the next leg higher likely targeting the 1.81–1.82 zone in line with the wave count.
👉 Watching closely for a base to form here before confirmation of the next upward swing.
⚠️ Disclaimer: This outlook is based on my personal wave analysis and shared for educational purposes only. It is not financial advice.

DELL | New All Time Highs Incoming | LONGDell Technologies, Inc. is a technology company, providing customers with a broad and innovative solution portfolio to help customers modernize their information technology (IT) infrastructure, address workforce transformation, and offer critical solutions that keep people and organizations connected. It operates through the following segments: Infrastructure Solutions Group (ISG) and Client Solutions Group (CSG). The ISG segment includes servers, networking, and storage, as well as services and third-party software and peripherals that are closely tied to the sale of ISG hardware. The CSG segment includes designs for commercial and consumer customers of desktops, thin client products, and notebooks. The company was founded by Michael Saul Dell in 1984 and is headquartered in Round Rock, TX.

GBPAUD: Strong Bearish Price ActionAfter a test of a critical daily resistance cluster, two robust bearish confirmations are evident on 📈GBPAUD.
The price violated the trend line of a rising channel and the neckline of a head & shoulders pattern with a single, strong bearish candle.
Further downward movement is anticipated, potentially reaching the 2.0384 level in the near term.

PGIL INVERSE HEAD AND SHOULDER IN PROGRESSI am bullish on PGIL.
You may book profit at resistance or wait for the neckline to break and see the rise of a multibagger stock.
Target is mentioned it may take an year or more but worth waiting.

SOXL 1D — With a base like this, the ride’s worth itOn the daily chart of SOXL, since early March, a textbook inverse head and shoulders pattern has formed and is now in its activation phase. The left shoulder sits at $16.67, the head at $7.21, and the right shoulder at $15.11. The symmetry is classic, with volume stabilization and a narrowing range — all the elements are in place.
The key moment was the breakout through the descending daily trendline around $19.00. Price didn’t just pierce the level — it held above it, signaling a phase shift. There was an attempt to break through the 0.5 Fibonacci level at $19.60, which led to a pullback — not on heavy selling, but on decreasing volume. This wasn’t a rejection, it was a pause.
This pullback serves as a retest of the breakout zone and the 20-day moving average. The overall structure remains bullish: price stays above all key EMAs and MAs, RSI climbs past 60, and the candlestick structure is stable. Volume rises during up moves and fades during pullbacks — classic signs of reaccumulation.
The measured target from the pattern is $32.00, calculated from the head-to-neckline height projected from the breakout point. As long as price holds above $18.40, the setup remains intact. A break above $19.60 with confirmation would open the door to acceleration.
This isn’t a momentum play — it’s a setup months in the making. The structure is there, the confirmation is there, and most importantly — the price behavior makes sense. With a base like this, the ride ahead looks worth taking.

AUDUSD Short SetupTrend: Bearish
Divergence: Bearish
Continuation Pattern: No
Bias: Bearish
Scenario: Head N Shoulder Pattern, SL at Shoulder 2 (LH)
Trade Plan
Stop Loss 0.66837
Entry Level 0.66299
TP1 0.65765

ARM Holdings — reversal pattern signals growth potentialOn the ARM chart an inverted head and shoulders pattern is taking shape with price approaching the neckline around 144–145 and a confirmed breakout above this level could trigger an upward move toward 220 with extended targets at 310–330. In case of a pullback the 128 zone remains key support to preserve the bullish structure. Fundamentally ARM continues to strengthen its role in chip architecture while growing demand in artificial intelligence and mobile technologies drives institutional interest. As long as the pattern holds the bullish scenario stays in play.

GBPUSDStrong weekly zone and daily support trendline holding price up. Have some sort of inverse head and shoulder with neckline broken and retest happening. If we push higher next possible target is the monthly resistance zone around 1.42000

KPITKPIT Fut broke out of rounding bottom as well as inverse head & shoulder pattern on daily charts with above average volume & decrease in OI (-6%) suggesting shortcovering.
Risk:Reward = 1:3
Could b bought with mentioned stoploss & target.

AVAX Moving toward new targetAs I said before, AVAX/USDT has started moving toward a new target.
You can clearly see a Head and Shoulders pattern forming, which could signal a strong upcoming move.
Make sure to wait for confirmation before entering the trade, and always manage your risk properly.
NOTE: Don’t forget to put a stop loss on every trade to protect your capital, and consider adjusting it as the price moves in your favor.

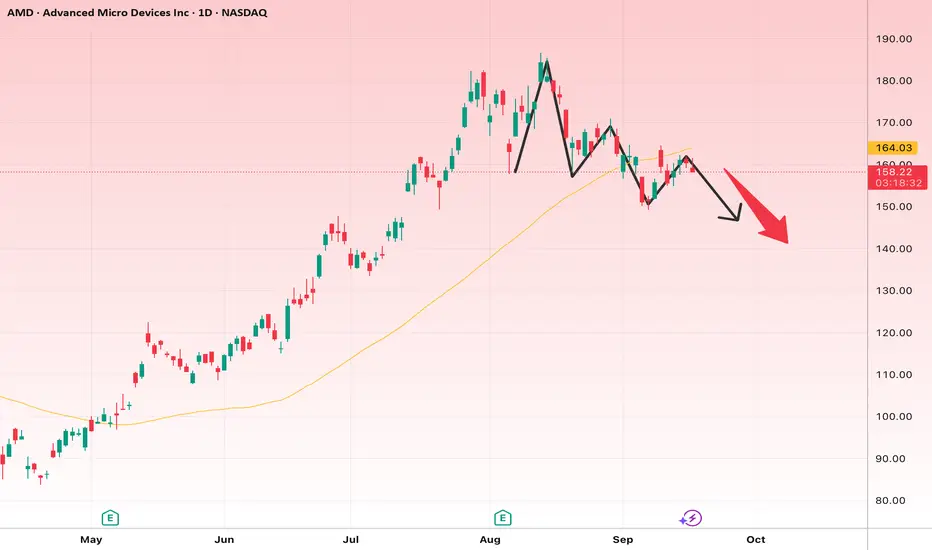
AMD at a Crossroads: Deep Correction or a Launch to New Highs?
🔎 Technical Analysis (Based on the Chart)
Recent Trend:
After a sharp rally from around $100 to nearly $180, the stock entered a corrective phase.
A series of lower highs and lower lows suggests the start of a short-term downtrend.
Price is now trading below the 50-day moving average (yellow line), which is a bearish signal.
Patterns & Price Action:
The chart shows a possible Head & Shoulders structure or at least a similar bearish formation.
The red arrow indicates potential downside movement toward lower levels.
📉 Short-Term Outlook (2–6 weeks)
Bias: Bearish
Targets:
First target: $150
Second target: $140 (if support breaks)
Stop-loss: A confirmed close above $166–168 (back above the moving average and resistance).
📈 Long-Term Outlook (3–6 months)
If the current correction extends, the stock could dip toward $135–140, then potentially start a new bullish phase.
Upside Targets:
First target: $180 retest
Second target: $200–210 if the historical high breaks
Stop-loss (long-term): A confirmed close below $135 (break of major support, trend reversal to bearish).
✅ Summary:
Short-term: Likely correction toward $150–140.
Long-term: As long as $135 holds, bullish targets toward $200 remain valid.
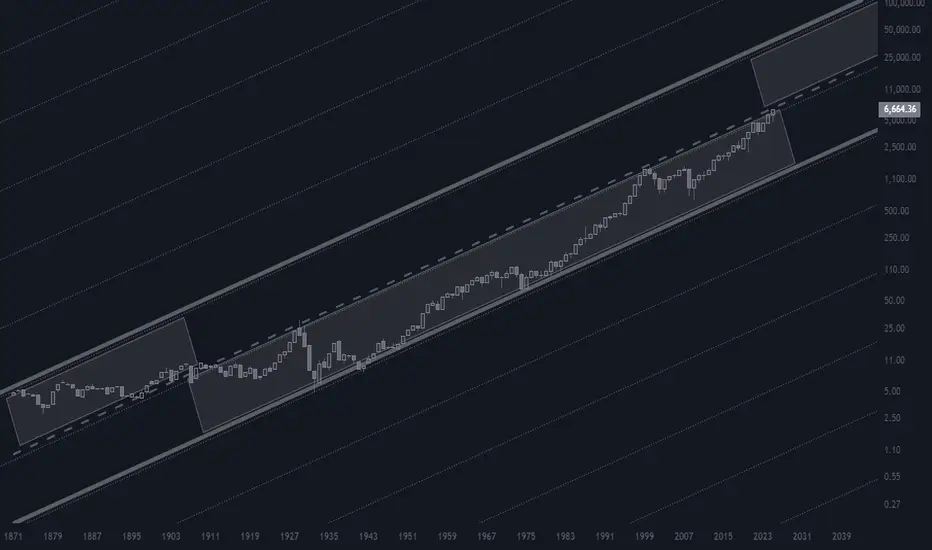
71XA 71X Multiple vs Ethereum no less!
The chart is self explanatory.
We have two Large Technical structures.
The first one, met it's Log target and overperformed.
Whilst the second has yet to trigger.
Yeah Still early!
Aren't I a caring guy in sharing this idea ;)
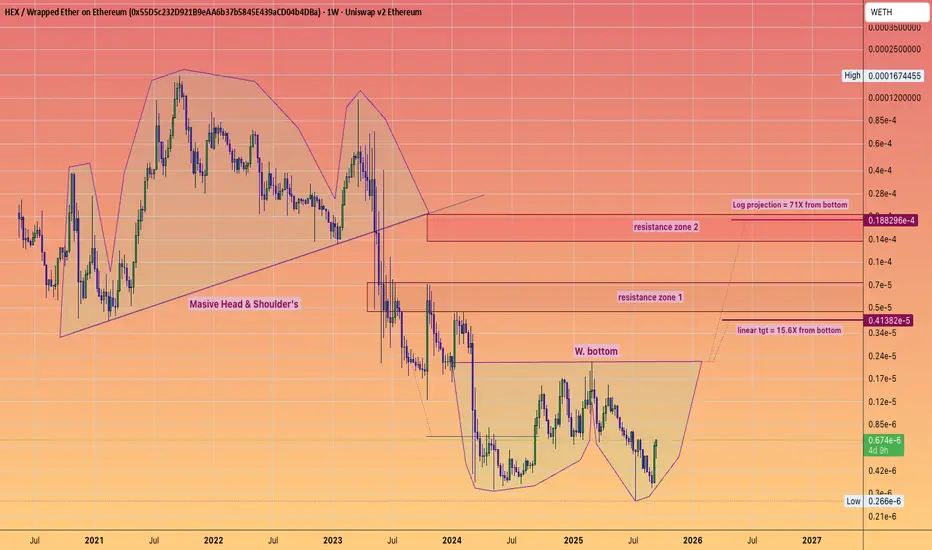
#HeadandShoulders
#Wpattern
#DoubleBottom
AUDCHF: Heading To Support Zone!?AUDCHF have been on lower highs and lower lows, in regards to the yesterday daily candle the pair observed the resistance area and as expected it is moving down to the next partial support at a target of 0.5163.
meanwhile a confirmed breakout would trigger a move below the next support area.
Key Points;
To my fellow intraday traders this is an opportunity to short with target at 0.5225 as first Tp.
Like and follow up
Thanks for reading

4H USD/CAD Head + Shoulders PatternWaiting for potential break and retest of the 1.37200 level. If this happens, I’ll be watching USD/CAD on a lower timeframe in order a for a better entry. I’ll be placing my TP around the 1.3600 level and my SL around the 1.37400 level.

MTB - 9 months HEAD & SHOULDERS══════════════════════════════
Since 2014, my markets approach is to spot
trading opportunities based solely on the
development of
CLASSICAL CHART PATTERNS
🤝Let’s learn and grow together 🤝
══════════════════════════════
Hello Traders ✌
After a careful consideration I came to the conclusion that:
- it is crucial to be quick in alerting you with all the opportunities I spot and often I don't post a good pattern because I don't have the opportunity to write down a proper didactical comment;
- since my parameters to identify a Classical Pattern and its scenario are very well defined, many of my comments were and would be redundant;
- the information that I think is important is very simple and can easily be understood just by looking at charts;
For these reasons and hoping to give you a better help, I decided to write comments only when something very specific or interesting shows up, otherwise all the information is shown on the chart.
Thank you all for your support
🔎🔎🔎 ALWAYS REMEMBER
"A pattern IS NOT a Pattern until the breakout is completed. Before that moment it is just a bunch of colorful candlesticks on a chart of your watchlist"
═════════════════════════════
⚠ DISCLAIMER ⚠
The content is The Art Of Charting's personal opinion and it is posted purely for educational purpose and therefore it must not be taken as a direct or indirect investing recommendations or advices. Any action taken upon these information is at your own risk.

MAVI - 13 months HEAD & SHOULDERS══════════════════════════════
Since 2014, my markets approach is to spot
trading opportunities based solely on the
development of
CLASSICAL CHART PATTERNS
🤝Let’s learn and grow together 🤝
══════════════════════════════
Hello Traders ✌
After a careful consideration I came to the conclusion that:
- it is crucial to be quick in alerting you with all the opportunities I spot and often I don't post a good pattern because I don't have the opportunity to write down a proper didactical comment;
- since my parameters to identify a Classical Pattern and its scenario are very well defined, many of my comments were and would be redundant;
- the information that I think is important is very simple and can easily be understood just by looking at charts;
For these reasons and hoping to give you a better help, I decided to write comments only when something very specific or interesting shows up, otherwise all the information is shown on the chart.
Thank you all for your support
🔎🔎🔎 ALWAYS REMEMBER
"A pattern IS NOT a Pattern until the breakout is completed. Before that moment it is just a bunch of colorful candlesticks on a chart of your watchlist"
═════════════════════════════
⚠ DISCLAIMER ⚠
The content is The Art Of Charting's personal opinion and it is posted purely for educational purpose and therefore it must not be taken as a direct or indirect investing recommendations or advices. Any action taken upon these information is at your own risk.
