ETHEREUM (ETH/USD): Comeback? Eyes on $4300 Resistance.ETHEREUM appears to be showing some bullish signals following a test of a significant daily support level.
The price formed an inverted head and shoulders pattern on that, succeeded by a bullish breakout above its neckline, which is serving as a minor resistance, thereby confirming a local change of character.
Considering these factors, there is a possibility that the price of the coin could potentially rise to the $4300 level.
Head and Shoulders

THIRD POSITIION ON SCRTUSDTLet's see how my third position play out. Higher high or lower high? Market leads, I follow

CRUDE OIL "3 Heads Monster"Could this 3 Heads & Shoulders come to live ?
Built in "Close Price Line Chart" (Candle = Same formation)
Small (black) H&S Target @ 59.34
Medium (orange) H&S Target @ 44.32
Large (blue) H&S Target @ 10.29

ETHUSDT: Head And Shoulders Pattern, Price Targets! $3,676Hi everyone,
Lets grasp a sight on ETHUSDT, we can clearly notice that Ethereum have lately concluded the head and shoulders pattern setup. the price have been ranging for some few hours after touching the neckline region, presently we are expecting a breakdown below this region.
Meanwhile a confirmed breakout from the neckline region would activate a downside movement with momentum aim for $3,676.
Like and follow up,
Thanks for reading.

Buyers are likely to step into AUDNZD at this levelThis Head and shoulder pattern formed on this key level could potentially reveal the interest of buyers at this daily key level.
Let's watch and see

EURAUDGot rejected at daily resistance.
H4/H1 has given a head and shoulder with neckline broken, retest has been made with H4 rejecting with a bearish engulfing candle. Targeting daily support since we're in a daily range.

GBP/AUD: Downward movement is Expected!The 📉GBPAUD price formed a head and shoulders pattern, and its neckline was breached yesterday on a 4-hour time frame.
A retest is currently underway.
It seems highly probable that the price will continue to decline, potentially reaching the 2.0500 level in the near future.

AUDJPYDaily support zone of 97.000 help up once again. H4 & H1 are showing an inverse head and shoulder pattern. Waiting for clear breakout of neckline with possible retest to look for buys. If we get a clear break above 99.400, 100.500 could be second target. For now, we watch and wait.
(NZDJPY has a similar setting but AUDJPY shows a nice upward movement on the daily TF)

ETH USD HEAD AND SHOULDER PATTERNBear pattern on ETH
Look to retrace lower look for continuation before medium term outlook

EURUSD SELLThe EURUSD on the 2H/ 4H has created a head and shoulders and has broke the neckline
also the daily has a left head right shoulder and it looks the daily has came back to retest the neckline and all we are waiting for is the break of the AOI to go short targeting a weekly AOI. Also we see a beautiful trend line forming

XAUUSD long Gold has been on a 9 week complete bullish run
• Price dropped to a key zone where price has moved away from.
•price formed a reversal pattern in the direction favouring the overall uptrend ( inverse head & shoulders )
• expecting a slight pull back to enter a long on this trade.

Gbp/Usd - Inverse Head & Shoulders Targeting Bullish BreakoutA potential bullish reversal is forming on GBP/USD in the 15-minute chart via a classic Inverse Head and Shoulders pattern.
Pattern Details:
Left Shoulder: Formed with a minor pullback and recovery.
Head: A deeper dip indicating strong buyer absorption and bottoming.
Right Shoulder: Symmetrical pullback signaling the potential end of the bearish move.
Neckline: Marked by horizontal resistance (around 1.34395) — a confirmed breakout above this level may trigger bullish continuation.
Trade Idea:
Entry Zone: On breakout and close above neckline (~1.34400)
Target 1: Previous structural resistance (~1.34680)
Target 2: Extended move toward ~1.35070
Stop Loss: Below the right shoulder or neckline retest (~1.34186)
Analysis Notes:
This pattern suggests bullish momentum is building.
Confirmation needed via volume spike or candle close above neckline.
Risk-to-reward ratio is favorable for short-term intraday trade.

Canadian Venture index --- Inverse head & shouldersGold has reached unprecedented heights, approaching the $3000 mark—a prediction we made with precision. Now is the moment to turn our attention to silver and the mining sector.
To start, let's examine the Canadian venture index, which is displaying a promising inverse head and shoulders pattern. I am confident that the logarithmic projection will be achieved without much difficulty.

ORHD - EGX30 - Critical point , high risk EGX:ORHD - EGX30 - Timeframe 2 Hours
Prices achieved the minimum target for Head and Shoulders pattern at 21.30,
Moreover now prices Formatted a Gartley bullish pattern as follow:
- Entry: 21.45 (current price: 21.30)
- Stop loss: 21.16 (potential loss: 1.35%)
- First target: 22.41 (potential profit: 4.45%)
- Second target: 23.00 (potential profit: 7.60 %)
This is not investment advice, only my analysis based on chart data.
Consult your account manager before investing.
Thanks and good luck.

ISMQ - wait for action sen 1: 12/10/2025
Entry from 5.85 to 5.76
5.76 is a target for Head & Shoulders (H&S) on the 1-hour chart.
5.85 is an 88% Fibonacci retracement level (FIP) for harmonic patterns on the 1-hour chart.
Stop Loss (SL): 5.65 Target 1 (T1): 6.18 Target 2 (T2): 6.38
sen 2:
Re-enter when closing above 6.44 (the right shoulder) to deactivate the H&S pattern.
Stop Loss (SL): 6.37 Target (T1): 6.70
Its not an advice for investing only my vision according to the data on chart
Please consult your account manager before investing
Thanks and good luck

BTCUSDT: Bear Market, Price Persist To Drop..Hello everyone,
Lets take a view at BTCUSDT...
BTC have been falling for couple of days now, since after the last week liquidation. the price successfully broke the expected higher low zone as we can clearly spot in the structure, there by extending its drop below $99,846 as the next partial support.
However a confirmed breakout below $99,846 would trigger the price to resume its dip with a target toward $76K as following potential support.
What are your opinion on this, my fellow traders ?
Follow up,
Thanks for reading.

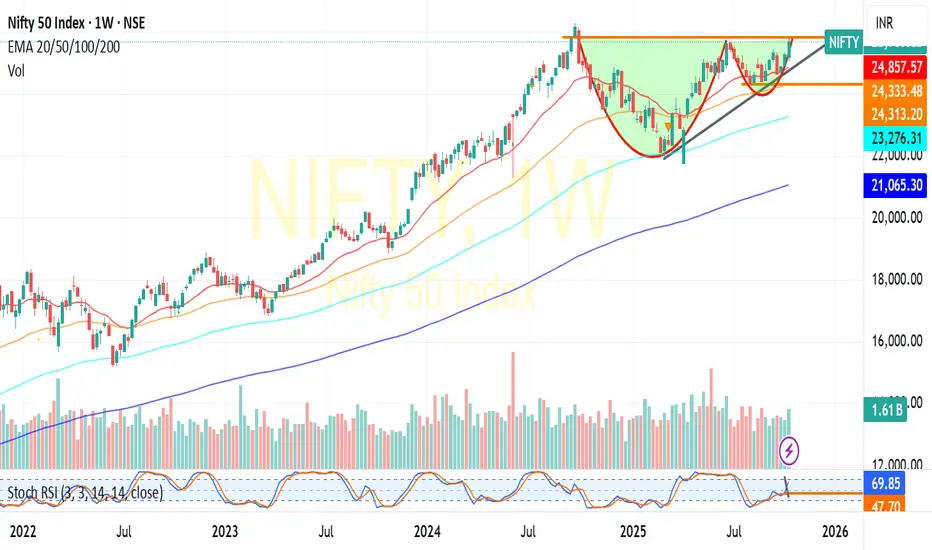
NIFTY:Cup&Handle Break Out-Bull RunNIFTY : Trading at 25700+ Levels.
Trading above all its critical moving averages even in weekly charts(20/50/100/200) showing the momentum
Has formed Cup&Handle formation in weekly chart indicating a possible upside of another 800-1000 Points .Daily chart also confirms the momentum by formation of Inverted Head &shhoulder pattern.
Seems any reasonable dip is likely to be bought .23400 shall be considered as the major support point for any trend reversal.(For educational purpose only)
Head & Shoulders XRP Potential early-stage Head and Shoulders pattern forming on XRP. Here’s the breakdown:
Structure
Left Shoulder: Formed around October 12–13, where price peaked near 2.55 before pulling back.
Head: Formed around October 14 with a higher peak near 2.62, followed by a sharp drop.
Right Shoulder: Currently developing around October 15, topping near 2.47 before showing signs of exhaustion.

Bumble - Potenial Inverse H&SLooking at Bumble now and have been accumulating shares these last days. If this stock manages to break the neckline It could easily make a quick run of 100-200%.

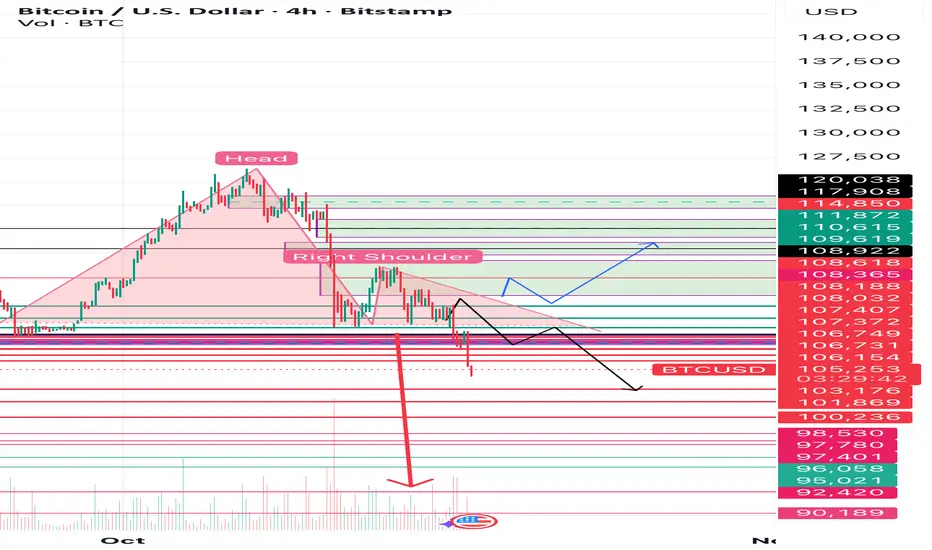
Btc bearish scenarioAs mentioned earlier BtC drop will go 107,700, 105,500,
Now waiting 103,000 expected reversal zone
102000
100,000
98,000
Then maybe can reach to 88,000 we shall update
NZD/CAD: True Bullish Reversal?! 📈NZDCAD formed an inverted head and shoulders pattern.
The subsequent neckline breakout serves as a strong bullish reversal signal.
The previously broken neckline now serves as a key support level.
Consequently, we anticipate bullish price movement, potentially reaching the 0.8085 resistance level.

diwali personal favourite pic 4: vip ind my thesis is In BHARAT, THE tourism HAS TO to pick pace and this a proxy play in the same segment
healthy time and price correction seemingly completes .
India’s organized luggage market reached an estimated ₹4,450 crore in retail value during CY 2024–25, expanding at a robust 9.6% CAGR
over the past five years and accounting for roughly 12 million units sold annually.
Modern retail outlets and branded stores command around 65% of sales, while e-commerce contributes 20% and traditional/unorganized channels .
the remaining 15%. Hard-shell suitcases lead the category with a 52% share, followed by soft-side trolleys at 28%, backpacks and duffels at 15%, and travel accessories at 5%.
At the forefront of the market, VIP Industries holds a 32% revenue share, underpinned by its extensive distribution network,
while Safari Industries occupies the second spot with an 18% share by focusing on the value segment. American Tourister, part of the Samsonite Group, captures 15% of the market, and Samsonite itself secures 10% by positioning in the premium segment.
Youth-oriented Skybags accounts for 7%, and a diverse set of domestic players—including Wildcraft and Carlton—make up the remaining 18%. In terms of pricing, 45% of units are sold in the economy segment (under ₹2,000), 40% in the mid-range (₹2,000–5,000), and 15% in the premium bracket (above ₹5,000). Looking ahead,
the market is projected to reach nearly ₹6,300 crore by CY 2028 at a faster 10.5% CAGR, driven largely by premium and “smart” luggage innovations such as ABS-PC blends and RFID-enabled locks, as well as the continued growth of e-commerce and omnichannel retail strategies.

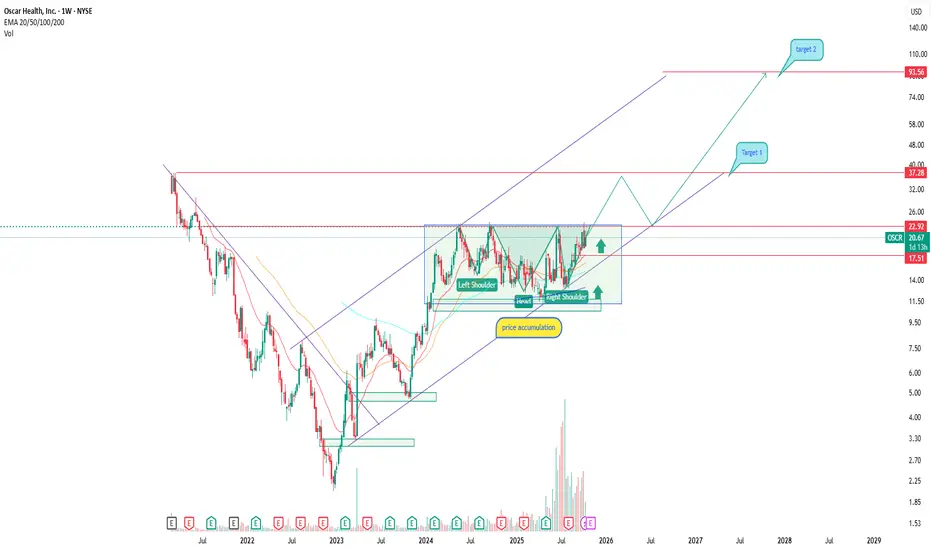
OSCR breakout from accumulation and start of a new trendOscar Health (NYSE: OSCR) is emerging as one of the more interesting names in the U.S. healthcare insurance sector. After an extended accumulation phase, the stock has broken out and is now trading above its major EMAs (50/100/200), confirming a structural shift toward a bullish trend.
The pattern resembles an inverse head and shoulders, with the 17.50–20.00 area acting as strong base support. A confirmed breakout above this zone sets the stage for a move toward 37.78 (Target 1) and potentially 93.55 (Target 2) — the upper boundary of the mid-term ascending channel.
Fundamentally, The company continues to grow its customer base and improve margins after strategic restructuring. Its shift toward tech-driven insurance solutions and partnerships with major healthcare providers strengthen its position. Recent earnings reports show narrowing losses and revenue stabilization — a sign of operational progress.
This looks like the early stage of a longer recovery cycle: the market is moving out of accumulation, but confirmation above 20.00–25.00 is crucial. As always — stay disciplined and trade by structure, not emotion.