QTUM at its core (up and down at the same time...?)QTUM has been trading inside this channel since the market drop in May 2021. It is now trading near one of its support zones. Over the next few weeks, QTUM will approach its long-term resistance (black line) which it has tested and failed to break over the past few months. This has resulted in the pair trading below the 100 and 200 day MA. It is overall bearish in the short-term until it can prove otherwise.
QTUM's long-term support is currently holding and this idea is that the price could rise and break out of its resistance pushing toward the top of the channel. However, if this support does not hold (most likely due to a breakdown in the price of BTC) it could test the second support at ~5.46 which may be an even stronger entry point with a good return.
Please note I am not a financial advisor and this is not financial advice. All ideas are for educational purposes only! :)
Hodl

Relief Rally in Bitcoin... Don't Get Excited Yet...We were calling a relief rally in Bitcoin and it appears as though we have finally seen it. It was paltry for a crypto rally, but it looks like this is all we have for now. Bitcoin spiked up to $48.2K, the exact level we identified yesterday. Subsequently, two red triangles on the KRI highlighted resistance at this level. We appear to be in the process of rejecting it back to support at $47.4K or $46.2K, where we will likely establish value into the New Year. If not, there is a vacuum zone above to $49.7K which is the final barrier to $50K.

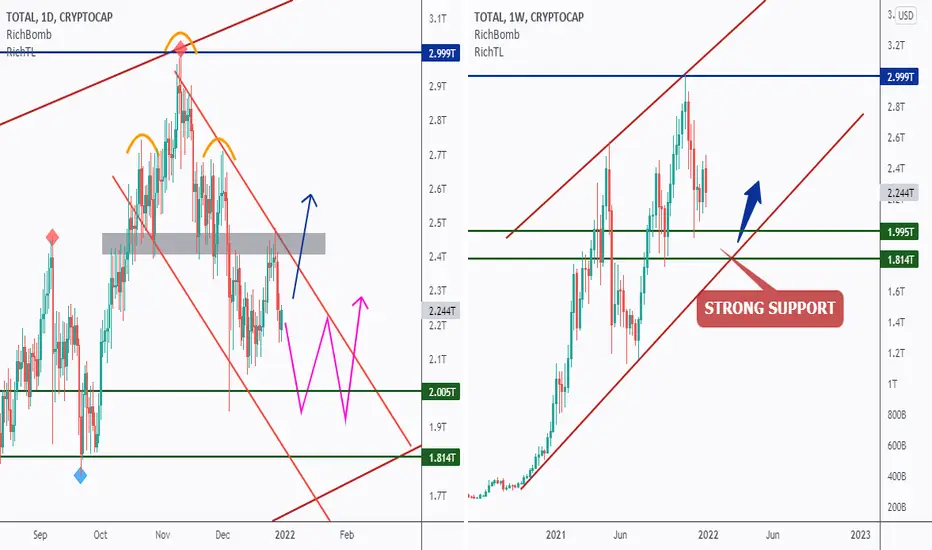
TOTAL - Keep An Eye on TOTAL!I usually keep an eye on TOTAL to get a feeling about the overall crypto market bias. Just like I keep an eye on DXY when it comes to Forex.
From a long-term perspective , the WEEKLY chart on the right, we all agree that we are still overall bullish.
Technically we are trading inside that big brown channel, and we are currently in a correction phase after rejecting the upper bound / brown trendline and 3T round number.
From a medium-term perspective, the DAILY chart on the left, we had a classic higher high, followed by a lower high, and then a break of the previous low. A classic market structure pattern, known as Head&Shoulders.
After breaking below the head and shoulders neckline, marked in gray, the bears took over and TOTAL started trading inside the red channel, making lower highs and lower lows.
That being said, we know that we are overall bearish, but what are the possible scenarios?
Scenario 1: Projection in Purple
A movement till the lower bound / brown trendline and green support zone is expected before the bulls take over by breaking above the red channel.
Scenario 2: Projection in Blue
A sudden shift in momentum, by an aggressive movement from here to break above the gray zone again, invalidating the red channel, signaling that the bulls are taking full control again.
Which scenario do you think is more likely to happen? and Why?
All Strategies Are Good; If Managed Properly!
~Rich
Buy Bitcoin now!Time to fly!
fasten your seatbelts :)
You can see 3 strong supports will push BTC to go up in these prices!
BINANCE:BTCUSDT

HT is awesomeI see HT in 2022 in the $ 50 range. Although this is just an idea, not a financial advice; But keep an eye on it!

NEO - My Trading Plan in 2 mins!Hello everyone, if you like the idea, do not forget to support with a like and follow.
Here is the top-down analysis for NEO, feel free to request any pair/instrument or ask any questions in the comment section below.
Best of luck!

What to Expect with the Bitcoin SelloffBitcoin has bottomed out for now exactly at our support level of $47.4K. We have been calling out this level for the past two days, so hopefully readers were prepared. What is concerning about this selloff is not necessarily the dump itself, but the lack of interest in buying it back. We did not see the pivot off $47.4K that would be expected if there were more buying interest. We are holding the very narrow range between $47.4K and $48.2K. The Kovach OBV has dropped precipitously, and flatlined. If we see another dump, then expect support at $46.2K, $45.6K, or $45.0K. If we catch a bid, there is a vacuum zone above to $49.7K, which is likely to be a ceiling for now.

ADA: SHOULD WE WORRY?Hey guys, this is Julie 😄
Let's talk about ADA today:
ADA is falling more than 6% today, should we worry about that?
Honestly, I don't see any reason to worry, ADA is just in the 21 EMA region and today seems to be a red day for some cryptos as well, so it seems like a normal movement, I don't think it will fall again.
As I said in my last analysis, it is very unlikely that ADA will trigger another downtrend because we have some interesting support levels holding it:
Fibonacci 61.8%
Green line support
- I must say that I would be worried if ADA fell below the green line, but even if that happened, we would have the pink line support level (but it is VERY unlikely that ADA will reach that price).
As I always say, I believe in ADA and I really think it will fly again; we just need some time for it to regain its strength.
I am more interested in ADA's weekly chart, so let's wait and see how this chart plays out by the weekend.
Thanks for reading!
Follow me and like this idea, please! 😊
Have a nice day, bye!

KSM - Long-term & Short-term RoadMap!Hello everyone, if you like the idea, do not forget to support with a like and follow.
Long-Term:
KSM is trading inside this giant symmetrical triangle in brown.
As per my trading style, I will be waiting for a third swing to form around the upper brown trendline to consider it valid then buy on its break upward. (projection in purple)
Short-Term:
As KSM approaches the lower bound/brown trendline, I will be looking for buy setups on lower timeframes. Any bullish reversal setup like a double bottom, trendline break, and so on...
Always follow your trading plan regarding entry, risk management, and trade management.
Good luck!
All Strategies Are Good; If Managed Properly!
~Rich

Bitcoin Dumps!! What's Next??We called it yesterday! Bitcoin appeared really top heavy in the low $50K's, and sure enough, we saw a big dump back to comfort in the high $40K's. Granted, this hardly qualifies as a 'big dump' for Bitcoin, but it's enough to dampen hopes for us to return to pump mode, for the moment. We mentioned that $52K seemed to be a barrier for BTC, with $52.8K the apparent ceiling. We did see BTC test $52K a few times, before rejecting these higher levels and smashing back down to $49.7K, where it continued to fall. It is currently finding support just above our level at $48.2K. We cited several more levels of support below this at $47.7K, then $46.2K, if the selloff is not finished. However, we appear to be finding good support at current levels, and are likely to hold here and perhaps range a bit before making the next move.

MKR - Potential Bullish Reversal!Hello everyone, if you like the idea, do not forget to support with a like and follow.
MKR is sitting around a strong support zone in green so we will be looking for buy setups.
on DAILY: MKR is forming a trendline in red but it is not valid yet, so we are waiting for a new swing high to form around it to consider it our trigger swing. (projection in purple)
Trigger => Waiting for that swing to form and then buy after a momentum candle close above it (gray zone)
Meanwhile, until the buy is activated, MKR would be overall bearish can still trade lower till the lower green support before going up.
Good luck!
All Strategies Are Good; If Managed Properly!
~Rich

DOT breakout HODL !!Polkadot breakout 31$ next target 34-36$ or mooooooooreeee this weeek 100000%%%%% DONT SELL
HODL !!!

Can Bitcoin Sustain $50K??Bitcoin finally saw a pump last week back to the low $50K's. The Kovach OBV registered bullish as the buying continued in a zig-zag pattern from lows at $45.4K. However, we do appear to be facing serious resistance at the psychologically significant $50K handle, in particular $50.8K. There is a wide vacuum zone to $52.8K, our next target and the next technical level above. We will see if Bitcoin has enough momentum this week to break through, but it is looking technically weak, and is having trouble solidifying the $50K's, hence we can expect a retracement back to comfort in the $40K's. In particular, look for support at $49.7K, $48.2K, and $47.4K.

Bitcoin Price Analysis 27 December 2021Bitcoin has a major support range near 40000$ to 44500$.
This looks like a good opportunity to buy in the above said range for a medium to long term investment.
Meanwhile Breaking These supports can cause a significant Correction.

ETC - Potential Bullish Reversal!Hello everyone, if you like the idea, do not forget to support with a like and follow.
ETC is sitting around a strong support zone in green so we will be looking for buy setups.
on DAILY: ETC is forming a channel in red but the upper trendline is not valid yet, so we are waiting for a new swing high to form around it to consider it our trigger swing. (projection in purple)
Trigger => Waiting for that swing to form and then buy after a momentum candle close above it (gray zone)
Meanwhile, until the buy is activated, ETC would be overall bearish can still trade lower till the lower green support before going up.
Good luck!
All Strategies Are Good; If Managed Properly!
~Rich

GBJJPY bearishWeekly supply zone
Two harmonic Patterns
Diversification
Chart pattern
Waiting:
Strong bearish candle to break below the chart pattern
Prices to look at
148
145
143

Breaking the Downward CurrentAs I said a few days ago, I noticed that the weekly RSI was starting to turn and predicted that Bitcoin would regain traction and test $50,000. We are seeing this now.My laser show of lines is starting to make sense. The next hurdle will be around $53,000 to regain a psychological win at the $1 trillion market cap. Momentum is continuing to pick up pace on The Daily indicators, and the only lags we should be seeing is that these milestone resistance levels. I imagine we will be visiting the ATH by New Year's. In the meantime, Alt coins are getting some much needed attention. Happy Christmas (etc) and Happy Trading!

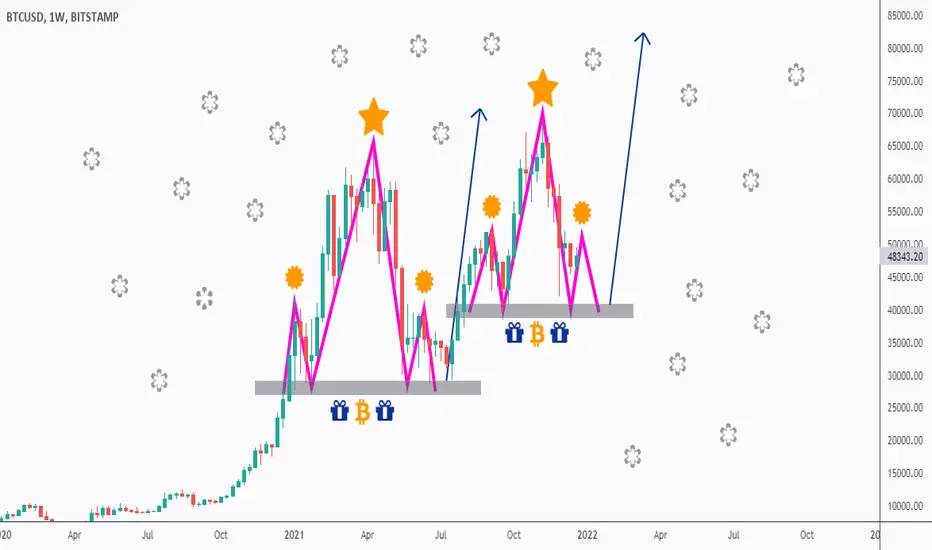
BITCOIN - Christmas Tree Pattern!Hello TradingView Family, this is Richard, and I want to wish you a Merry Christmas.
Hope 2022 will be the best of all!
I want to thank each and every one of you for being awesome.
I found BTC chart interesting.
According to the pattern, we are waiting for a break above the right shoulder for the bullish impulse movement to start; knowing that we can still see one more bearish leg before the break.
Will history repeat itself by 2022?
What do you think?
Good luck everyone and thank you once again.
Have a blessed season!
If you reached this far, allow me to share a Christmas poem I wrote a couple of years ago.
Hope you will like it.
~~~~~~~~~~~~~~~~~~~~~~
Christmas is coming
Let’s pause for a while
To think about everything
And go for the extra mile
Christmas is on the door
A homeless kid is freezing
Would you let him sleep on the floor?
Or give him the hug of healing
Christmas is getting colder
A lonely grandpa is sad
Wishing for a crying shoulder
To forget the pain he had
Christmas we just can't wait
A father needs medical care
Hurry up before it is too late
Show us that life is fair
Christmas is all about gifts
That can't be bought with money
Do good, so your soul lifts
Instead of feeding your tummy
Christmas here is my wish list
"Hope, Happiness, Love and Faith"
Make the world feel you exist
By drawing a smile on everyone's face
Christmas we need to talk
People are not getting you right
Christmas is an everyday walk
And not just for one night
~~~~~~~~~~~~~~~~~~~~~~
~Rich
YFI Starts New Bullrun!Yearn.finance (YFI) crossed above the 200-day simple moving average, which indicates the start of a new bullish trend. This is the first daily breakout and close above the 200 SMA since the September failed attempt.
High Trading Volume
Other technical factors add more confluence to the bullish case scenario, like the rise in the trading volume, which signals buying pressure. If we compare the volume readings from today with September’s readings, we can see a notable increase in the trading volume.
This is the main reason why todays’ breakout above the 200-day simple moving average has more potential to see follow-through.
RSI Positive Momentum
Additionally, we have supportive bullish momentum behind the recent rally, confirmed by the RSI momentum readings above the mid-level 50. We can expect more bullish momentum moving forward if the RSI oscillator stabilizes above the 50 level.
Looking forward: The first resistance level comes around $45,000. However, before that, the big round number of $40,000 can also pose a challenge for the bulls. On the downside, the 200-day simple moving average, which currently stands around $33,000, should act as support.

$BTC YOLO? HODL? 37k?-77k? BULLvsBEARBTC daily chart looks like it is having a breakout from a wedge pattern
first price target is at the .386 fib retracement
2nd PT around 55k at the 50% fib and also the 50 day moving average
if somehow bitcoin can get above the 50% retracement/50MA that would be extremely bullish and could send bitcoin to new ATH's
if we fail to trade above the Fib levels bitcoin is at risk of fading between 33k-37k
Neutral/Bullish above the 200MA bearish below
extremely bullish above 50% retracement/ 50 MA if Bitcoin cannot get above the 50 day moving average that would signal a possible top and trigger algos to take profit

BTC - Wait For The Bulls First! VideoHello everyone, if you like the idea, do not forget to support with a like and follow.
Here is the top-down analysis for BTC, feel free to request any pair/instrument or ask any questions in the comment section below.
Best of luck!

HUGE ENERGY IS COMPRESSED IN BITCOIN - BE AWARE AND ALERTEDfirst scenario:
if this trend line cross tonight it will go straight to
59,000 level in 1 or 2 days
and then next target is ~67,000 in next 7 days
second scenario:
trend line does not cross in next hours!
the price will goes down to near its true support level (~43,500 $ )
after approaching green trend line will cross and goes to (~59,000 $) in next 7 days.
THANK YOU.
PLEASE SHARE WITH YOUR FRIENDS

ETH - My Trading Plan in 3 mins!Hello everyone, if you like the idea, do not forget to support with a like and follow.
Here is the top-down analysis for ETH, feel free to request any pair/instrument or ask any questions in the comment section below.
Best of luck!
