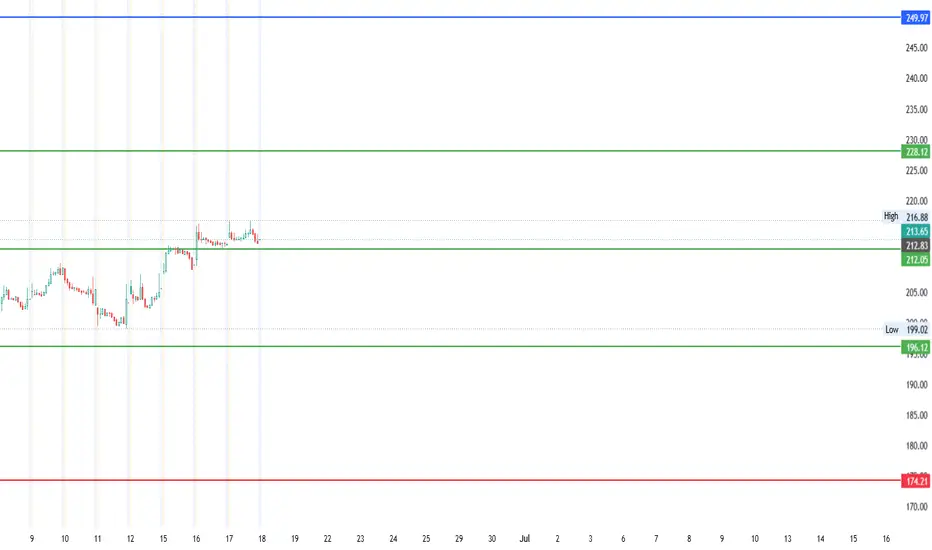
#HUDCO - 100 Points Move on cards?Date: 17-06-2026 #HUDCO - CP: 213.65 All the levels are marked on the chart.by Micro_trades123Updated 1
HUDCO: A Resilient Public Sector Financier Navigating HeadwindsHousing and Urban Development Corporation Ltd. (HUDCO) closed at ₹195.77 on February 13, 2026, down -3.05% for the day and -8.96% over the past month. Despite short-term weakness, the stock has gained 1.67% year-to-date, reflecting resilience amid broader market volatility. Trading volume stood at 11.42 million shares, indicating active participation. HUDCO is a fundamentally sound public sector financier with a robust loan book and improving capital efficiency, but faces near-term headwindsby emraldconsulUpdated 14
HUDCO at Strong Support – Bull Run Ahead!This is the daily chart of HUDCO. HUDCO is moving within a well-defined parallel channel and is currently sustaining near the channel support zone of 198–205. If this level holds, we may see higher prices in HUDCO. Thank you.Longby FiveCircles4
Double bottom in HUDCO Double bottom pattern in hudco. Big spike in volume and delivery qty (checked on NSE's website) on breakout of neck. Wait for Retest to support at around 230 Risk to reward ratio of more than 3. Longby Pranam184
Understanding ICT Bullish Mitigation BlockA Bullish ICT Mitigation Block is a concept from Inner Circle Trader (ICT) methodology. It forms at the end of a bearish trend when the price reaches a strong bullish institutional reference point, such as a bullish order block or breaker block. Formation: It occurs when the price fails to create a lower low in a bearish trend and instead reverses to shift the market structure to the bullish side. Identification: Look for a price level where the market attempted to break lower but was halEducationby UnknownUnicorn324890202
SWING IDEA - HUDCOHUDCO is showing potential for a swing trade based on technical signals. Reasons are listed below : 230 Zone as Strong Support : The 230 level has been a crucial support zone, providing a solid base for potential upward movement. Bullish Engulfing Candle on Daily Timeframe : A strong bullish engulfing candle indicates growing buying pressure. 0.618 Fibonacci Support : The price is bouncing off the 0.618 Fibonacci retracement level, suggesting a potential reversal. 200 EMA Support on DailLongby Visionary_Growth_InsightsUpdated 1139
HUDCOHi guys, In this chart i Found a Demand Zone in HUDCO CHART for Positional entry, Observed these Levels based on price action and Demand & Supply. *Don't Take any trades based on this Picture. ... because this chart is for educational purpose only not for Buy or Sell Recommendation.. Thank you Longby GirirajKoppal233
HUDCO (NSE) Bullish Trend with Potential BreakoutHUDCO is showing a strong bullish trend with consistent trendline support. The recent breakout above the resistance level indicates a potential upward movement. Fundamental View: Strong EPS and healthy profit margins HUDCO may be included under Section 54EC of the Income Tax Act, which offers capital gains tax exemptions on specific bonds, providing a tax-saving advantage for investors Trade Setup: Stop Loss (SL): 280 Take Profit (TP): 350 HUDCO's technical and fundamental strLongby GlobalMarketGuruUpdated 17
HUDCO Looking for a Breakout. Long Consolidation done. Above all EMA . Target 280, 350. Do Like ,Comment , Follow for regular Updates... Disclaimer : This is not a Buy or Sell recommendation. I am not SEBI Registered. Please consult your financial advisor before making any investments . This is for Educational purpose only.by VpktradesUpdated 25
HUDCO rally continues and more to come!This one continues to make new highs and is still not done yet. It is 100% up since shared it for the first time. The Elliott Wave count is self explanatory as to where it is heading in the coming months. In my opinion, the next good buying good opportunity would be the blue wave (iv) pullback. Shall update as price develops further. Thanks for reading!Longby barefootTrades28
MACD Crossover Swing Trade📊 Script: ADANIPOWER 📊 Sector: Power Generation & Distribution 📊 Industry: Power Generation And Supply ⏱️ C.M.P 📑💰- 628 🟢 Target 🎯🏆 - 668 ⚠️ Stoploss ☠️🚫 - 611 📊 Script: HUDCO 📊 Sector: Finance 📊 Industry: Finance - Housing ⏱️ C.M.P 📑💰- 233 🟢 Target 🎯🏆 - 246 ⚠️ Stoploss ☠️🚫 - 228 📊 Script: JSWINFRA 📊 Sector: Marine Port & Services 📊 Industry: Miscellaneous ⏱️ C.M.P 📑💰- 259 🟢 Target 🎯🏆 - 278 ⚠️ Stoploss ☠️🚫 - 250 📊 Script: METROBRAND 📊 Sector: Leather 📊 Industry: Leather / Longby radha_23Updated 15
Hudco is Looking very good for buyingHudco is Looking very good for buying, Strong buying candle closing l, Target 250++Longby anand_agarwal2
Uptrend in HUDCO continuesthis one continues to make new highs and more to come. updated the Elliott Wave count, since my last update, as price developed further. price currently seems to be in final stages of wave (iii) in blue. Will update again as price develops. Thanks for reading!Longby barefootTrades7
HUDCOSuper B/O Above.... 178 Tentative price movements and important supports are marked... Keep playing this chart for better Understanding.... of Price movement.... Redlines are strong resistance points.... Buy on dips if you get near green lines or near 178 for better risk/reward... by emraldconsulUpdated 111
Hudco LonGHudco Under Demand zone expecting blast from low levels Educated zone are marked for invesmentLongby PowerOrderUpdated 1
#HUDCO made a new ATH after more than 6 years Stock made a new ATH after more than 6 years and today Stock is up >19%. Such stocks tend to go much higher. Anyone looking for a long-term investment, then this can be a good stock to add to long-term portfolio. If market gives a chance, can add to stock also at ₹100-₹110 levels. Also, this stock has been consistently giving dividends as well.by BattleofStocksUpdated 4
Nice uptrend in HUDCO. Full Elliott Wave Count!A very clear 5 wave Elliott Wave structure in this one. Also the break of all time high adds more confidence to this count. Full EW count on the chart with a clear invalidation level. Thanks for reading!Longby barefootTrades4
#ADORWELD 1111 Buy Upside 17% Recommended - Rachit Sethia ADORWELD 1111 TGT 1300 SL 1019 Return 17% + RR > 2 TimeFrame < 6m Factors: BULLISH WEDGE BREAKOUT Trend Following Rising Volume with rising Prices. Flag pattern breakout. Pennant Pattern Breakout with Bullish Candle. Retest Successful. Higher Highs & Higher Lows. Broken above RESISTANCE levels Trading at SUPPORT levels Earnings are strong. Bullish Wedge Breakout Risk Return Ratio is healthy. And Rising from Double Bottom Pattern to Flag Pattern forming. If you like my work KINDLY LIKE SHARE & FALongby Rachit_SethiaUpdated 3
L&TFH L_TFH 133 ->160 21% recommended buy - Rachit SethiaL&TFH 133 TGT 160+ SL 120 RR > 2.5 Return > 21%+ Timeframe < 6 months Factors: BULLISH WEDGE BREAKOUT Trend Following Rising Volume with rising Prices. Flag pattern breakout. Pennant Pattern Breakout with Bullish Candle. Retest Successful. Higher Highs & Higher Lows. Broken above RESISTANCE levels Trading at SUPPORT levels Earnings are strong. Bullish Wedge Breakout Risk Return Ratio is healthy. And Rising from Double Bottom Pattern to Flag Pattern forming. If you like my work KINDLY LIKE SHALongby Rachit_Sethia7
#KNRCON 270 Tgt 320 Buy - Rachit SethiaKNRCON CMP 270 TGT 320 SL 252 Return ~ 20% TF 6months RR >2.8 NSE:KNRCON #KNRCON Factors: BULLISH WEDGE BREAKOUT Trend Following Rising Volume with rising Prices. Flag pattern breakout. Pennant Pattern Breakout with Bullish Candle. Retest Successful. Higher Highs & Higher Lows. Broken above RESISTANCE levels Trading at SUPPORT levels Earnings are strong. Bullish Wedge Breakout Risk Return Ratio is healthy. And Rising from Double Bottom Pattern to Flag Pattern forming. If you like my work KINDLY Longby Rachit_Sethia3
HUDCO 240 MINS CHART LONG SETUP ✅✅✅✅The Structure looks good to us, waiting for this instrument to correct and then give us these opportunities as shown on this instrument (Price Chart). Note: Its my view only and its for educational purpose only. Only who has got knowledge about this strategy, will understand what to be done on this setup. its purely based on my technical analysis only (strategies). we don't focus on the short term moves, we look for only for Bullish or Bearish Impulsive moves on the setups after a good price acLongby Tradelikemee32
Hudco_ DailyLooks Strong HUDCO is a unique institution with its motto of "Profitability with Social Justice". A Public Sector Company, under the Ministry of Housing and Urban ... Only for educational purpose.Longby Selecteystocks1
#GICHSGFIN #IBULHSGFIN #REPCOHOME #LICHSGFIN #HDFC #HUDCO #LOAN NSE: GICHSGFIN CMP: 143 Target 183 ~28% Stop Loss: 129 TF < 3M RR > 2.8 NSE:GICHSGFIN Factors: BULLISH WEDGE BREAKOUT Trend Following Rising Volume with rising Prices. Flag pattern breakout. Pennant Pattern Breakout with Bullish Candle. Retest Successful. Higher Highs & Higher Lows. Broken above RESISTANCE levels Trading at SUPPORT levels Earnings are strong. Bullish Wedge Breakout Risk Return Ratio is healthy. And Rising from Double Bottom Pattern to Flag Pattern forming. If you Longby Rachit_Sethia2
HUDCO Continuation of uptrend HUDCO developed strong buying in the previous week's, with every increase in Volume the stock would continue to be in an uptrend. The RSI beyond the 50 parameter supports the bill run, and the ascending triangle signifys that the RSI would indicate a next buy beyond its 60 parameter and 70 parameter. Therefore our target for HUDCO is at 58+ Longby TristarTrading0
 LongLongEducationLongLongLongLong
 LongLongLongLongLong
 Long
 LongLongLong
 LongLong