BTCUSD: Local Bullish Bias! Long!
My dear friends,
Today we will analyse BTCUSD together☺️
The recent price action suggests a shift in mid-term momentum. A break above the current local range around 123,111.85 will confirm the new direction upwards with the target being the next key level of 124,060.63 and a reconvened placement of a stop-loss beyond the range.
❤️Sending you lots of Love and Hugs❤️
Ict

Gold battles within 3,860–3,900 Hello Goldies, ✨
Gold locks another bullish weekly close, extending its climb into high-altitude territory with barely a pause since mid-summer. The market now stands in a tactical battlefield — with buyers defending momentum while sellers quietly prepare to fade the top.
Gold’s broader structure remains clean and bullish, printing higher highs and higher lows since early 2024. However, price now trades deep inside the weekly supply belt (3,860–3,900) — a zone where liquidity historically transitions from accumulation to distribution.
Momentum stays firm, but upper-wick reactions and short-bodied closes hint at early exhaustion. The EMA stack (5–21–50) keeps control with the bulls, though the structure is primed for either a healthy pause or a short-term retracement before the next impulsive leg.
Macro & News Context 🌍
This week brings a USD-heavy calendar:
multiple FOMC speeches (Powell, Bowman, Barr, Kashkari), Unemployment Claims, and the all-important Non-Farm Payrolls (NFP) on Friday.
Soft U.S. data continues to weigh on the dollar, while gold benefits from falling yields and elevated geopolitical risk. However, a hot NFP print or hawkish tone from Powell could briefly lift the dollar and trigger a technical correction in gold.
Expect event-driven volatility — fast rotations as markets recalibrate expectations around future Fed rate cuts.
🟡 Weekly Gold Outlook – Bulls at Altitude, Momentum Fading
Bias: Bullish, but stretched
Key Weekly Zones:
🟥 Supply: 3,860 – 3,900 → Major resistance pocket; potential distribution area
⚪ Mid-Control: 3,700 – 3,740 → Tactical pivot; must hold for continuation
🟦 Demand: 3,440 – 3,480 → Structural re-test zone from prior breakout
🔼 Above 3,900 → Expansion toward 3,940–4,020
🔽 Below 3,700 → Correction toward 3,480
🔵 Daily Structure — Bullish but Hyper-Extended
Gold trades inside premium territory (3,875–3,905), where rejection tails and volume absorption reveal fading strength.
The 3,820–3,850 base remains the near-term lifeline — a break below it could trigger a 300–500 pip washout into lower demand layers.
Daily Zones:
🟥 Supply: 3,875–3,905 → Premium ceiling
🟦 Demand: 3,820–3,850 → Micro base | 3,720–3,750 → Immediate re-test
🔼 Above 3,905 → Extension toward 3,940–3,970
🔽 Below 3,750 → Correction phase confirmed
🟢 H4 Flow — Compression Before Expansion
Structure remains bullish but congested under 3,900.
Equal highs and tight-bodied candles signal compression — a volatility coil that will define this week’s direction.
H4 Zones:
🟥 3,880–3,900 → Immediate supply
🟦 3,820–3,840 → Short-term demand
🟦 3,760–3,780 → Re-test zone
🔼 Break above 3,900 → Targets 3,920–3,940, then 3,960–3,980
🔽 Break below 3,820 → Opens rotation to 3,760–3,780
🔸 H1 Tactical View — Decision Box Active
The 3,860–3,895 range forms this week’s tactical decision zone — a battleground between fading momentum and bullish control.
Bulls still hold structure, but exhaustion is visible; another failed breakout could trigger a deeper correction.
H1 Key Pivots:
🔼 3,885–3,895: Short-term cap → breakout unlocks 3,910–3,930
🔽 3,860–3,875: Near-term floor → break below opens pullback to 3,820–3,840
⚙️ Above 3,905 → Expansion
⚙️ Below 3,820 → Correction
⚙️ Between 3,860–3,895 → Compression zone — patience required
Summary
Gold remains structurally bullish but stretched at altitude.
The 3,860–3,895 pocket is the tactical decision belt — the level that will define whether the market expands into new highs or breathes out for a well-deserved correction.
🎯 Above 3,905 → Continuation
🩸 Below 3,820 → Correction
⚖️ Between → Compression until catalyst resolution (FOMC / NFP).
Disclaimer: For educational context only.

UKOILUkoil, in the short term, will be under bearish pressure from 63$ to 61$
65.5$ Breaks then retest and confirm
Now going to 62$

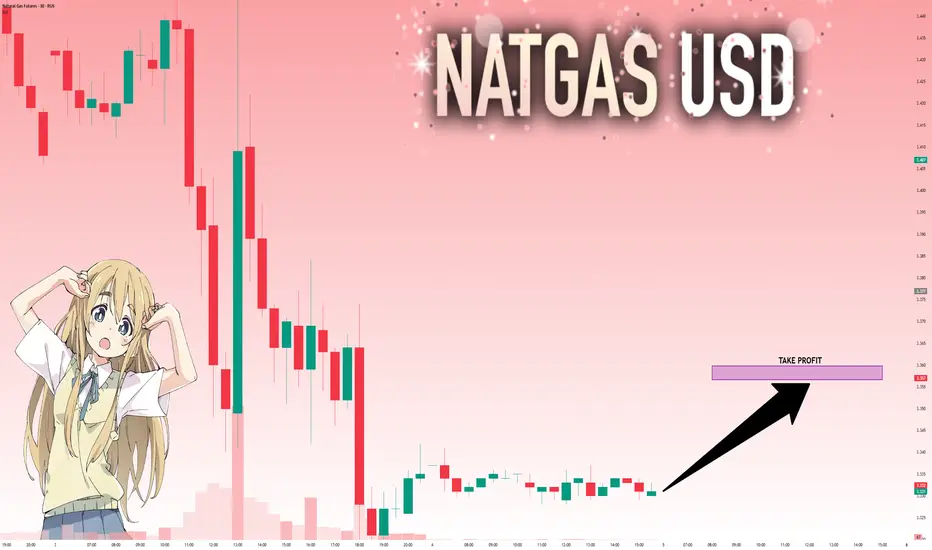
NG1!: Will Go Up! Long!
My dear friends,
Today we will analyse NG1! together☺️
The market is at an inflection zone and price has now reached an area around 3.332 where previous reversals or breakouts have occurred.And a price reaction that we are seeing on multiple timeframes here could signal the next move up so we can enter on confirmation, and target the next key level of 3.357.Stop-loss is recommended beyond the inflection zone.
❤️Sending you lots of Love and Hugs❤️
NI225: The Market Is Looking Down! Short!
My dear friends,
Today we will analyse NI225 together☺️
The price is near a wide key level
and the pair is approaching a significant decision level of 45,769.45 Therefore, a strong bearish reaction here could determine the next move down.We will watch for a confirmation candle, and then target the next key level of 45,521.01.Recommend Stop-loss is beyond the current level.
❤️Sending you lots of Love and Hugs❤️

Bearish Movement Coming UpPotential move to the downside, waiting for price to make it up to at least 50% of the operative range, aligning with an Bearish OB.

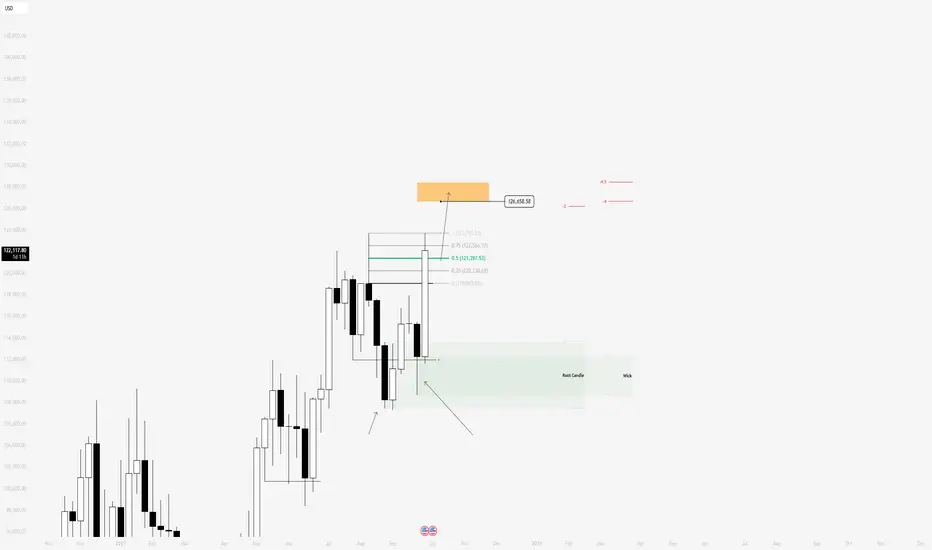
BTC Well on it's way to 126kTechnical analysis most times does not need many words.
Here we have a very bullish bitcoin BINANCE:BTCUSD
Using the wicks on the weekly chart, I can measure them and project values towards all time highs based on Market Maker Model Dynamics
The first projection, is the root candle of the current distribution
The second projection is the lower wick of the last re-accumulation before we had an expansion in the just concluded week.
Both projections, converge around 126k so I have my sights set on 126k
I anticipate the lower wick of the upcoming week to form around 121k (50% premium wick level)
See image below
BINANCE:BTCUSD
That's it.
USD/CHF Bulls Eye 0.8080 – But Is a Trap Coming First?🔹 COT (Commitment of Traders)
USD Index: Non-commercial longs increased (+1,541), shorts decreased (-1,009). → Speculators turning more bullish on the Dollar.
CHF Futures: Non-commercial longs rose (+1,992), shorts declined (-1,030). → Speculators also turning more bullish on the Swiss Franc.
📌 Combined Result: Strength on both USD and CHF, but the imbalance favors the Dollar.
🔹 FX Sentiment (retail positioning)
74% long USD/CHF vs 26% short.
📌 Retail is heavily long → contrarian signal → risk of a downside correction, even though the macro setup still favors USD.
🔹 Seasonality
October is historically bearish for USD/CHF (average -0.01 to -0.02 over the last 10–20 years).
November tends to be neutral, while December is again weak.
📌 Seasonal bias → contradicts Dollar strength, adding short-term downside risk.
🔹 Price Action
Price consolidating around 0.7980, after a recovery from the BPR (Balanced Price Range).
Structure suggests possible continuation higher toward the 0.8050–0.8080 supply zone.
RSI neutral, with room for further upside.
A break below 0.7940 would invalidate the bullish scenario and expose downside toward 0.7900.

EUR/GBP Rejected at 0.8760 - Is a Pullback to 0.8660 Next?🔹 COT (Commitment of Traders)
GBP Futures: Non-commercial longs increased (+3,704) while shorts decreased (-912) → speculators are turning more bullish on the Pound. Commercials slightly increased shorts (-1,853) but remain largely neutral.
Euro Futures: Non-commercial longs decreased (-789) while shorts increased (+2,625) → signaling bearish pressure on the Euro.
📌 Combined Result: Clear imbalance in favor of GBP, with stronger net positioning compared to the Euro.
🔹 FX Sentiment (retail positioning)
EUR/GBP: 87% short vs 13% long.
📌 Extremely skewed retail positioning → contrarian signal → short-term upside potential for EUR/GBP, but macro context still favors GBP strength.
🔹 Seasonality
September and October show a historically neutral to slightly bearish bias over 15–20 years.
November–December tend to favor the Euro with seasonal rebounds.
📌 In the short term, there is no strong seasonal support for an EUR/GBP rally.
🔹 Price Action
Strong rejection from the 0.8740–0.8760 supply zone, with consolidation below resistance.
Possible retracement toward demand area 0.8660–0.8680, aligning with the dynamic trendline.
RSI is neutral, no major divergences, but momentum is cooling.
Structure remains bullish only above 0.8760; otherwise, risk of reversal toward 0.8620–0.8600.

EUR/USD Rejected Hard at 1.19 COT (Commitment of Traders)
Euro FX: Non-commercials slightly reduced longs (-789) but increased shorts significantly (+2,625). Commercials added both longs (+4,978) and shorts (+3,375), signaling hedging but with a defensive bias. → Net positioning remains positive on the Euro, but short pressure is increasing.
USD Index: Non-commercial longs rose (+1,541), while shorts decreased (-1,009). → USD strengthened by large speculators.
📌 Interpretation: Imbalance in favor of the Dollar, with the market turning more cautious on the Euro.
FX Sentiment
55% short EUR/USD vs 45% long.
📌 Retail is slightly skewed short → often contrarian → could support limited upside, but not extreme.
Seasonality
September is historically weak for EUR/USD (-0.01/-0.012 over 5–10 years).
October is also negative, while November–December historically show rebounds.
📌 Short-term seasonal bias (September–October) remains bearish.
Price Action
Strong rejection from the 1.1850–1.1900 supply zone.
Currently testing the 1.1740 area.
Bearish structure with probable downside targets at demand zones:
1.1650 → first key level.
1.1550 → deeper bearish extension if USD strength persists.
Only a stable recovery above 1.1820 would invalidate the bearish scenario.
Trading Outlook
Main Bias: Bearish in the short term (Sep–Oct), supported by COT (USD strength), negative seasonality, and technical rejection.
Contrarian Risk: Slight retail shorts could trigger minor rebounds, but overall setup favors selling rallies.

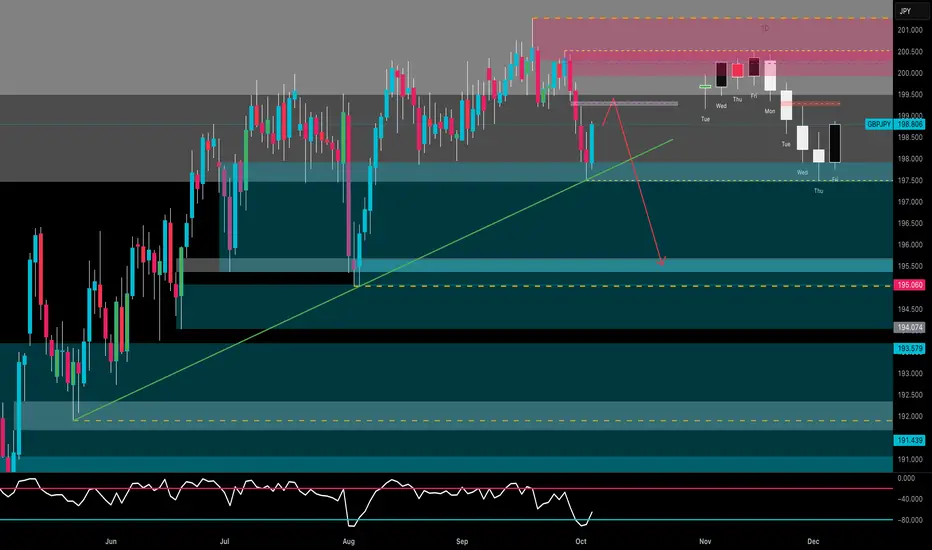
GBP/JPY Bears Back in Control – Is 195.50 the Next Target?🔹 COT (Commitment of Traders)
GBP Futures: Non-commercial longs increased (+3,704) while shorts decreased (-912) → speculators are turning more bullish on the Pound.
JPY Futures: Non-commercial longs sharply increased (+14,727) while shorts declined (-3,362) → strong bullish momentum returning to the Yen.
📌 Combined interpretation: Opposite momentum — both GBP and JPY show long accumulation, but the strength is significantly higher on the Yen, suggesting potential short-term weakness for GBP/JPY.
🔹 FX Sentiment (retail positioning)
59% short vs 41% long.
📌 Retail slightly skewed short → moderate contrarian signal, but not extreme. A short-term bounce is possible, though the broader macro picture remains fragile for GBP.
🔹 Seasonality
October is historically bullish for GBP/JPY on a 5–10 year average (+1.8% to +2.4%).
However, 15–20 year data show a more neutral to slightly negative bias, reflecting volatility rather than stable direction.
📌 Overall, a neutral-to-bullish seasonal bias, but vulnerable to a technical correction after the strong rallies seen in August–September.
🔹 Price Action
Strong rejection from the 200.50–201.00 supply zone with consecutive bearish daily closes.
Current dynamic support sits around 197.00–196.50, aligned with the ascending trendline.
RSI remains neutral and far from oversold → room for further downside.
Possible pullback toward 199.00–199.50 before a new bearish leg.
Main downside targets: 195.50, then 194.00 as an extended target.
🔹 Trading Outlook
Main Bias: Short-term bearish, with JPY strength (COT) and a corrective structure following the 201.00 top.
Contrarian Risk: Slight retail short bias could trigger a minor bounce before continuation lower.
Key Levels:
Resistance: 199.50 / 200.50
Support: 197.00 / 195.50 / 194.00
🎯 Outlook: Expect a pullback toward 199.00 before another bearish move toward 195.50. Daily structure remains bearish as long as 200.50 holds.
GBPUSD LOCAL LONG|
✅GBPUSD Smart money trapped liquidity below demand with a fakeout, before shifting orderflow bullish. ICT concepts show price now seeks external liquidity higher. Time Frame 4H.
LONG🚀
✅Like and subscribe to never miss a new idea!✅

USOIL WILL GO DOWN|SHORT|
✅WTI OIL Price rejects supply after distribution and forms bearish orderflow, ICT suggests liquidity is being targeted below. Market likely seeks drawdown into 60.00 demand imbalance. Time Frame 4H.
SHORT🔥
✅Like and subscribe to never miss a new idea!✅

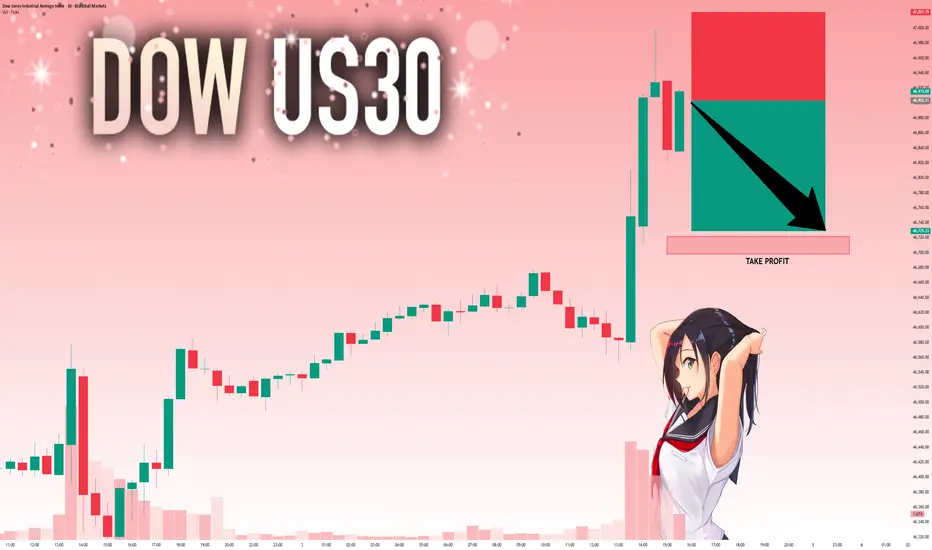
US30: Strong Bearish Sentiment! Short!
My dear friends,
Today we will analyse US30 together☺️
The recent price action suggests a shift in mid-term momentum. A break below the current local range around 46,903.31 will confirm the new direction downwards with the target being the next key level of 46,721.37 and a reconvened placement of a stop-loss beyond the range.
❤️Sending you lots of Love and Hugs❤️
SILVER: Bulls Are Winning! Long!
My dear friends,
Today we will analyse SILVER together☺️
The in-trend continuation seems likely as the current long-term trend appears to be strong, and price is holding above a key level of 48.307 So a bullish continuation seems plausible, targeting the next high. We should enter on confirmation, and place a stop-loss beyond the recent swing level.
❤️Sending you lots of Love and Hugs❤️

EURUSD: Next Move Is Down! Short!
My dear friends,
Today we will analyse EURUSD together☺️
The market is at an inflection zone and price has now reached an area around 1.17430 where previous reversals or breakouts have occurred.And a price reaction that we are seeing on multiple timeframes here could signal the next move down so we can enter on confirmation, and target the next key level of 1.17339.Stop-loss is recommended beyond the inflection zone.
❤️Sending you lots of Love and Hugs❤️

GOLD: Target Is Up! Long!
My dear friends,
Today we will analyse GOLD together☺️
The price is near a wide key level
and the pair is approaching a significant decision level of 3,885.51 Therefore, a strong bullish reaction here could determine the next move up.We will watch for a confirmation candle, and then target the next key level of 3,905.10.Recommend Stop-loss is beyond the current level.
❤️Sending you lots of Love and Hugs❤️

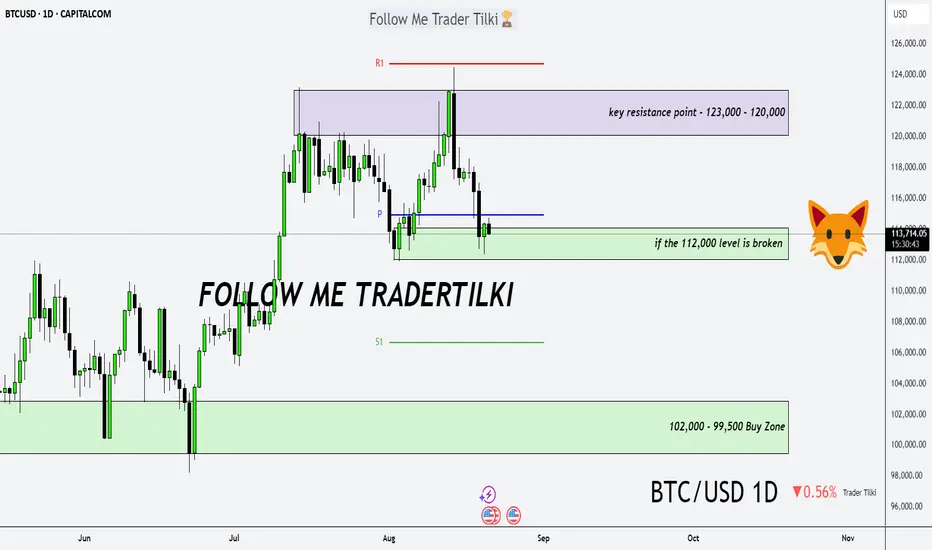
Bitcoin Daily Analysis – The Trend Is Our FriendGood morning, Guys,
I’ve prepared a fresh Bitcoin analysis for you.
🔹 First off, I stand firmly behind my long-term targets of **127,000 – 137,000 – 146,000**. I previously shared these levels with you in a weekly analysis.
🔍 Now let’s shift to the 1-day chart:
What is Bitcoin telling us right now?
📉 If the **112,000 level breaks downward**, we could enter a correction phase toward **102,000** or even **99,500**. I expect strong buying interest to return from those zones.
📈 After that, we’re facing a key resistance structure between **123,000 – 120,000**.
But I believe this zone will also be broken—because we’re in an **uptrend**, and…
💬 **The trend is our friend. Never forget that.**
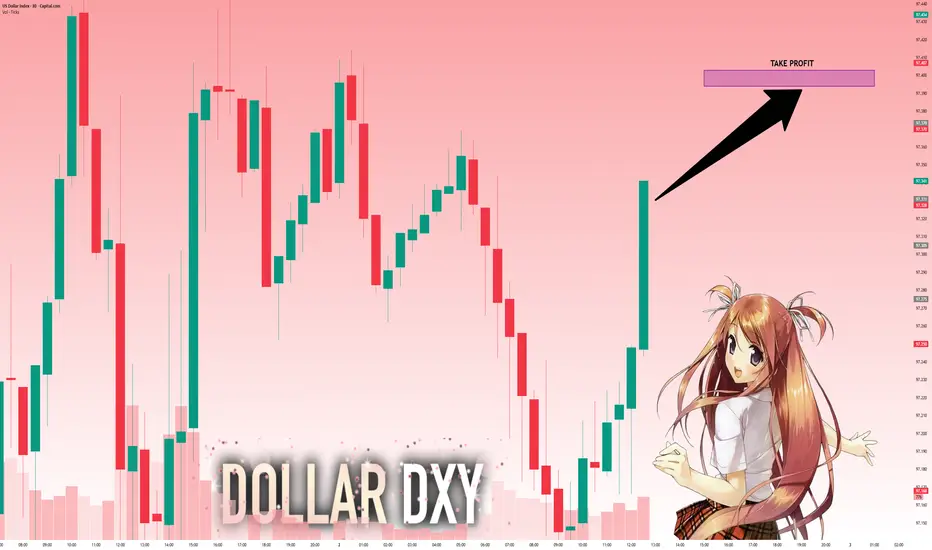
DXY: Move Up Expected! Long!
My dear friends,
Today we will analyse DXY together☺️
The recent price action suggests a shift in mid-term momentum. A break above the current local range around 97.331 will confirm the new direction upwards with the target being the next key level of 97.393 and a reconvened placement of a stop-loss beyond the range.
❤️Sending you lots of Love and Hugs❤️
SILVER: Local Bearish Bias! Short!
My dear friends,
Today we will analyse SILVER together☺️
The in-trend continuation seems likely as the current long-term trend appears to be strong, and price is holding below a key level of 47.830 So a bearish continuation seems plausible, targeting the next low. We should enter on confirmation, and place a stop-loss beyond the recent swing level.
❤️Sending you lots of Love and Hugs❤️

EURUSD: Strong Growth Ahead! Long!
My dear friends,
Today we will analyse EURUSD together☺️
The market is at an inflection zone and price has now reached an area around 1.17455 where previous reversals or breakouts have occurred.And a price reaction that we are seeing on multiple timeframes here could signal the next move up so we can enter on confirmation, and target the next key level of 1.17557.Stop-loss is recommended beyond the inflection zone.
❤️Sending you lots of Love and Hugs❤️

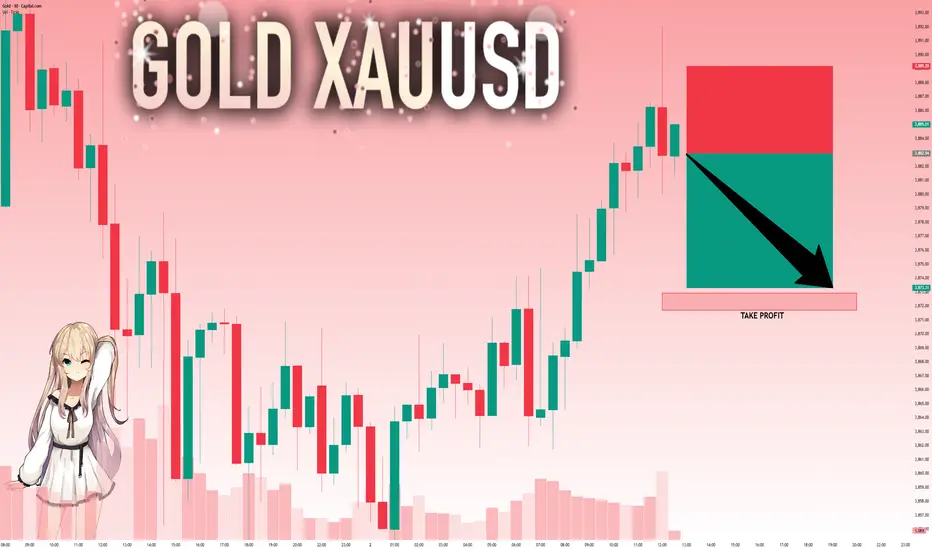
GOLD: Will Go Down! Short!
My dear friends,
Today we will analyse GOLD together☺️
The price is near a wide key level
and the pair is approaching a significant decision level of 3,882.94 Therefore, a strong bearish reaction here could determine the next move down.We will watch for a confirmation candle, and then target the next key level of 3,972.92.Recommend Stop-loss is beyond the current level.
❤️Sending you lots of Love and Hugs❤️
EURUSD buy opportunity There is a current buying opportunity on the EURUSD to break the previous high and collect more liquidity and fill the large liquidity void resulting from the sharp drop that occurred on September 24th
