EUR_NZD LOCAL LONG|
✅EUR_NZD is trading in an
Uptrend and the pair is
Retesting a horizontal support
Level of 1.9728 from where
We will be expecting a
Local bullish rebound
And a further move up
LONG🚀
✅Like and subscribe to never miss a new idea!✅
Ict

USDJPY STRONG SIGNAL FOR BUYINGThe price face buying pressure
and it want to form head and shoulder
and it now on second shoulder
and reflect from order block and support so i think in buying

Gold 1H | ICT SMC Analysis (OB + FVG Roadmap)This analysis is based on ICT / Smart Money Concepts.
•Key Order Blocks ( OB ) and Fair Value Gaps ( FVG ) highlighted.
•Current price is testing a bullish OB on the 1H timeframe after a CHoCH .
• Possible scenarios:
1. Bullish case → if demand (green OB) holds, price may target 3,390 – 3,410 (upper OB).
2. Bearish case → failure to hold may drive price towards 3,280 – 3,300 demand zone.
Methodology : ICT / SMC
⚠️ This is for educational purposes only, not financial advice.

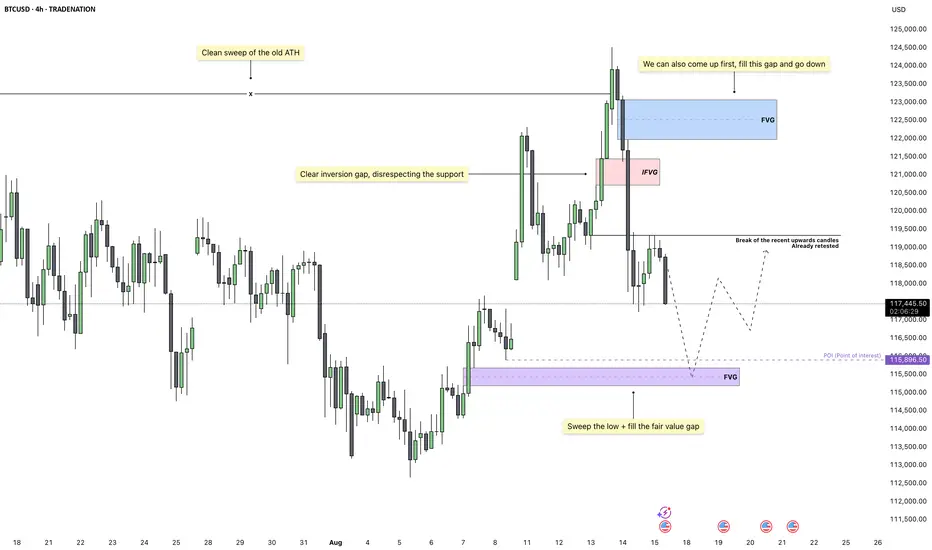
Bitcoin – Momentum Turns Bearish After Topside SweepBitcoin has just completed a clean sweep of the old all-time high, which served as a major liquidity grab. This move has cleared out buy-side liquidity at the very top, creating the perfect environment for a shift in momentum. Price action shows a clear rejection after the sweep, suggesting that the market may now be poised to reach for sell-side liquidity.
Inversion Structure and CISD
On the 4H timeframe, we have a well-defined inversion fair value gap forming immediately after the high was taken. This aligns with the CISD concept, as the liquidity sweep at the top acted as inducement before a sharp displacement to the downside. The CISD level has already been retested, confirming the shift in structure and reducing the likelihood of another deep revisit before the next leg down.
Bearish Pathway
From here, price could either continue to slide directly or first pull back into a nearby imbalance before continuing lower. Both scenarios favor the downside, as the order flow remains bearish after the displacement. A further push down is likely to aim for sell-side liquidity resting below the recent swing low.
Key Downside Objective
The primary target sits at the confluence of a marked liquidity pool and a lower fair value gap. This is a high-probability area for price to react, as it combines the sweep of the recent low with a fill of unmitigated inefficiency. Once that zone is reached, we can reassess for potential reversals or continuation patterns.
Expectation
The market has already shown its intent by taking the highest liquidity first, shifting structure, and respecting the CISD framework. Unless the upside imbalance is filled in a deeper retrace, the path of least resistance remains lower toward the highlighted fair value gap.
Conclusion
With liquidity above already cleared and the CISD retested, the focus now shifts to the liquidity resting below. The alignment between structure, inefficiency, and liquidity targets supports a bearish continuation into the marked zone before any meaningful bounce.
Disclosure: I am part of Trade Nation's Influencer program and receive a monthly fee for using their TradingView charts in my analysis.
___________________________________
Thanks for your support!
If you found this idea helpful or learned something new, drop a like 👍 and leave a comment, I’d love to hear your thoughts! 🚀
GBP/USD at Weekly Supply – Is the Pound About to Collapse?Technical Outlook:
GBP/USD is currently trading around 1.3535, testing a significant weekly supply zone between 1.3500–1.3600. The recent bullish impulse has brought price back into a strong confluence area marked by prior distribution in late July. The RSI is approaching overbought levels on the daily chart, suggesting a potential short-term exhaustion of buying momentum. My base scenario anticipates a rejection from the current zone, with the possibility of a retracement toward 1.3250–1.3150, aligning with the next demand area and historical price reaction. The projected short-term pattern shows a potential lower high forming before a deeper move down toward the yearly lows.
COT Positioning:
USD Index (as of 05 Aug 2025): Non-commercials decreased longs by -2,561 and slightly increased shorts (+313), showing a minor bearish tilt for USD in the short term.
GBP Futures: Large specs significantly reduced longs (-22,164) while also trimming shorts (-889), with commercials adding substantial long exposure (+20,125). This shift indicates reduced speculative confidence in GBP upside, while commercial buying suggests hedging or value positioning. Overall, COT data tilts toward a potential GBP correction rather than sustained breakout.
Seasonality:
GBP/USD historically underperforms in the second half of August across 5, 10, and 15-year averages. The 20-year tendency shows a mild decline starting mid-month into early September, aligning with the current resistance test and potential for downside momentum.
Sentiment:
Retail sentiment shows 66% short vs. 34% long. The majority of retail traders are positioned against the recent bullish push, which could fuel a brief squeeze higher before reversal. However, the confluence of COT, technical resistance, and seasonality keeps the medium-term bias bearish.
Conclusion & Bias:
Primary scenario: Short bias from 1.3530–1.3600 supply zone targeting 1.3250, then 1.3150 if momentum confirms.
Invalidation: Daily close above 1.3650 would weaken the short setup and open the path toward 1.3700–1.3750.

Gold Futures – Waiting for the Flush Before the Long (Asian KillMarket Context:
Gold is sitting right inside a confluence zone — overlapping Daily + H4 Fair Value Gaps at 3,375–3,380. This zone also aligns with the lower boundary of last week’s range (W-L at 3,397).
What I’m Watching:
Going into the Asian Killzone, I’m looking for an impulsive spike down into this FVG.
This move would ideally push below 3,375, tag liquidity, and create DOM excess — the kind of aggressive selling that often marks exhaustion before reversal.
ADX is above 25 and rising, signaling momentum is strong — but we’re at a potential pivot level.
Bullish Setup Criteria:
Flush down into 3,375 or slightly below.
DOM excess showing absorption (stuck sellers).
Strong rejection candle (M1/M5) followed by bullish follow-through.
Targets if Triggered:
T1: 3,397 (Weekly Low)
T2: 3,423 (Daily High)
Stretch: 3,451 (Monthly High)
Invalidation:
1H close below 3,375 without immediate reclaim.
Summary:
Patience is key. I want to see sellers press in during Asia, fail to break down with continuation, and then get run over on a squeeze higher. If we get the right reaction, this could be the start of a strong move into Weekend.

EURUSD – Climbing for Liquidity, Then What?EURUSD continues to move within a well-defined ascending channel, respecting both the upper and lower trendlines. After the recent rejection from the lower boundary, price found support inside a fair value gap, triggering a strong bullish reaction. This bounce has maintained the overall bullish structure, keeping the uptrend intact for now.
Fair Value Gap Retest
The fair value gap retest provided a clean entry for buyers, confirming demand at that level. This reaction reinforced the idea that liquidity was likely collected from the lows, giving the market fuel to push higher toward key resistance levels.
Short-Term Bullish Path
From here, price is approaching a major liquidity area above recent highs. This level may act as a magnet, drawing price upward for a sweep of buy-side liquidity. A continuation beyond that could result in a direct test of the upper trendline.
Potential Bearish Reversal Setup
If the upper boundary of the channel is reached, the reaction there will be critical. A sharp rejection from that area could trigger a deeper retracement, potentially driving price back toward the mid-range or even retesting the lower trendline. A liquidity sweep followed by bearish displacement would confirm this shift.
Key Scenarios Ahead
There are two primary outcomes to watch. First, price could sweep the current high and reverse lower, respecting the channel structure. Second, price could break through, reach the upper trendline, and then roll over for a larger corrective move. In both cases, the reaction after liquidity is taken will define the next directional leg.
Conclusion
At this stage, EURUSD is in a controlled uptrend, but the next high-probability move depends on how price behaves around the key liquidity level above. The plan is to monitor for either a sweep and rejection or a push to the upper trendline for a potential reversal.
Disclosure: I am part of Trade Nation's Influencer program and receive a monthly fee for using their TradingView charts in my analysis.
___________________________________
Thanks for your support!
If you found this idea helpful or learned something new, drop a like 👍 and leave a comment, I’d love to hear your thoughts! 🚀


CLEAN CHARTS ONLYWhere do you think NASDAQ is going next??? Amist a time where price is continually going up when do you think price will return to a discounted price. PPI news is tomorrow will we soar to the stars or will we dump?

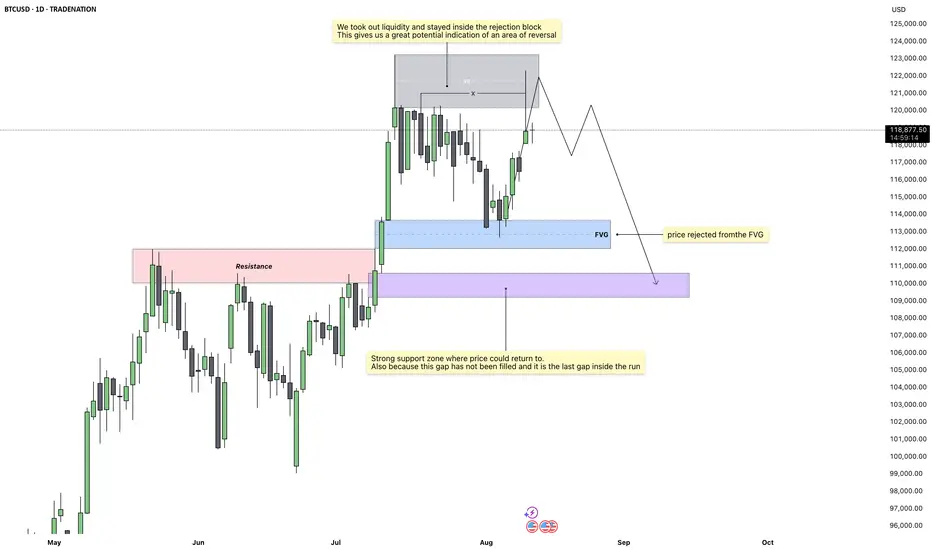
Bitcoin – The Last Stop Before the DropMarket Overview
Price action on the daily chart has shown a decisive move into a key rejection block after taking out recent liquidity. This is a classic sign of exhaustion in the current move, suggesting that momentum may now begin to shift in the opposite direction. The daily close reinforced this idea, showing a clear respect for higher-timeframe resistance levels.
Rejection Block Context
The 4H and daily rejection blocks have aligned, creating a strong confluence zone where sellers have stepped in before. Price did not just test this area, it closed within it, which often indicates a high probability of reversal. This setup builds confidence that the market could be preparing for a retracement.
Liquidity Sweep Confirmation
Before the rejection occurred, price ran through a cluster of resting liquidity above recent highs. This liquidity grab often acts as the fuel for a reversal, as it traps late buyers and allows larger players to shift price in the opposite direction.
Fair Value Gap Target
Below current price, there remains an unfilled gap which is the final gap inside the current run. Historical price behavior shows that such gaps tend to get filled before a fresh move can develop. This unfilled zone provides a clear downside target.
Bearish Scenario
If the rejection holds, I expect price to work its way lower toward the 110k range, filling that remaining gap before any sustained bullish move can resume.
Conclusion
With liquidity taken, a clean rejection from higher-timeframe resistance, and an untouched gap below, the chart is aligning for a potential retracement. I am watching for continued weakness to confirm the move toward the 110k region.
Disclosure: I am part of Trade Nation's Influencer program and receive a monthly fee for using their TradingView charts in my analysis.
___________________________________
Thanks for your support!
If you found this idea helpful or learned something new, drop a like 👍 and leave a comment, I’d love to hear your thoughts! 🚀
AUDUSD Breakout Setup: Ready for Lift-Off!Hey Guys,
I’ve analyzed the AUDUSD pair for you. If the 0.65245 level breaks to the upside, my target will be 0.65416.
If it doesn’t break, I’ll be looking to buy around 0.65047 or 0.64954.
Either way, my final target remains 0.65416.
In this analysis, I’ve highlighted two key levels and shared my target. I’m planning to buy from these zones.
Every single like from you is my biggest source of motivation to keep sharing these analyses. Huge thanks to everyone who supports by liking!

EURUSD - Bullish fair value gap and fibonacci support!At the end of July, EUR/USD experienced a sharp and decisive move to the downside, signaling a strong bearish momentum in the market. Following this decline, the pair began to recover, steadily climbing and partially filling the 4-hour Fair Value Gap (FVG). After tapping into the 4-hour FVG, price action has entered a corrective phase, moving lower towards a confluence of bullish levels. This area is defined by both the 1-hour and 4-hour FVGs, which align perfectly with the golden pocket of the Fibonacci retracement tool, a high-probability zone often watched by traders for potential reversals.
Bullish Support
The key bullish support zone sits around the 1.158 to 1.160 range. This area holds significant importance because it combines two strong technical factors: the 1-hour and 4-hour FVGs, as well as the golden pocket Fibonacci retracement. The overlap of these technical elements often acts as a magnet for price and can create a strong foundation for a bullish reaction. If the market respects this zone, we could see EUR/USD push higher in the short term, as traders capitalize on the support to drive price towards higher resistance areas.
Bearish Resistance
On the upside, the main bearish resistance zone lies between 1.170 and 1.174. This area represents the final portion of the unfilled bearish 4-hour FVG and could act as a significant barrier for further bullish progress. If price returns to this level, the strong supply pressure could result in a sweep of recent highs, fully filling the 4-hour FVG before potentially resuming the downward trend. This scenario aligns with the idea that sellers may re-enter the market aggressively once this resistance zone is tested.
Final Thoughts
Given the current market structure, my expectation is that the bullish support zone around 1.158 to 1.160 will hold, providing a potential launchpad for price to revisit and possibly complete the filling of the bearish 4-hour FVG near 1.174. However, if the market breaks decisively below the 1-hour FVG, it could indicate a shift in sentiment, opening the door for a bearish continuation and deeper downside targets. The coming sessions will be critical in determining whether EUR/USD can maintain bullish momentum or if sellers will regain control.
-------------------------
Disclosure: I am part of Trade Nation's Influencer program and receive a monthly fee for using their TradingView charts in my analysis.
Thanks for your support. If you enjoyed this analysis, make sure to follow me so you don't miss the next one. And if you found it helpful, feel free to drop a like 👍 and leave a comment 💬, I’d love to hear your thoughts!

GBP_CAD RESISTANCE AHEAD|SHORT|
✅GBP_CAD has been growing recently
And the pair seems locally overbought
So as the pair is approaching a horizontal resistance of 1.8640
Price decline is to be expected
SHORT🔥
✅Like and subscribe to never miss a new idea!✅

EUR-CAD Resistance Ahead! Sell!
Hello,Traders!
EUR-CAD keeps going up
But the pair will retest a
Horizontal resistance
Of 1.6124 and from there
A local bearish correction
Is to be expected
Sell!
Comment and subscribe to help us grow!
Check out other forecasts below too!
Disclosure: I am part of Trade Nation's Influencer program and receive a monthly fee for using their TradingView charts in my analysis.

AUD_USD LOCAL SHORT|
✅AUD_USD has retested a key resistance level 0.6540
And as the pair is already making a bearish pullback
A move down to retest the demand level below at 0.6520 is likely
SHORT🔥
✅Like and subscribe to never miss a new idea!✅

AUDJPY Strategy That Outsmarts the Noise: Entry & Target Ready!Hey friends 👋
I’ve prepared an analysis for the AUDJPY pair. If the price reaches the 96.201 - 96.169 zone, I’ll be looking to open a buy position from that level.
My target will be set at 96.524.
Every single like you send is a huge source of motivation for me to keep sharing these analyses. Big thanks to everyone who supports with a like 🙏

EUR-USD Potential Long! Buy!
Hello,Traders!
EUR-USD made a retest
Of the horizontal support
Of 1.1590 from where we
Are already seeing a bullish
Rebound thus we will be
Expecting a further
Bullish move up
Buy!
Comment and subscribe to help us grow!
Check out other forecasts below too!
Disclosure: I am part of Trade Nation's Influencer program and receive a monthly fee for using their TradingView charts in my analysis.

Different Strats, Same ChartICT, SMC, breakout traders, trendline traders… everyone swears they’ve got a unique edge, but it’s all pointing to the same POI. Same price, same reaction. Doesn’t matter what you call it — the market delivers the same setup for everyone, only difference is how you see it.

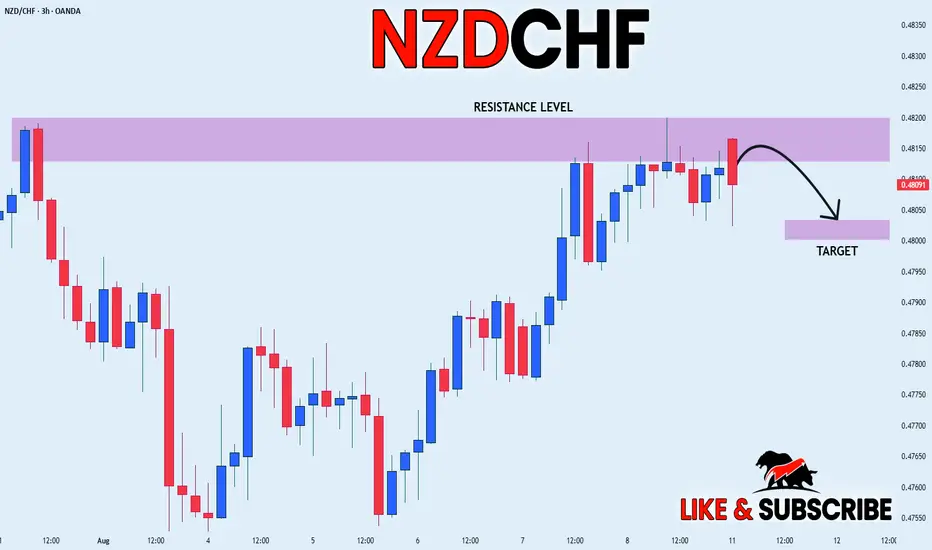
NZD_CHF WILL FALL|SHORT|
✅NZD_CHF price went up sharply
But a strong resistance level was hit at 0.4820
Thus, as a pullback is already happening
And a move down towards the target of 0.4803 shall follow
SHORT🔥
✅Like and subscribe to never miss a new idea!✅
SILVER Will Go UP! Buy!
Hello,Traders!
SILVER keeps trading in an
Uptrend and the pair already
Made a rebound from the
Horizontal support of 38.10$
So we are bullish biased and
We will be expecting a
Further bullish continuation
Buy!
Comment and subscribe to help us grow!
Check out other forecasts below too!
Disclosure: I am part of Trade Nation's Influencer program and receive a monthly fee for using their TradingView charts in my analysis.

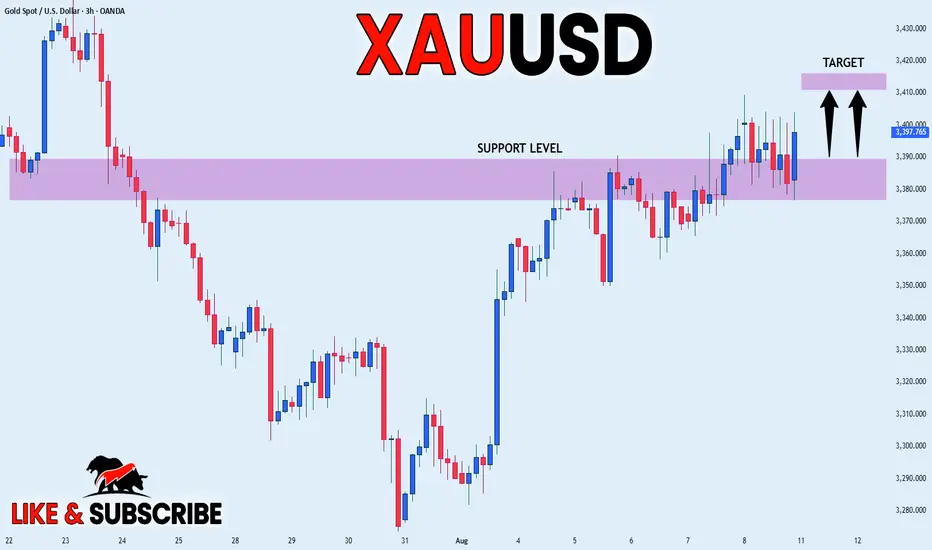
GOLD STRONG BULLISH BIAS|LONG|
✅GOLD is consolidating above
The horizonal support level
Of 3390$ while trading in a
Strong uptrend so we are
Bullish biased and we will be
Expecting growth on Monday!
LONG🚀
✅Like and subscribe to never miss a new idea!✅
NZD-CHF Short From Resistance! Sell!
Hello,Traders!
NZD-CHF is trading in a
Strong uptrend and the pair
Made a retest of the horizontal
Resistance level of 0.4820
From where we are already
Seeing a pullback so a further
Correction is to be expected
Sell!
Comment and subscribe to help us grow!
Check out other forecasts below too!
Disclosure: I am part of Trade Nation's Influencer program and receive a monthly fee for using their TradingView charts in my analysis.

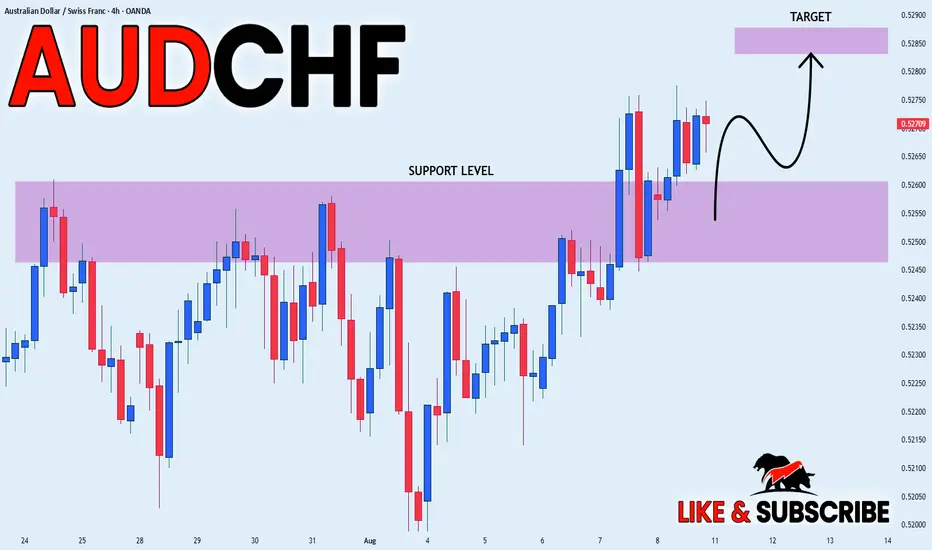
AUD_CHF WILL KEEP GROWING|LONG|
✅AUD_CHF is trading in an uptrend
And the pair was making a bearish correction
But has now retested the support of 0.5255
And we are already seeing a rebound
So we will be expecting a further move up
LONG🚀
✅Like and subscribe to never miss a new idea!✅