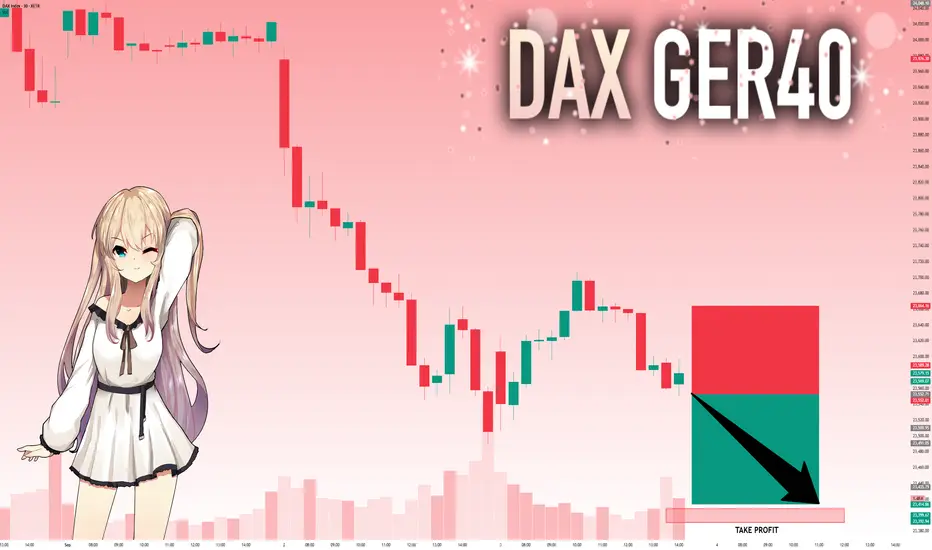
DAX: Move Down Expected! Short!
My dear friends,
Today we will analyse DAX together☺️
The in-trend continuation seems likely as the current long-term trend appears to be strong, and price is holding below a key level of 23,552.71 So a bearish continuation seems plausible, targeting the next low. We should enter on confirmation, and place a stop-loss beyond the recent swing level.
❤️Sending you lots of Love and Hugs❤️
Ict
GOLD: Local Bearish Bias! Short!
My dear friends,
Today we will analyse GOLD together☺️
The market is at an inflection zone and price has now reached an area around 3,554.68 where previous reversals or breakouts have occurred.And a price reaction that we are seeing on multiple timeframes here could signal the next move down so we can enter on confirmation, and target the next key level of 3,569.31.Stop-loss is recommended beyond the inflection zone.
❤️Sending you lots of Love and Hugs❤️

SILVER: Strong Growth Ahead! Long!
My dear friends,
Today we will analyse GOLD together☺️
The price is near a wide key level
and the pair is approaching a significant decision level of 41.075 Therefore, a strong bullish reaction here could determine the next move up.We will watch for a confirmation candle, and then target the next key level of 41.322.Recommend Stop-loss is beyond the current level.
❤️Sending you lots of Love and Hugs❤️

EURUSD: Will Go Up! Long!
My dear friends,
Today we will analyse EURUSD together☺️
The recent price action suggests a shift in mid-term momentum. A break above the current local range around 1.16431 will confirm the new direction upwards with the target being the next key level of 1.16702 and a reconvened placement of a stop-loss beyond the range.
❤️Sending you lots of Love and Hugs❤️


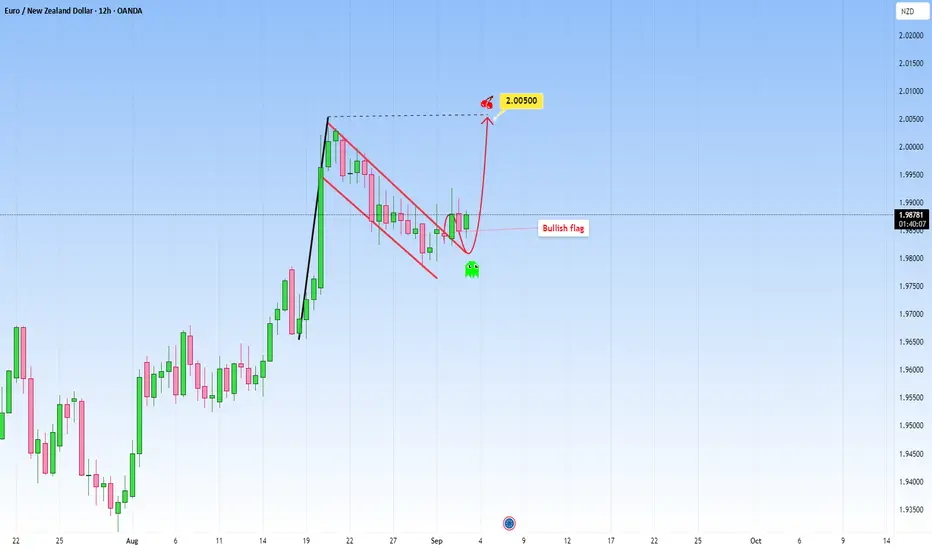
EURNZD: Rose steadily and created a Bullish FlagEURNZD looks quite interesting at the moment. Price rose to the upside steadily and now seems to have created a well known pattern: a bullish flag.
My expectation is for the price to continue, but first I would wait for a full strong candle to confirm the signal. I would target 2.00500.
If, on the other hand, price will decline below the flag, that would invalidate the continuation, and we can expect a short-term pullback incoming.
What do you think?
Quarterly Shit Analysis - Sept - Dec 2025 - XAUUSDMy last three quarterly analysis proved correct. In the last analysis, I predicted that gold will move within a range, it did happen.
For the new quarter, here is my new analysis. Between 14 Aug 2025 to 01 Sept 2025, I expect the following:
1- Scenario 1: Bullish Trend
Since May 2025, #XAUUSD has created good bullish indications on the Daily and Weekly Charts. Therefore, it could start a new trend.
Conditions: Gold must close a strong bullish daily candle above 3452 first , then another strong daily bullish candle above 3500. The closure of a strong daily candle above 3452 should happen between 14 Aug to 01 Sept. The closure of the daily candle above 3500 is fine to happen after September 1st.
Targets: If the conditions above are met, Gold will start a new bullish trend. The targets will be: 3668, 3750, 3840 and 4,000 or 4043.
If Gold closes a strong daily candle above 3500, the ideal support lines to buy gold will be 3451, 3400, 3364, 3330 and 3300. The best support line, if Gold makes deep retracements will be 3228 and 3162.
2- Scenario 2: Expanded Range (Likely Scenario)
The range for the previous quarterly analysis was from 2956.5 to 3500, but for most of the past months since May 1st, Gold has been moving between 3262 to 3452. It is possible that Gold remains in the wider range (2956.5 to 3500), but makes wider moves. This scenario is possible because gold already reached a historic high in April and then entered a wide range, therefore it is possible to remain in the same range for the rest of the year.
This means gold could make deeper retracements into 3228, 3168, 3092, and 3024 and then go up towards, 3330, 3364 and 3452. When it reaches 3300, 3364 and 3452, then it starts new bearish moves again.
Conditions: Gold fails to close daily bullish candles above 3500 and fails to close daily bearish candles below 2956.5. The ideal condition is if gold closes a strong daily bearish candle below 3228 or 3162 between 14 Aug to 01 Sept 2025.
3- Scenario 3: Bearish Move (Unlikely Scenario):
If Gold closes a strong daily candle below 2956, then it will start a surprising bearish trend and will move towards: 2812, 2640 and 2550. This is not a likely scenario.

GBPAUD Ready for a Breakdown?1. Retail Sentiment
62% of retail traders are long on GBPAUD, while 38% are short.
Historically, retail positioning tends to be contrarian: an excess of longs often signals further downside pressure.
Volume: 824 long lots vs 506 short lots → net long exposure.
➡ Bias: Contrarian short
2. COT Report
GBP (August 26, 2025)
Non-commercials (speculators): 76k longs vs 107k shorts → net short of -31k.
Commercials: net long, but mainly for hedging purposes.
Trend: large speculators are slightly increasing shorts (+866) while reducing longs (-5,302).
➡ Bias: GBP weakness
AUD (August 26, 2025)
Non-commercials: 28k longs vs 129k shorts → heavily net short AUD.
Commercials have significantly increased long positions (+10,892).
Speculators remain bearish, but defensive positioning is building up.
➡ Bias: AUD still weak, but showing early signs of stabilization
3. Seasonality (September)
GBP: historically negative in September (weakness).
AUD: historically shows a moderately positive trend in September, especially in the last 10 years.
➡ Bias: GBPAUD historically bearish in September
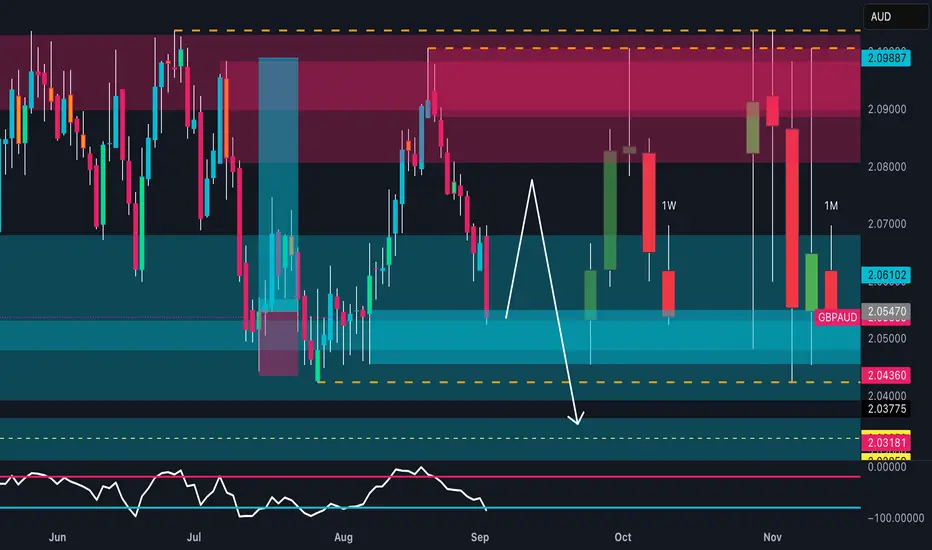
4. Technical Analysis
Structure: the market rejected the 2.09 supply zone and is now consolidating within the 2.03–2.09 range.
Price action suggests a possible rebound towards 2.07–2.08 before a potential breakdown towards 2.03.
➡ Technical bias: Short from supply zones at 2.07–2.08 targeting 2.04–2.03
5. Summary & Trading Scenarios
Macro/COT: GBP remains weak, AUD under pressure but with accumulation signs → mixed outlook, but seasonality favors AUD.
Sentiment: retail traders excessively long → confirms short bias.
Technical: bearish structure with key supports at 2.0430 and 2.0318.
👉 Conclusion: At the moment, GBPAUD shows a bearish bias supported by retail sentiment, seasonality, and price action. The most likely scenario is a test of the 2.04–2.03 zone in the coming weeks.
US30: The Market Is Looking Up! Long!
My dear friends,
Today we will analyse US30 together☺️
The in-trend continuation seems likely as the current long-term trend appears to be strong, and price is holding above a key level of 45,087.69 So a bullish continuation seems plausible, targeting the next high. We should enter on confirmation, and place a stop-loss beyond the recent swing level.
❤️Sending you lots of Love and Hugs❤️

GOLD: Strong Bullish Sentiment! Long!
My dear friends,
Today we will analyse GOLD together☺️
The market is at an inflection zone and price has now reached an area around 3,478.27 where previous reversals or breakouts have occurred.And a price reaction that we are seeing on multiple timeframes here could signal the next move up so we can enter on confirmation, and target the next key level of 3,484.06.Stop-loss is recommended beyond the inflection zone.
❤️Sending you lots of Love and Hugs❤️

SILVER: Bears Are Winning! Short!
My dear friends,
Today we will analyse SILVER together☺️
The price is near a wide key level
and the pair is approaching a significant decision level of 40.381 Therefore, a strong bearish reaction here could determine the next move down.We will watch for a confirmation candle, and then target the next key level of 40.271.Recommend Stop-loss is beyond the current level.
❤️Sending you lots of Love and Hugs❤️

EURUSD: Next Move Is Down! Short!
My dear friends,
Today we will analyse EURUSD together☺️
The recent price action suggests a shift in mid-term momentum. A break below the current local range around 1.16413 will confirm the new direction downwards with the target being the next key level of 1.16111 and a reconvened placement of a stop-loss beyond the range.
❤️Sending you lots of Love and Hugs❤️

DXY - OTE + SD Long TradeThis was my trade in TVC:DXY
This is the example of an absolute perfect entry and exit.
Entry at Optimal Trade Entry (OTE) level 0.5 .
Stoploss below swing low.
Exit half lots at Standard Deviation TP 1 and rest of the lots at Standard Deviation TP 2.
They say the perfect trade doesn't exist. But here is something to change your mind :)
Share your thoughts and analysis in the comments! I'd love to learn more.

AUD/USD – Last Push Before September Weakness?1. Retail Sentiment
77% of retail traders are currently short on AUD/USD, with an average entry around 0.6459. Historically, when retail positioning is heavily skewed to one side, the market often moves in the opposite direction. This suggests short-term upside potential (contrarian perspective).
2. COT Report (AUD & USD Index)
AUD (CME): Non-Commercials remain heavily short (129k vs 28k long), keeping speculative positioning bearish on AUD. However, Commercials significantly increased their long exposure (+10,892), indicating institutional accumulation.
USD Index (ICE): Non-Commercials hold 19k shorts vs 13k longs, showing a bearish tilt on USD, with additional shorts added (+1,916). Commercials remain net long (12k vs 6k short), defending dollar strength.
➡️ COT Takeaway: Speculators remain bearish on AUD and moderately bearish on USD. This divergence suggests potential sideways movement or consolidation in the short term.
3. Seasonality (September)
Historically, September has been a weak month for AUD/USD, with negative performance across the past 5–15 years. Seasonal curves confirm a bearish bias, especially in the first half of the month.
4. Technical Analysis
Supply Zone: Approaching strong weekly/monthly supply at 0.6600–0.6650.
RSI: Rising toward overbought, pointing to possible exhaustion of bullish momentum.
Structure: Price may complete a test of 0.6600–0.6650 before retracing back to demand zones at 0.6450 and 0.6400.
Trend Dynamics: The medium-term trend remains bearish, with corrective rallies providing opportunities to short.
Operational Outlook
Short-term Bias (1–2 weeks): Potential final push toward 0.6600–0.6650, driven by contrarian sentiment and COT divergence.
Medium-term Bias (September): Expected weakness with downside targets at 0.6450 → 0.6400, aligned with seasonality and speculative positioning.
Strategy: Look for short reversal setups around 0.6600–0.6650 with H4/H1 confirmation (structure break or engulfing pattern). Stop above 0.6700, targets at 0.6450 / 0.6400.

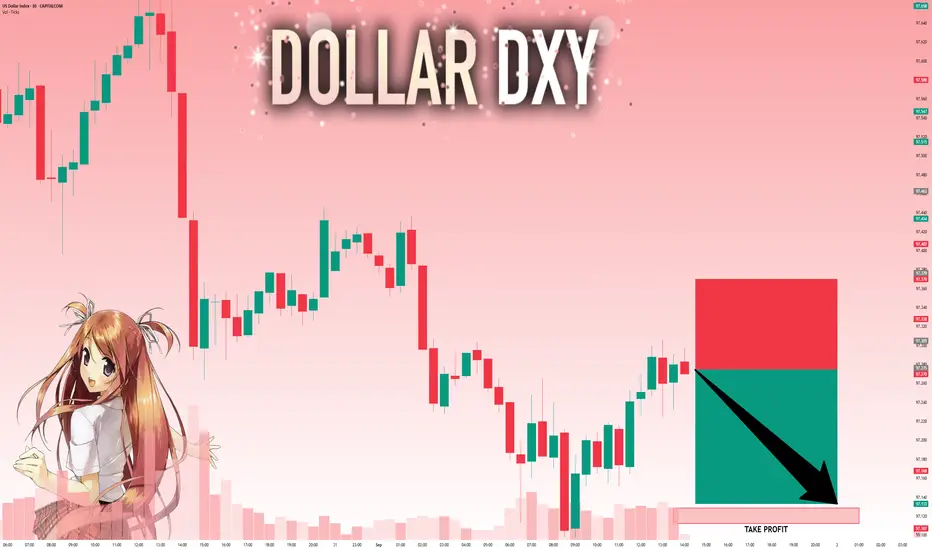
DXY: Target Is Down! Short!
My dear friends,
Today we will analyse DXY together☺️
The in-trend continuation seems likely as the current long-term trend appears to be strong, and price is holding below a key level of 97.275 So a bearish continuation seems plausible, targeting the next low. We should enter on confirmation, and place a stop-loss beyond the recent swing level.
❤️Sending you lots of Love and Hugs❤️
GOLD: Move Down Expected! Short!
My dear friends,
Today we will analyse GOLD together☺️
The recent price action suggests a shift in mid-term momentum. A break below the current local range around 3,478.78 will confirm the new direction downwards with the target being the next key level of 3,464.31 and a reconvened placement of a stop-loss beyond the range.
❤️Sending you lots of Love and Hugs❤️

SILVER: Will Go Up! Long!
My dear friends,
Today we will analyse SILVER together☺️
The in-trend continuation seems likely as the current long-term trend appears to be strong, and price is holding above a key level of 40.740 So a bullish continuation seems plausible, targeting the next high. We should enter on confirmation, and place a stop-loss beyond the recent swing level.
❤️Sending you lots of Love and Hugs❤️

EURUSD: The Market Is Looking Up! Long!
My dear friends,
Today we will analyse EURUSD together☺️
The market is at an inflection zone and price has now reached an area around 1.17119 where previous reversals or breakouts have occurred.And a price reaction that we are seeing on multiple timeframes here could signal the next move up so we can enter on confirmation, and target the next key level of 1.17324.Stop-loss is recommended beyond the inflection zone.
❤️Sending you lots of Love and Hugs❤️

EURUSD - Bullish momentum for the week!Introduction
The EURUSD has been consolidating for a prolonged period, sweeping both upside and downside liquidity in the process. After the liquidity sweep to the downside, price reacted strongly by moving upwards, indicating a shift in market structure. The pair has since inverted the previously bearish 4-hour fair value gap, which now acts as a bullish reference point, and is currently holding within the 1-hour fair value gap. As long as price maintains this 1-hour FVG support, there remains a strong case for further upside movement.
Liquidity Sweep
The recent downside liquidity sweep was a significant turning point. By driving below key lows and collecting stop orders, EURUSD effectively cleared the market of weak positions. This was followed by a sharp rejection, represented by a wick, which signaled strong buying interest at these levels. Since then, the market has been climbing steadily, showing intent to challenge the higher liquidity levels resting above.
Inversion
Following the liquidity sweep, EURUSD inverted the bearish 4-hour fair value gap. What was previously an area of supply and resistance has now been reclaimed and transformed into a demand zone. This inversion is an important bullish signal because it indicates that sellers were absorbed and that buyers have successfully taken control. As long as this zone remains intact, the path of least resistance continues to lean upward.
1-Hour Bullish FVG
Currently, EURUSD is resting on a 1-hour bullish fair value gap. This area serves as an important support level, and as long as it holds, price is likely to use it as a springboard for further gains. The next targets lie at the upside, beginning with the first objective at the intermediate resistance level labeled “Target 1,” before ultimately pushing towards the liquidity area above. By reaching this zone, the market would sweep short-side liquidations and potentially trigger momentum-driven buying.
Target Area
The primary targets for this bullish move are the two significant highs above the current range. These highs represent zones where stop-loss orders are most likely accumulated. By driving into and above these levels, EURUSD will effectively complete a liquidity grab, providing bulls with a logical profit-taking zone before the market considers a possible retracement. Such a move would align with the general principle of markets seeking liquidity before establishing a new direction.
Final Thoughts
In summary, EURUSD is showing constructive price action following its downside liquidity sweep and subsequent bullish reversal. The inversion of the 4-hour FVG and the current defense of the 1-hour FVG are both encouraging signs for buyers. As long as the 1-hour fair value gap continues to act as a firm support, the probability of an upward continuation towards the liquidity area remains strong. However, traders should also remain mindful that once the liquidity above the highs is collected, a corrective move to the downside could develop. For now, the short-term bias stays bullish, with clearly defined targets on the upside.
-------------------------
Disclosure: I am part of Trade Nation's Influencer program and receive a monthly fee for using their TradingView charts in my analysis.
Thanks for your support. If you enjoyed this analysis, make sure to follow me so you don't miss the next one. And if you found it helpful, feel free to drop a like 👍 and leave a comment 💬, I’d love to hear your thoughts!

DXY | 1SPT directional sentiment (SMC)“DXY moving like it just clocked in for a Monday shift 🥱📉… got smacked with that Friday LQC and now stumbling down to 97.100 like it’s chasing a Black Friday discount 🛒. Daily bias still bearish, 4H looking weak, and on the 1H the bulls tryna flex but only after sweeping some liquidity 🐂➡️🚪.
If price taps back into that chef’s POI kitchen 🍳 and fails to hold, the bears finna drag this straight to the basement 📉🐻. Until then, we vibin’ in discount land waiting for confirmation signals. This POI remains the make-or-break zone 🧩 heading into the next sessions.”**

XAU 90% Chance of hitting ALL TIME HIGHS?!Please let me know what you think. If I missed any details that may be important please let me know.
This is my way of giving back while getting other's opinions.
Thanks 🙏🏾

Can ETH make it out of this clearly defined correction range?
Excuse my mic quality, my Airpods highjacked my audio 🥹
If you can still understand what I'm saying, please let me know if I missed anything and what you think about this range. Thanks 🫡

XAUUSD 30M – Intraday Plan Around the RangePrice is holding between $3,417.84 (resistance) and $3,403.41 (support). We’re trading around $3,410–$3,411 inside a tight box. Scalps can work, but reversals are quick.
🔼 Bullish Plan (needs confirmation)
Trigger: A clean 30min body close above $3,417.84 (not just a wick).
Targets: $3,419.55 → $3,420.54 → $3,422.10.
Management: Take partials at $3,419.55, move SL to breakeven once $3,418 holds on a retest.
🔽 Bearish Plan (cleaner below support)
Trigger: 30min body close below $3,403.41.
Targets: $3,401.29 → $3,398.36 (trail if sellers stay in control).
Management: Scale partials at $3,401.29, protect the rest at breakeven.
🔄 Range Scalp (higher risk, small size)
Shorts: $3,416–$3,417 on a clear rejection → aim $3,410–$3,412, SL above rejection high / $3,420.
Longs: $3,403–$3,404 on a strong rejection wick → aim mid-range, SL below $3,401.
✅ Break Confirmation
Strong 30min close through the level.
❌ Invalidation
Breakout closes back inside the box on the next candle (trap).
Multiple wick with no momentum.
📌 Bottom Line
Above $3,417.84 → bullish bias to $3,420.54 and $3,422.10.
Below $3,403.41 → bearish bias to $3,401.29 and $3,398.36.
Inside the box = scalp only, keep risk tight.
