XAUUSD || GOLD ANALYSIS BASED ON SMART MONEY ORDERS (REAL TIME )🤖 GOLD ANALYSIS What’s Moving the Market Today? (September 26, 2025)
🚀 Welcome to Trade with DECRYPTERS
We break the charts down into clean levels so you can spot where smart money is buying 🟢 and selling 🔴.
Keep it simple, stick to the plan, and let the levels guide your moves.
🟡 Gold Slips to $3,747 — Dollar’s Flexing Its Muscles!
A stronger US dollar and mixed economic signals are pushing gold prices down.
When the dollar gains, gold gets less attractive as it’s priced in dollars.
Investors are watching closely!
🏦 Fed Says “No Rush” on Rate Cuts — Gold Feels the Heat!
Strong US jobs data makes the Fed cautious about cutting rates soon.
Lower rates usually boost gold, so this hesitation is bad news for prices.
🌍 Middle East Tensions Flare — Gold’s Safe-Haven Glow Shines!
Rising conflicts and US-China trade worries make investors nervous, driving them to gold.
As a safe-haven asset, gold prices get a lift when global risks spike.
📊 Jobs Report Looms — Will Gold Get a Break?
Next week’s US jobs data could shake things up.
If the report shows weakness, it might spark hopes for rate cuts, pushing gold prices higher.
🚀 US Economy Roars at 2.8% — Gold’s Not Impressed!
Solid US GDP growth eases recession fears, making gold less appealing.
Strong economies often reduce demand for safe-haven assets like gold.
⚡ Trump’s Tariff Threats Stir Chaos — Gold Loves It!
Talk of new tariffs and global uncertainty keeps gold in demand.
Investors turn to gold as a hedge when trade wars heat up.
🏛️ Central Banks Hoard 900 Tonnes — Gold’s Got Backup!
Central banks are buying tons of gold to diversify reserves.
This steady demand supports higher gold prices over time.
⚡⚡So what we are Expecting .. ? ⚡⚡ Current Price around 3744.
🟢 Buy Zone (3717–3698)
Buyers waiting to load up.
3705 is the key bounce point 🔑.
🔴 Sell Zone (3777–3790)
Sellers may step in hard here.
Watch for a sharp push ⚡ into this zone before any drop.
📊 Todays possible Daily Range:-
High of the day: 3792 ⬆️
Low of the day: 3703 ⬇️
CONCLUSION :-
With today’s range between 3703–3792, price action near 3744 sits right in the middle.
Key levels: Buy Zone 3717–3698 (bounce at 3705) and Sell Zone 3777–3790.
Bias is slightly bullish 🟢, but confirmation will come only from reactions at these zones.
Ict

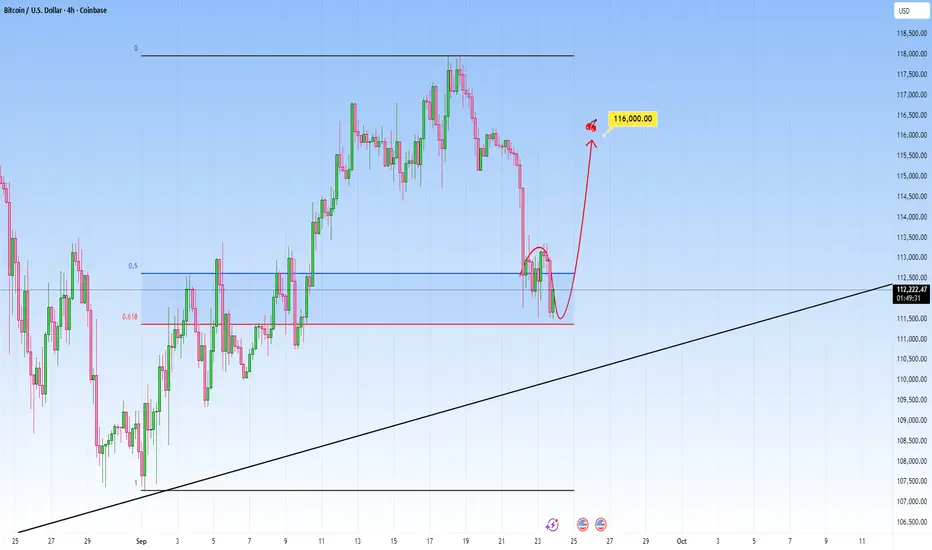
Bitcoin Analysis: Key Level to WatchPrice sold off aggressively, and now it sits within a key reaction area.
We can see price just tapped into the 0.5 and 0.618 Fibonacci retracement level of the last leg up. This is the golden pocket, a place where markets tend to react often.
Now look closely: price is showing early signs of rejection here, with wicks forming and momentum slowing down. If buyers step in here, and hold this zone that is our signals, targeting around the previous high.
But if price breaks clean below it, that invalidates the bullish idea and we could see some more continuation lower.
EURUSD - Bears are taking control!Introduction
This chart analysis of EUR/USD highlights key price action concepts such as liquidity grabs, fair value gaps, and inversions on the four-hour timeframe. By examining how the market has been moving recently, we can better understand where price may head next and how institutional activity could be shaping upcoming moves. The following sections break down the liquidity sweeps, the bearish and bullish setups, and the potential implications for future price direction.
Liquidity grab at the upside
The recent price movement shows a clear liquidity grab to the upside, where price aggressively pushed higher to take out resting buy stops above previous highs. This kind of move is typical of market makers and institutions seeking liquidity before reversing the price. Once those stops are cleared, the market often lacks the momentum to sustain higher levels, which can be a precursor to a reversal or deeper retracement.
Liquidity grab at the downside
After the upward liquidity sweep, the market also executed a downside liquidity grab. Price dipped lower to target sell-side liquidity, running stops beneath previous lows before showing signs of reacting. These moves are designed to trap both breakout traders and late sellers, creating the liquidity necessary for the next larger move. This back-and-forth price action emphasizes how the market often seeks liquidity in both directions before deciding on a sustained trend.
4h bearish FVG
A four-hour bearish Fair Value Gap (FVG) has formed, which acts as a strong area of imbalance where price is likely to return. This zone provides a potential entry point for institutional traders looking to short, as it represents inefficiency in the market that has yet to be filled. As long as price respects this area and reacts bearishly upon re-entry, it strengthens the case for continuation to the downside.
4h bullish inversion
At the same time, there is a four-hour bullish inversion level, where previous resistance has flipped into potential support. This area can act as a temporary base for price to consolidate or retrace before resuming its bearish trajectory. If the inversion holds, we might see short-term bullish reactions, but the broader market structure still favors sellers as long as the bearish FVG remains intact.
Final thoughts
Overall, the current EUR/USD setup suggests that the market is in the process of engineering liquidity on both sides before deciding its next major move. The upside and downside liquidity grabs confirm the presence of institutional activity, while the bearish FVG highlights a potential point of interest for further selling. The bullish inversion may offer temporary support, but the broader bias remains bearish until proven otherwise. Traders should watch how price reacts to the highlighted zones, as these areas are likely to provide the clearest signals for the next significant move.
-------------------------
Thanks for your support. If you enjoyed this analysis, make sure to follow me so you don't miss the next one. And if you found it helpful, feel free to drop a like 👍 and leave a comment 💬, I’d love to hear your thoughts!

EURUSD Quick tradeThere is a good SMT signal on the EURUSD, which the price may react to in order to fill the Liquidity void that occurred yesterday and then continue the decline to target more liquidity areas.

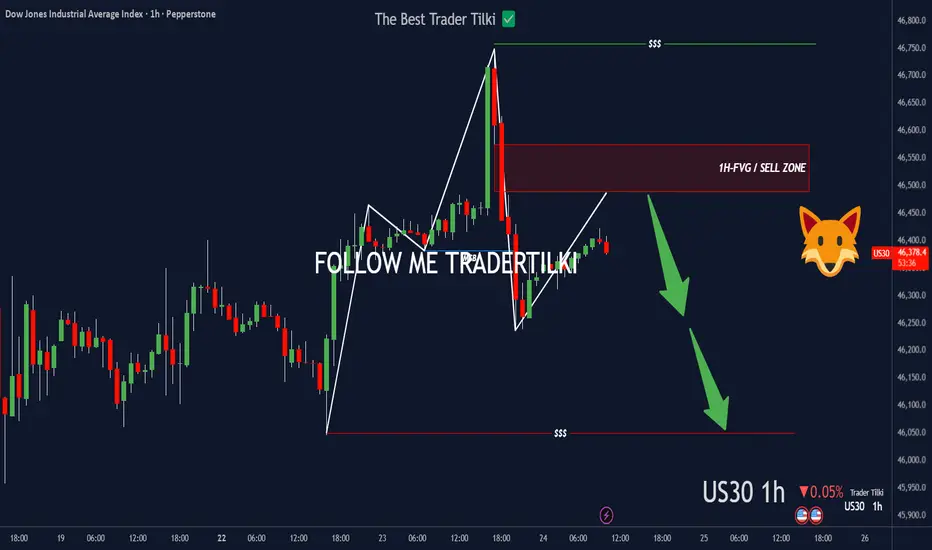
US30 left a footprint—FVG’s callin’.Hey Guys,
Once US30 hits my SELL zone, I’m pulling the trigger—targeting 46049.0
• Entry: 46574.5.0 or 46488.9
Set the stop point according to your own margin, my friends.
Every like you drop pushes me to share more setups like this. Big thanks to everyone showing support!
$BTC beautiful range to play i will looking for short!lower time frame rejection call lead us for more downside ! keep eye on it..

ETH and BTC seeking further lows?Everything explained in video, please let me know if I missed anything or any other thoughts 🙏🏾

REAL VS FAKE CHOCK🔹 1. Real Choke vs Fake Choke
A **Choke** in ICT/SMC language usually refers to a **block of price action where liquidity is absorbed** and either the trend reverses or continues strongly. It is connected to the idea of **Order Blocks, IDM (Imbalance-Demand-Mitigations)** and **Liquidity Absorption**.
### ✅ Real Choke
* Happens when **genuine liquidity is absorbed** by institutions (big players).
* Price reacts to the choke level → gives a **clear displacement** in opposite direction.
* Characteristics:
* Strong rejection (impulsive move away).
* Volume & imbalance support the move.
* Leaves behind a valid **IDM / FVG / Order Block**.
* Usually aligns with **higher timeframe POI** (HTF OB, FVG, BPR).
👉 **Effect**: Becomes the base for a **true reversal or strong continuation**.
---
### ❌ Fake Choke
* Happens when price **pretends to absorb liquidity** but it’s just a **stop hunt / inducement**.
* Market sweeps liquidity near choke level → then continues in original direction.
* Characteristics:
* Small/weak rejection, no real displacement.
* No proper imbalance or absorption.
* Often formed just to **trap retail traders** thinking reversal is coming.
* Seen in **mid-range / liquidity inducement zones**, not at HTF POI.
👉 **Effect**: Leads to **continuation in same direction** after trapping liquidity.
---
## 🔹 2. Why IDM (Imbalance Demand Mitigation) is Important
**IDM** is the footprint of institutions when they:
* Absorb liquidity,
* Create imbalance, and
* Mitigate their positions later.
It’s important because:
1. **Shows Institutional Interest** → IDM confirms that Smart Money actually participated.
2. **Validates Choke** → If choke has IDM inside it → higher chance it’s **real**.
3. **Gives Entry Points** → IDM zones often become mitigation levels (precise entries with low risk).
4. **Separates Fake vs Real** → Fake chokes usually have no IDM footprint.
---
## 🔹 3. Role of IDM in Reversal & Liquidity Absorption
When market is reversing:
* First, **retail liquidity is collected** (fake choke).
* Then, institutions place **real choke + IDM** to absorb liquidity.
* The IDM ensures that:
* All **supply/demand imbalance** is cleared,
* Institutions get filled,
* Price is ready for a **clean reversal**.
👉 **In Short:**
* **Fake choke** = liquidity grab.
* **Real choke + IDM** = liquidity absorption + reversal base.
---
⚡So, the easiest filter is:
* If a choke has **IDM (clear imbalance & mitigation footprint)** → it’s **real**.
* If not → it’s just a **fake liquidity sweep**.

GBP/USD Setup: Breakout or Fakeout at 1.3600 Key Level?🔎 Technical Analysis
On the daily chart, GBP/USD is trading around 1.3550 after rejecting the dynamic support of the ascending channel. The key resistance lies at 1.3600. A daily close above this level could open the way towards 1.3700–1.3750, a strong supply zone. RSI remains in consolidation, far from extremes, suggesting more room for upside.
Scenarios:
Bullish: Break above 1.3600 → target 1.3700–1.3750.
Bearish: Rejection below 1.3500 → retracement to 1.3400, extension to 1.3280.
📊 COT Report
USD Index (CFTC 09/09/2025): Non-commercials added +5.5K longs and +6K shorts, net short remains dominant → slightly weak USD bias.
British Pound: Non-commercials trimmed longs (-1.2K) and shorts (-748), but commercials added massive longs (+66K) → long-term bullish hedging on GBP.
👉 Overall: GBP supported, USD weak → bullish bias for GBP/USD.
📅 Seasonality
September historically shows a neutral/slightly bearish tendency for GBP/USD (-0.3% average over 20 years). The 2-year model suggests a mid-September drawdown followed by recovery in October.
👉 Mixed bias: short-term weakness possible, but October seasonality favors GBP strength.
🧠 Retail Sentiment
63% short vs 37% long.
Retail is heavily short – a classic contrarian signal, pointing towards a possible upside liquidity grab above 1.3600–1.3700.
📌 Trading Plan
Primary bias: Bullish above 1.3500 targeting 1.3700–1.3750.
Confirmations: COT favors GBP, retail short, bullish technical structure.
Risks: September seasonality slightly bearish → potential pullback to 1.3450 before resuming higher.

EUR/USD Breakout Incoming? COT & Sentiment Point to 1.1850COT Report (09/09/2025)
EUR (Euro FX CME): Non-Commercials increased longs (+2,389) and reduced shorts (-3,696) → bullish bias.
USD (US Dollar Index): Non-Commercials remain net short (24,750 vs 19,192 longs). Slightly bearish bias on the dollar.
👉 The combination suggests a favorable context for Euro strength against USD.
📊 Seasonality
September is historically flat or slightly negative for EUR/USD, but over the last 5 years seasonality shows a recovery in the second half of the month.
👉 This reinforces the idea that downside risk is limited and that pullbacks may offer long opportunities.
🧠 Sentiment
Retail traders: 74% short, only 26% long.
Classic contrarian signal: retail is short, which supports a long bias.
📉P rice Action & Technicals (H1/D1/W1)
Price is moving inside a daily ascending channel (uptrend in progress).
Key resistance: 1.1800 – 1.1850 (weekly supply cluster).
Main support: 1.1650 – 1.1600 (daily demand zone, RSI reacted).
Daily RSI above 50 → positive momentum, not overbought.
✅ Operational Summary
EUR/USD shows a favorable context (fundamentals + COT + sentiment) supporting the upside.
Technical structure favors a test of 1.1850 resistance.
Best strategy: look for long entries on pullbacks or breakouts, with invalidation below 1.1650.

CADJPY Breakdown Incoming? Specs Selling CAD, Buying JPY1. Retail Sentiment
68% long vs 32% short → The majority of retail traders are positioned long.
From a contrarian perspective, this increases the risk of a downside move to flush out these long positions.
2. Seasonality
JPY (September): historically tends to appreciate from mid-month onward.
CAD (September): historically weak, with flat to negative performance.
Seasonal Bias: favors strong JPY / weak CAD → bearish CADJPY outlook.
3. Commitment of Traders (COT)
CAD (Sept 16, 2025):
Non-commercials: still heavily net short (128k short vs 21k long).
Commercials: strong long exposure (218k), but speculative flows remain bearish.
Bias: CAD continues to be sold by speculators → bearish pressure.
JPY (Sept 16, 2025):
Non-commercials: net long (161k long vs 100k short).
Commercials: strong shorts (163k), as usual for hedging.
Bias: speculators are accumulating JPY longs, reinforcing strength.
👉 COT View = Weak CAD, Strong JPY → Bearish confirmation for CADJPY.
4. Technical Analysis
Current price: 106.77, trading inside the daily demand zone (106.50–106.00).
Structure:
Well-defined descending channel.
Multiple bounces in the 106.00–106.20 area → key support zone.
RSI neutral, not yet oversold.
Scenarios:
Scenario A (probable): break below 106.20 → extension towards 105.50, then 104.80 (swing low zone).
Scenario B (alternative): technical bounce from demand (106.20–106.00) → recovery towards 107.80/108.00 (weekly supply).
✅ Conclusion: CADJPY shows a bearish setup supported by COT, seasonality, and contrarian sentiment. The technicals highlight a descending channel with potential breakdown below 106.00. Best setups: short on pullbacks with targets at 105.50–105.00.

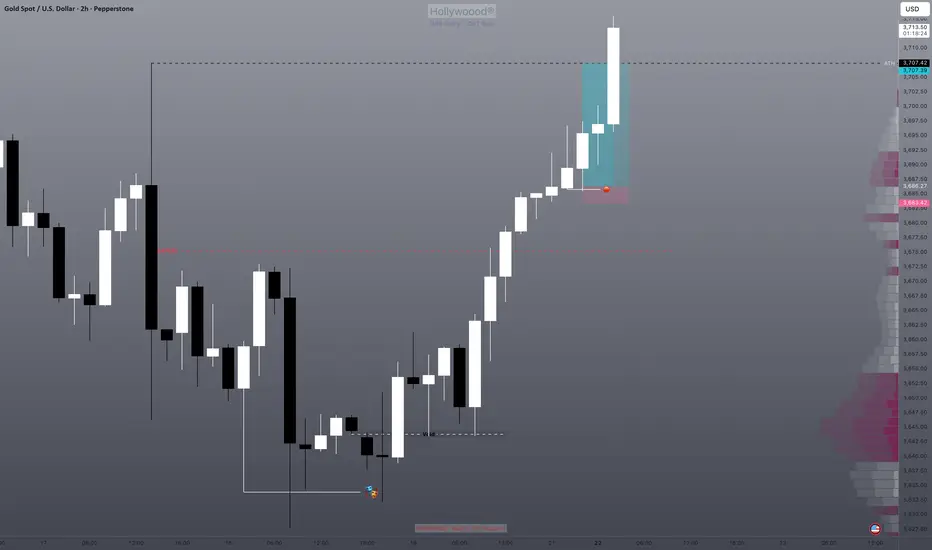
Gold: One of the easiest longs in historyStop hunt of the leading candle, enter long and hold to ATH.
Rinse and repeat. Sometimes the long winded stuff loses the value of how simple it can be 💎
$BTC short trade hit target !we go down more?Tp hit for BTC short i will close 70% of trade here ... if we loss this level we might see more downside ! what you think for new week ? we go down side more for crypto market?

ETH and Crypto going for weekly correction levels?Everything explained in video, let me know if I missed anything 🙏🏾
Don't forget to like this if you would love to see more of these reviews!

Gold at Make-or -Break ZoneHello Traders,
What a ride the FOMC gave us! 🎢
Gold came within just $3 (60 pips) of our first target — so close!
The FOMC drop sent price from $3707 → $3628, where buyers stepped in around the $3625–$3635 demand pocket, defending the structure above the Higher Low at $3612.
Since then, gold has been trying to stabilize… but remains capped under the First Cap supply zone at $3685–$3695.
Price is now coiled between strong resistance above and layered demand below — setting up for the next big breakout (or breakdown).
So the question is:
What’s your next target for gold?
Eyeing $3713... or looking beyond at $3756?
This week, we zoom out to the weekly chart to get a clearer view:
Price broke structure at $3480, entered premium territory, and is now testing a key supply zone.
👉 Will gold smash through $3730 and print new highs?
👉 Or is this where supply takes control and drives us lower?
Drop your thoughts below 👇
Let’s dive in and see what the charts are telling us this week 📊
🟡 GOLD PRICE ACTION SUMMARY
✅ Overall Bias: Bullish, but at a major resistance zone
🔸 WEEKLY
Trend: Strong bullish (BOS at 3480)
Current Zone: Inside key resistance at 3680–3730
🔼 Bullish above 3730 → Targets: 3800 → 3920 → 4000
🔽 Rejection → Pullback toward 3370 or deeper to 3050
🔸 DAILY
Structure: Bullish
Resistance: 3675–3705 (active supply)
🔼 Break above 3705 → Targets: 3755 → 3810 → 3865
🔽 Rejection → Drop toward 3580 → 3500
🔸 H4
Key Resistance: 3675–3695 (Ceiling Block), 3707 (weak high)
🔼 Break above 3707 → 3750 → 3840 → 391
🔽 Failure at resistance → 3625 → 3575 → 3545
🔸 H1
Resistance Levels: 3685–3707
Support Zones: 3665 → 3645 → 3625 → 3612
🔼 Break & hold above 3707 → 3725 → 3745
🔽 Breakdown below 3665 → 3635 → 3575 → 3530
📌 Key Decision Zones
🔁 3685–3707 = Make-or-break resistance zone
🛡 3625–3635 = Critical FOMC support block
💣 Lose 3612 HL → shifts momentum bearish short-term

Bitcoin - Will the parallel channel hold?Introduction
The Bitcoin market is currently showing an interesting structure that offers both bullish and bearish possibilities. By analyzing the liquidity dynamics, the channel formation, and key areas of interest highlighted on the chart, we can gain a better understanding of the potential scenarios that may play out in the short to medium term. This analysis focuses on the recent liquidity sweep, the behavior within the rising channel, and the critical zones that could act as decision points for price movement.
Liquidity sweep above the highs
Recently, the market performed a liquidity sweep above the previous highs. This type of price action typically occurs when liquidity pools are triggered, trapping breakout traders and providing institutional players with favorable entries in the opposite direction. The sweep has set the stage for the next move, and it becomes crucial to see whether price sustains above this level or rejects it decisively.
Rising channel
Price is currently trading within a rising channel, which often acts as a short-term bullish structure but can also precede reversals if broken to the downside. The channel is providing clear levels of support and resistance, with the midline serving as a short-term equilibrium point. As long as price remains inside this channel, traders should expect oscillations between its boundaries, but any break below it could trigger a stronger move toward lower support zones.
Bearish scenario
In the event that price fails to hold within the channel, the bearish scenario points toward a retest of the lower fair value gap (FVG) around the 113,000 level. This would align with a deeper correction, offering the market a chance to rebalance inefficiencies left behind during the recent bullish rally. A sustained breakdown from the channel could accelerate selling pressure, with liquidity below key lows acting as a magnet for price.
Bullish scenario
On the other hand, if price manages to respect the rising channel and reclaim the liquidity sweep level, the bullish scenario would see a continuation toward the higher 4-hour fair value gap around 119,000–120,000. This area is a major point of interest, as it represents an unfilled imbalance that could attract buyers if momentum continues. Holding above the midline of the channel would strengthen the bullish outlook and could even lead to a retest of previous highs.
Final thoughts
Overall, the market is at a decisive stage where both bullish and bearish outcomes remain valid. The liquidity sweep has created a reaction point, and the rising channel offers a clear framework for monitoring price behavior. Traders should remain flexible and prepared for either outcome, watching closely for confirmations such as a clean break of the channel or a strong reclaim of resistance levels. Ultimately, the reaction around the current structure will determine whether Bitcoin continues higher toward the upper fair value gap or corrects lower into the demand zone below.
-------------------------
Thanks for your support. If you enjoyed this analysis, make sure to follow me so you don't miss the next one. And if you found it helpful, feel free to drop a like 👍 and leave a comment 💬, I’d love to hear your thoughts!

Review of Gold's expected rally and why we entered long todayLook at this chart and understand why it was the only move that was likely to happen today:
Firstly we already corrected all of the range down (balanced), that was the first key that we're potentially going to correct the drop next.
This is how markets work; correction of imbalances and continuations of the master trend direction.
The master/macro trend target is always the easiest no brain target for those of us who actually make money trading. Anytime we correct imbalances, we are looking to buy, only degenerates are looking for the short target and never realize where it is or when it's been hit--hello? It's the imbalanced ranges below, write this down:
When we are bullish, price will only go down to correct the major imbalanced ranges and then continue bullish.
There is no supply zone until the large wick range.
I will help you understand this stuff tirelessly even for free although I charge a $100/mo mentorship I don't care if people pay me, I just want you to see the easy truths about the chart most don't see 🫡

XAU/USD Update 1Next move on the way, focus on proper risk management & stay disciplined. Wishing you successful trades..!
Confluences & Key Reason:
1. Hidden demand zone.
2. FVG still in pending.
3. E.L still in pending.
4. SSL still in pending.
5. If Bulls pressure remain strong then we'll see huge upside rally.
This is not a financial advise. Confirmation very important. Let's see how it will work.

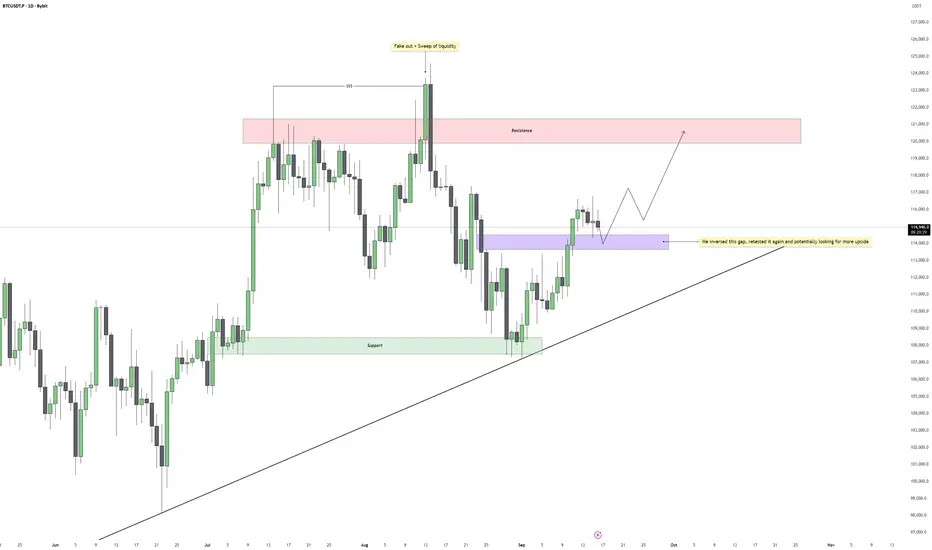
Bitcoin - Daily Gap Inversion Aligns with UptrendBitcoin recently made a push higher that cleared local highs and swept liquidity above the previous range. This move created a temporary fake out before price sharply retraced, filling inefficiencies left behind in the market. After completing this corrective move, price has begun reclaiming structure and is now respecting higher timeframe demand zones.
Daily Structure
The daily chart continues to show a clean uptrend, with higher lows forming along the rising trendline. After the liquidity sweep, price retraced to test key imbalances and has since confirmed a bullish shift by inverting a daily gap. This gap has been retested multiple times, suggesting it is holding firm as support and reinforcing the bullish continuation bias.
Liquidity Dynamics
The sweep of liquidity at the highs cleared buy-side pressure, resetting the market. This type of liquidity event often precedes sustained directional moves as the market seeks out new inefficiencies and liquidity pools. For now, downside liquidity has been satisfied and the path of least resistance appears to be higher.
Upside Scenarios
If the inverted daily gap continues to hold, price could target the major resistance block above 120,000 USDT. This zone aligns with the previous rejection area, where liquidity remains untested. Any approach into this resistance will be key to monitor for continuation or rejection.
Downside Risk
Should Bitcoin lose the daily inverted gap and trendline support, further retracement toward 111,000 to 112,000 USDT becomes possible, where a deeper liquidity pocket and structural support remain. Until then, the higher low structure remains intact.
Conclusion
Bitcoin has absorbed liquidity, filled inefficiencies, and inverted a daily gap that is now holding as support. Combined with the ongoing daily uptrend, this strengthens the bullish outlook with a clear target toward the 120,000 USDT resistance zone.
___________________________________
Thanks for your support!
If you found this idea helpful or learned something new, drop a like 👍 and leave a comment, I’d love to hear your thoughts! 🚀
Bitcoin: Is it time?Being a crypto enthusiast, these are exciting times!
We have seen Bitcoin hit all time highs just a couple of weeks back, topping out $124,580 before retracing down to $107,000.
Many questioned: HAS THE BITCOIN BUBBLE BURST?
I would like to disagree with that.
With the rate cuts being 'almost' certain today, we expect risk assets (such as BTC) to be more attractive investments for both firms and investors globally.
After reaching the all-time highs and with the news event scheduled for mid-September, the sell off into the discount zone (as shown in the chart) was expected from my end and we have rebalanced the impulsive price action that led to the all-time high.
What I appreciated from the price driving down into the discount zone was the reaction the market gave us, it has reacted positively and that specific price region has invited investors and firms like Michael Saylor (MicroStrategy) to reinforce their position and increase their Bitcoin holdings.
Will the market explode as soon as the rate cuts news is released? I don't think so.
The market will experience liquidity stress, especially with how the economy is holding up at the moment and the 'almost certain' news outcome to both retail and institutional.
We may see spikes towards both directions, so my advice? Wait for the market to cool down once the news is released and position yourself accordingly.
The news will give us a direction until the end of the year, giving you a clear bias.
Trade safely and good luck to all!

Is NASDAQ going for a correction or Stop Hunt?Are we on the right track? If I missed anything please let me know in the comments 🙏🏾

Possible retracement in EURUSDThere is a possibility of the EURUSD falling in the event of a break of the 1.17901 level, because the EURUSD has risen since the beginning of the week by more than 80 points, and it is likely to fall today or tomorrow.

NAS100 Buy Entry’s Clean, R:R 2.00 — Setup Locked & Loaded!Hey traders,
Here’s my NAS100 setup based on the 1-hour chart:
🟢 Buy Entry: 23998.77
🔴 Stop Loss: 23884.81
🎯 TP1: 24045.42
🎯 TP2: 24097.67
🎯 TP3: 24225.56
Risk/Reward Ratio: 2.00
Every like you drop is pure fuel for me to keep sharing these setups.
Big thanks to everyone standing by and showing support.
