Bitcoin Dominance Is Still HereDespite the fact that Bitcoin is breaking all-time highs and that some ALTcoins are already on the rise, Bitcoin dominance is actually still here and there can be space for more upside to complete a five-wave bullish impulse before Bitcoin dominance slows down and ALTcoin dominance kicks in. From Elliott wave perspective, we are tracking a bullish triangle in wave 4 that can push Bitcoin dominance towards 57% - 60% for wave 5.
Impulse

MATIC 44-61$Now the price is in the asset redistribution zone of 0.4238-2.1520
The price of the volume of this redistribution is 0.8450
The price of the total volume is 0.0218
There are already 3697 between them%
Expected growth 44.7959-61.4676
From the current value, another 3,600%
MLong

Cardano Can Retest December 2023 HighsCardano with ticker ADAUSD can be trading in a higher degree wave (5) that can retest the December 2023 highs.
Looking at the short-term hourly chart, we see it slowing down for subwave iv correction before a continuation higher for wave v of (5) towards 0.70 - 1.00 target area. Ideal support comes here around base channel resistance line and 0.58 - 0.56 area.

BITCOIN KEY LEVELS!There is a very nice range shown on the BTC chart!
I mapped out these levels to make it easier for you to see where the LONG opportunities and SHORT opportunities are.
Let me know your thought sin the comments below
Calculate Your Risk/Reward so you don't lose more than 1% of your account per trade.
Every day the charts provide new information. You have to adjust or get REKT.
Love it or hate it, hit that thumbs up and share your thoughts below!
This is not financial advice. This is for educational purposes only.

Crypto Market Slowed Down Within Wave 4 CorrectionGood morning Crypto traders! Crypto market slowed down yesterday with an interesting spike down into important support area for a higher degree wave 4, from where we can see a quick stabilization. Well, we believe that more upside is coming for wave 5 of (3), just be aware of more complex wave 4 here if the market stay slow and sideways for a longer period of time.

YNDX Who knew?The distribution in the range 87.11-74.93 marked the beginning of the movement!
Refueling in the control zone 55.45-47.70 confirmed the continuation of movement.
+ in this zone, I set new levels on the distribution, in the range of 53.81-44.02.
Subsequent control zones Global 35.83-26.92 and local 29.46-24.10 were breached with a squish!
Sales stopped in the Global Area of Interest 18.42-11.16
Local area of interest 16.46-11.24
The purchase level of 14.59 is the result
The price of the total volume is 32.08
Results:
1) The initial distribution of the asset 87.11-74.93 shows us the end point 15.77!
2) Refueling in control zones 55.45-47.70 corrects the end point 14.59!
3) The black Swan does not play a special role on the end point! He can only speed up or slow down the course of events!
I personally associate this process with a car!
HOW MUCH FUEL YOU FILL IN THE TANK, THAT'S HOW MUCH IT WILL LAST
!!! MATH AND NO MAGIC !!!
Y

GBPUSD I Short-term buy from support after recent impulseWelcome back! Let me know your thoughts in the comments!
** GBPUSD Analysis - Listen to video!
We recommend that you keep this pair on your watchlist and enter when the entry criteria of your strategy is met.
Please support this idea with a LIKE and COMMENT if you find it useful and Click "Follow" on our profile if you'd like these trade ideas delivered straight to your email in the future.
Thanks for your continued support!

NASDAQ100 Slows Down For An Intraday CorrectionNasdaq100 is in strong bullish trend and there can be room for more upside within a projected intraday five-wave bullish cycle. Nasdaq100 futures recently slide as Alphabet shares drop on disappointing Google ad revenue. However, that's pretty nice textbook 17300 - 17200 support area within an (a)-(b)-(c) correction for wave "iv", so ahead of today's FED meeting, be aware of a bullish continuation for wave "v". Invalidation level is at 17050.

GBPUSD Points Higher After A ConsolidationCable has seen some nice recovery at the end of 2023; move that is looking impulsive so more gains can be seen after the corrective retracement that is now underway. Ideally, that's wave four correction, a higher degree pullback that can sooner or later send prices back to the highs, possibly already now after first support for a triangle near 1.26 held, but we still need broken upper triangle line near 1.2750 to make sure that fifth wave up is in play for 1.29-1.3 Deeper support is at 1.25 if 1.26 flor is broken.

What Color Is Your Tesla 🚘Hello TradingView Family / Fellow Traders,
On Weekly: Left Chart
TSLA has been hovering inside a range between the $200 support and $300 resistance.
Lately, TSLA has been bearish trading inside the falling blue channel and it is currently approaching the lower bound and $200.0 support.
🏹 Hence , as long as the 185.0 support holds, we will be looking for buy setups on lower timeframes.
On H1: Right Chart
📈 For the bulls to take over, we need a momentum candle close above the last major high in gray at 218.0
📉 Meanwhile , TSLA would be bearish and can still trade lower to dive inside the 185-200 support zone before trading higher.
📚 Always follow your trading plan regarding entry, risk management, and trade management.
Good luck!
All Strategies Are Good; If Managed Properly!
~Richard Nasr

ASTR-2024A promising parachain in the DOT ecosystem
The price came to an imbalance zone of 0.13-0.22
The next zone is 0.56-1.42
The growth potential is 7-9 $
The price of the total volume is 0.0427
The purchase price of 0.035
At the level of 0.14 closed 50% of the pose (body removal)
The rest went into a long-term portfolio!

After strong upward movement, BTC can correct to support levelHello traders, I want share with you my opinion about Bitcoin. By observing the chart, we can see that the price a not long time ago started to trades in an upward channel, where it at once rebounded from the resistance line and declined to the support line, breaking the 43200 support level, which coincided with the support zone. After this, the price tried to rise to the support zone, but failed and soon it bounced from this zone and declined back to the support line of the channel. Next, BTC repeated movement up, and this time, the price broke the support level. But later price in a short time declined to support line of the channel, after which BTC made impulse up to the 45700 resistance level, which coincided with the resistance line of the channel and seller zone. Then price declined back to the support line and soon made a strong upward impulse to 48000 points, thereby exiting from the channel and breaking the resistance level. After this movement, BTC recently started to decline and at the moment it trades below the 45700 level. So, possibly Bitcoin can continue to decline to support level. Therefore I set my target at the 43200 support level, and then we'll see where BTC continues to move. Please share this idea with your friends and click Boost 🚀

DASH Purchase!!!DASH has reached the global bottom!!!Purchase zone 18.17-30.23
Purchase level 25.04
The price of the total volume is 77.99
Volume price 27.51

GBPJPY I Impulse Correction with Caution Welcome back! Let me know your thoughts in the comments!
** GBPJPY Analysis - Listen to video!
We recommend that you keep this pair on your watchlist and enter when the entry criteria of your strategy is met.
Please support this idea with a LIKE and COMMENT if you find it useful and Click "Follow" on our profile if you'd like these trade ideas delivered straight to your email in the future.
Thanks for your continued support!

TON-2024Ton is in the FIRST global redistribution in the form of a triangle!
The price of the total volume is 2.281
Everything below is acceptable for purchase for a couple of cycles and more than 5-10 years!!!
I expect an exit at the end of this month!
The first control zone is 5.646-11.140
Level 7.931
Next zone 40.526-147.418
District 69.801-85.589

ARB-2024The global alignment for 2024!
The price goes to the Control ZONE 3.02-4.79
Level 3.81
Correction in this zone (FLAT) or a rollback to the level of 1.91
Further hike to the level of 16.61-19.07
In the global sales area 11.49-27.55
BEAR to the 4.25-1.57 zone!!!
The price of the total volume is 1.1673!!!

DFCGlobal purchase zone 0.1245-0.0670
The level is 0.1024
Locally, it wants to be above 0.155-0.0914
The level is 0.1148
The price of the total volume is 0.2195
Sellers do not put pressure on the market, distribution is proceeding cautiously!
D

SELL OPPORTUNITY ON AUDUSD On AUDUSD Price is currently trading within a well-defined ascending channel on 1HTF, inside a 4HTF ascending (reversal pattern) this gives an additional confluence.
Waiting for price to test the upper dynamic trendline that serves as my support before going short.
If you found this helpful, please support your fellow trader with a like.

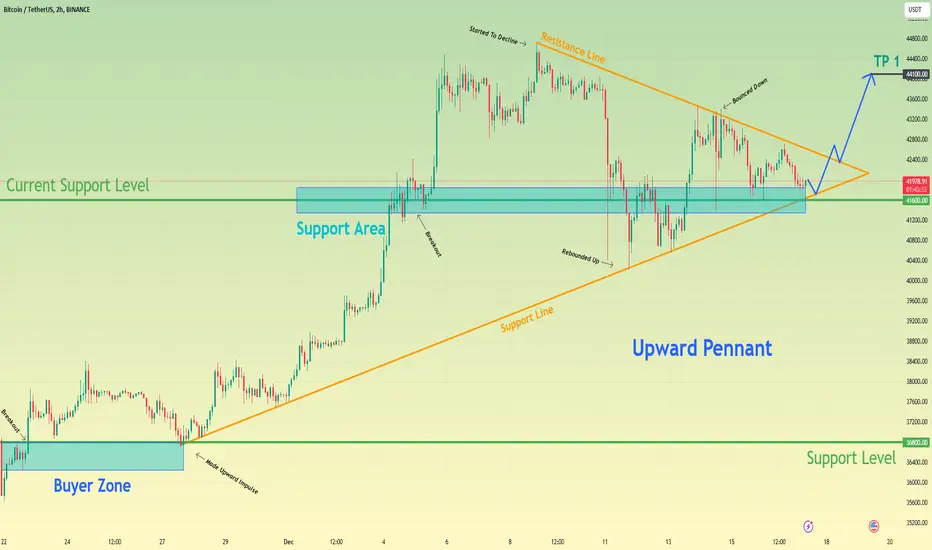
Bitcoin can correct to support line and then make upward impulseHello traders, I want share with you my opinion about Bitcoin. Observing the chart, we can see that the price some time ago reached the 36800 support level, which coincided with the buyer zone and in a short time broke it. Then BTC rose a little more, but soon it made a correction back, after which it entered to upward pennant. In pennant, the price at once rebounded from the support line and made a strong impulse up to the current support level, which is located in the support area. Later BTC broke this level too and continued to move up to the resistance line of the pennant. After it reached this line, the price around down and in a short time declined to the support line, breaking the 41600 level, but a not long time ago it backed up. As well recently, Bitcoin reached the resistance line of a pennant, after which it rebounded to the support area. And now BTC continues to trades near this area and in my mind Bitcoin can correct to support line of pennant and then make an upward impulse, thereby exiting from this pattern. For this case, I set up my target at the 44100 level. Please share this idea with your friends and click Boost 🚀
Cable Is Rising Within A Five-Wave ImpulseCable (GBPUSD) made a nice bounce, with price coming to a new high as BoE turned out to be more hawkish than expected if we consider the votes for the hike by BoE members. So it appears that the pound will stay in the uptrend as the whole pattern from an October low now shows an impulsive price action in progress. Ideally, that's wave five of 3 in progress with some short-term resistance around 1.2850.

UWGN is in the Global Purchase Zone!!!The price has arrived and is in the Global Purchase ZONE of 37.0-18.8
Global purchase level 27.9
Left the local area 24.8-13.6
Local purchase level 20.5
The purchase level according to the backup scheme is 22.3
The volume price is 25.9 !!!
All levels have worked out !!!

BTC is in an Imbalance Zone!!!Bitcoin has entered the Global Zone of Control (imbalance) 42690-59175
Local area 45070-54547
Level 1) 49038
2) 49320
Purchase Levels 15652.1
15732.0
Volume price 19199.2

FLOW has left the zone!!!The price formed a triangle in the control zone of 0.607-0.704,
and after the breakdown left the GLOBAL ACCUMULATION ZONE!
The Next Control Zone Is 0.931-1.233
My Control zones, some traders call them imbalance zones!!!
