DAX Rebound Signals Potential Upside After Key Support HoldGerman DAX was very non-directional, basically since June of 2025 and what I see is some very nasty moves on both sides of the market, but what got our attention recently is that the price has stopped at key support levels around 23k to 23300 area, from where we can see a very interesting and strong rebound. What is most important is that this rebound is coming after only three waves down from all-time highs, so it can be part of a WXY complex correction here in a fourth wave on a daily chart. Of course there can be some other labelings as well, but with any approach you will probably come out with the same idea that this whole price action in this five to six month range is corrective, and whenever we see a correction we know that sooner or later it should be fully retraced, meaning the price could already be headed back toward the highs from current levels.
Bounce looks impulsive, and it may have formed a bullish setup formation with waves 1 and 2, so we think that more gains are coming within wave 3, especially if breaks back above 24500 bullish confirmation level.
Impulse

SP500 Remains Bullish After The FED MeetingS&P 500 has made a very nice retracement recently; in fact for almost the whole November we have seen a pullback of around 5 to 6%, which is quite a lot for the S&P 500, and what is really important is that the market has stopped around the 6500 area, which basically goes back to October 10th when we saw a massive sell-off on that Friday when Trump threatened with new tariffs on China. But afterwards, as you can see, the market recovered, so it looks like a very beautiful rebound from that zone with impulsive characteristics, even beyond the diagonal and trendline resistance lines. This likely confirms that bulls are ready to resume higher into a potential fifth wave, which can be made by a new lower-degree five-wave bullish cycle. Ideally, new trend will resume soon after the current setback that can be flat in wave 2, so be aware of a bullish continuation into all-time highs and 7k are, possibly still this month.
After the FED meeting last week, we can see it making an irregular flat correction in wave (2) that can find the support at 6800 area, so soon be aware of a bullish resumption within wave (3).

Silver Extends Gains as Wave Structure Points HigherSilver broke higher last week sharply and decisively, while gold has not followed to the upside as strongly. However, with the gold–silver ratio falling, silver remains the stronger performer at this stage. Because of this relative strength, the move could be wave (3) of an ongoing five-wave bullish impulse, especially given the strong extension higher and the fact that gold is also approaching an all-time high.
Silver may continue to grind higher, and there appears to be room toward the 261.8% Fibonacci extension and the 68–70 zone to complete a lower-degree impulse within wave (3). Currently it can be trading in subwave 3 with room for more gains, just be aware of subwave 4 pullback before a bullish resumption within subwave 5 of (3).

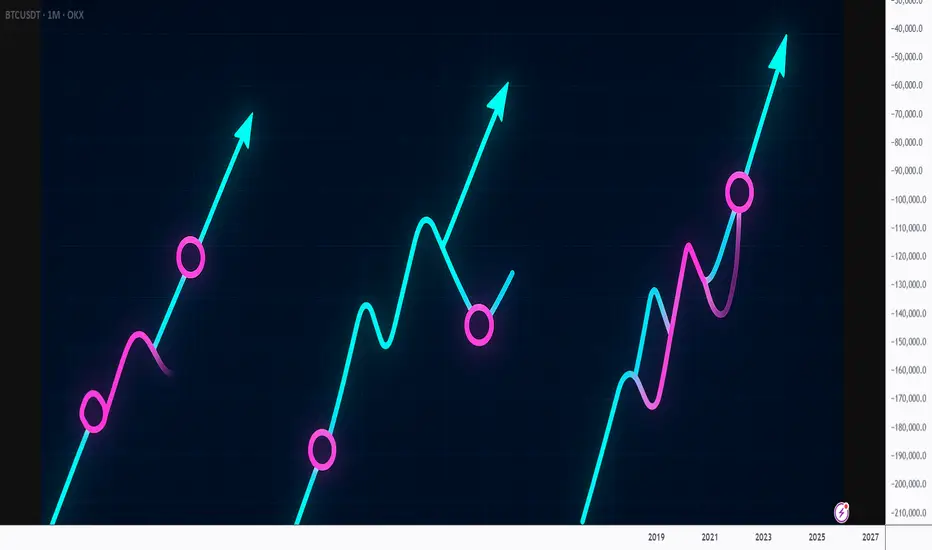
Why Most Traders Misread Trends!!! (Fix It in 10 Seconds)Every trader talks about trends.
Few actually understand how to read them.
Most traders think a trend is defined by:
- a diagonal line
- a moving average
- or a breakout
But the truth is much simpler... and far more powerful:
A trend is defined by the quality of its pullbacks.
📚Here’s the 10-second method professionals use:
1️⃣ Shallow Pullbacks = Strong Trend
When pullbacks barely retrace and reverse quickly,
it means one side is overwhelming the other.
Momentum is healthy.
Continuation is likely.
A shallow pullback tells you:
➡️ “Don’t fade this. Follow it.”
2️⃣ Deep Pullbacks = Weakening Trend
When price retraces deep into the previous leg,
momentum is slowing and imbalance is shrinking.
Buyers are less aggressive.
Sellers are gaining confidence.
A deep pullback tells you:
➡️ “Trend still alive, but the engine is cooling.”
3️⃣ Chaotic Pullbacks = Trend Is Dying
If pullbacks become wide, choppy, overlapping, messy,
the trend is no longer in control.
It’s not a trend anymore.
It’s a negotiation.
A chaotic pullback tells you:
➡️ “Stop trading the trend. Wait for structure.”
📚Final Thought
The market isn’t random ... it’s rhythmic.
And pullbacks are the rhythm.
Once you learn to read that rhythm, you’ll stop fighting trends…
and start flowing with them.
⚠️ Disclaimer: This is not financial advice. Always do your own research and manage risk properly.
📚 Stick to your trading plan regarding entries, risk, and management.
Good luck! 🍀
All Strategies Are Good; If Managed Properly!
~Richard Nasr
SMH Is In Wave 5 Extension as Semiconductors Aim for 400 AreaSMH is the VanEck Semiconductor ETF, giving concentrated exposure to major global semiconductor companies like NVIDIA, TSMC, and Broadcom. It holds about 25 stocks and is known for higher volatility because a few large chipmakers dominate the fund. Investors use SMH to bet on long-term growth in chips, AI, and tech hardware, but it can swing sharply due to the cyclical nature of the semiconductor industry.
VanEck Semiconductor ETF (SMH) is trading within a five-wave bullish impulse from the April lows. Based on Elliott Wave theory, the ETF appears to be in the final Wave 5, which can still extend above the October highs toward the 400 area. Short-term pullbacks are possible, but the broader trend remains bullish. With current risk-on sentiment, semiconductor stocks could continue higher into late 2025 or even early 2026.

USDCAD Is Back To Bearish ModeUSDCAD is turning sharply to the downside after last week’s break out of the upward channel, following strong jobs data from Canada. What we see now is a very powerful and strong decline that looks more like a third wave rather than a wave C away from the highs, especially since the price also breached the lower trend-line support of a potential base channel. This puts us in a bearish mode and suggests more weakness in the days or even weeks ahead, as the recovery from June can finally be ending. Expect more downside until we see five waves down from the 1.4139 level. Trend is now bearish while the market trades below 1.40.

Coca-Cola Is Attacking All-Time HighsCoca-Cola is basically one of the most famous drink brands in the world. It started in the late 1800s in the U.S., and over time it turned into a huge global company. They’re known for their classic Coke, but they also make tons of other drinks—juices, waters, teas, and even energy drinks.
After that gap up, Coca-Cola filled that gap as expected and then turned higher and broke above 71.77 resistance. So the wave structure remains bullish, and we could still see a push to new highs, as wave C — possibly the final leg of an ending diagonal — may target the 76–78 area. So latest retracement toward 68 might have been just temporary setback ideally wave two and bulls are now ready for new highs. We remain bullish as long as price stays above 66.
Highlights:
Trend: Bullish (wave C continuation in w. 5)
Support: 71, 68, 66
Resistance: 74, 78
Note: Bullish above 66, watching for wave C resumption towards new highs.

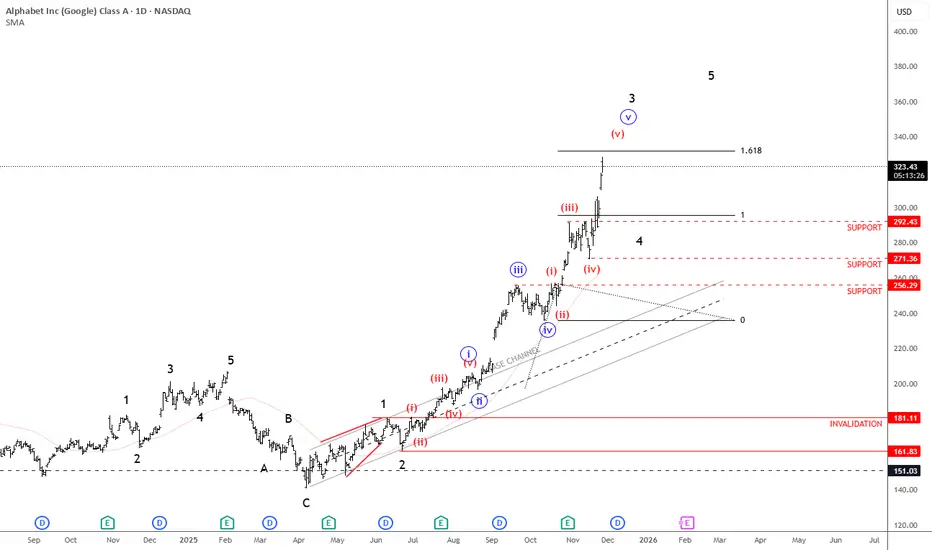
Google Is In Strong Bullish Trend; Unfolding A Five-Wave ImpulseAlphabet (Google) is a huge tech company best known for its search engine, but it also makes things like Android, YouTube, Gmail, and cloud services. Google is pushing hard into AI and cloud computing. They’re rebuilding search with AI, making stronger chips, and growing Google Cloud fast. They’re also investing in long-term tech like self-driving cars and quantum computing.
Google is in a very strong uptrend as expected, but we can now count five waves up within the black wave three cycle from around 160. Ideally, the next pullback would be wave four, stabilizing near the previous fourth-wave area around 292–271. And once or if we see that kind of correction, that's when new buying opportunities could appear, but for now, it’s better to stay cautious since we may already be in the later stages of this cycle.
Highlights:
Trend: Strong uptrend, but nearing late stages of wave three
Potential: Pullback in wave four before continuation higher
Support: 292–271 zone
Invalidation: Below 200
Note: watch for a correction before new long setups
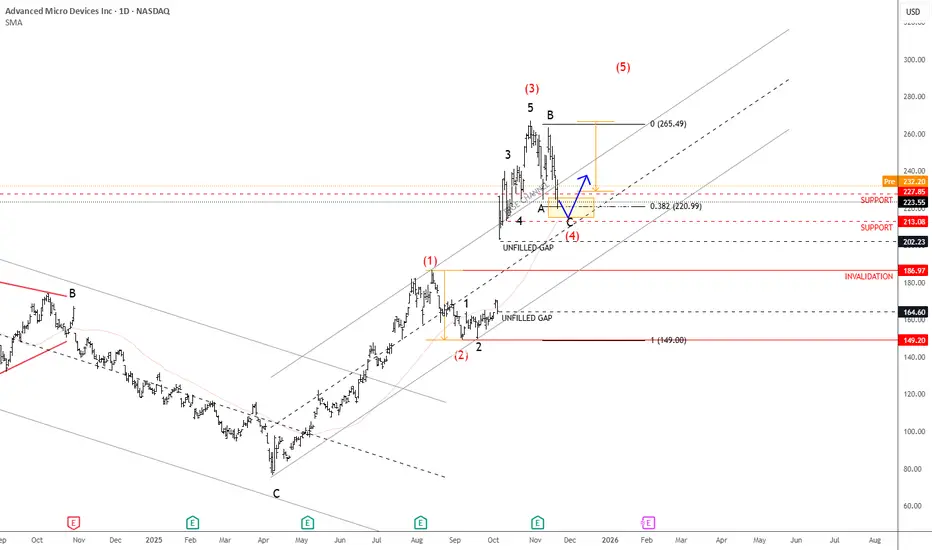
AMD Is Approaching Support, While Finishing A CorrectionAMD is in a very strong uptrend, supported by the impressive rally since early October when it gapped higher on positive AI news. Since then, the stock has gained more than 50%, and this bullish momentum could continue after a retracement, especially considering latest company’s better-than-expected earnings report.
But based in latest price action, we assume that the market is now in a corrective pullback before resuming higher, ideally forming wave four within a broader five-wave sequence. The previous high around 220 could act as the first key support, followed by the 200 area, which also aligns with upper range of unfilled gap. So if we are correct, then later this month or early in December, the market can once again stabilize and turn up for a new high, while the price is above 187 invalidation level.
Highlights:
Trend: Strong uptrend, wave four correction in view
Support: 220 / 200 zone
Invalidation: Below 186
Note: Wait for a pullback to complete before considering new long opportunities
ICP - After a 250% Explosion, What’s Next?🚀ICP has just witnessed a massive parabolic rally , surging by over 250% in just a few days, an incredible move that pushed the price into overextended territory.
📉Now, after such a vertical climb, a healthy correction is unfolding. The area highlighted in red represents a major demand zone, where previous consolidation took place before the explosive breakout.
🏹As price retraces toward this zone, I’ll be looking for potential long opportunities, expecting buyers to step back in and push ICP higher, possibly toward new local highs in the coming weeks.
Could this correction be the perfect reload before the next leg up? 🔥
⚠️ Disclaimer: This is not financial advice. Always do your own research and manage risk properly.
📊All Strategies Are Good; If Managed Properly!
~Richard Nasr

BTCUSD Long: Reversal from the Bottom of the ChannelHello, traders! The price auction for BTCUSD has been controlled by a well-defined descending channel. This bearish structure has guided the price lower, with sellers showing strength by breaking below key levels, including the prior support at 111000. The auction has seen multiple tests of both the channel's supply and demand lines.
Currently, the auction is at a critical inflection point. After recently touching the lower demand line of the channel, a pivot point low has been established, and the price is now attempting to initiate a bullish reversal from these lows, showing early signs of buyer interest.
My scenario for the development of events is a bullish reversal from this channel support. I expect the price may make a brief corrective retest of the recent low to confirm buyer initiative. In my opinion, a successful hold will trigger a rally strong enough to reclaim the broken 111000 level, which is now resistance. The take-profit is therefore set at 112200, targeting the area just above this key structural point. Manage your risk!

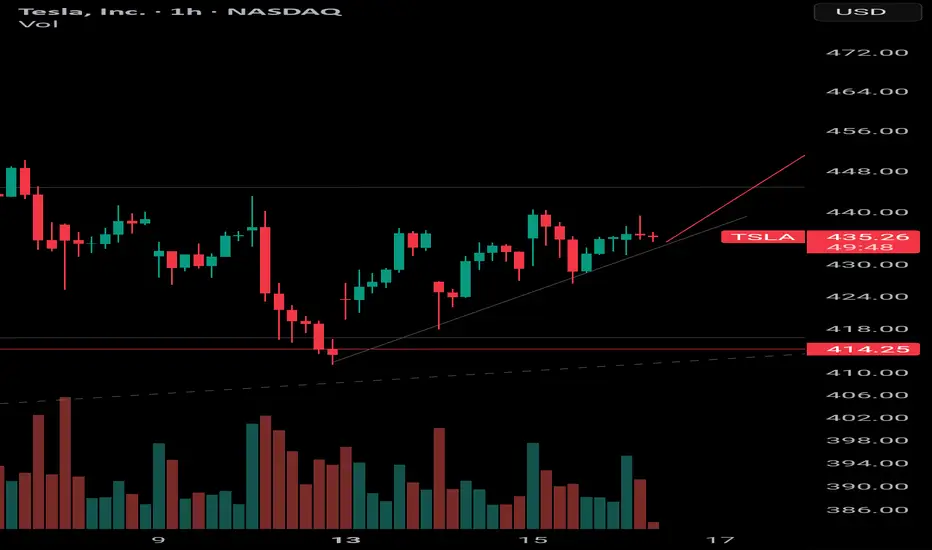
TSLA last point of support before push UPWhere the sellers at? Support is holding well close to a local resistance. Unless buyers are exhausted and wait for a pull back, we're going up from here into selling zone
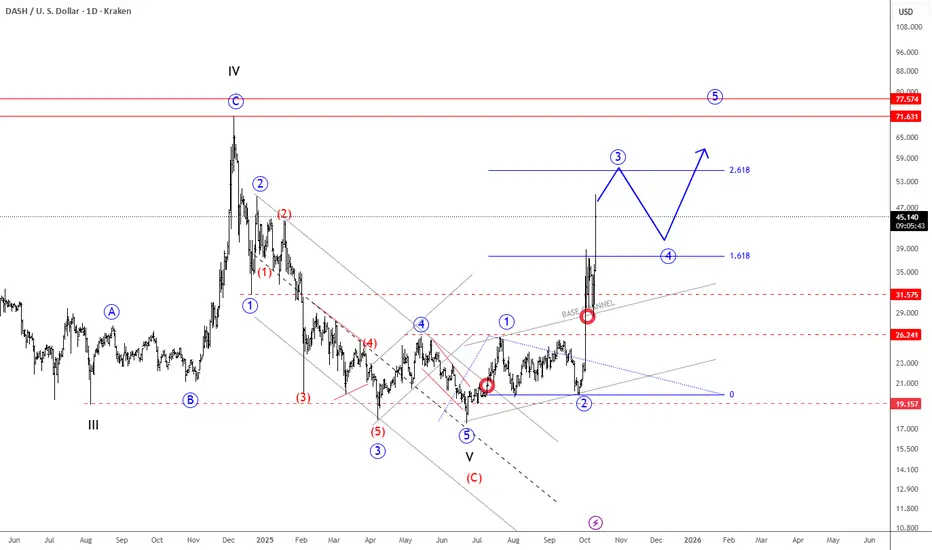
Dash Is Waking Up Strongly As AnticipatedWe talked about the bottom formation on Dash back on August 11, where we mentioned and highlighted that it's recovering from June lows out of the downtrend channel, which suggested that the impulsive decline from the 2024 highs has ended.
Dash is now in a massive rally, waking up strongly, so it's most likely in wave 3 of a five-wave bullish impulse that can extend the price even up to 70 area, we will just have to be aware of wave 4 pullback around 50-55 area. ALTseason can be here. Can other ALTcoins follow soon?
Dash is a cryptocurrency launched in 2014 that focuses on fast, low-cost payments and privacy. It uses a two-tier network with miners and “masternodes” to enable features like InstantSend (near-instant transactions) and PrivateSend (optional privacy). It started as a fork of Bitcoin.
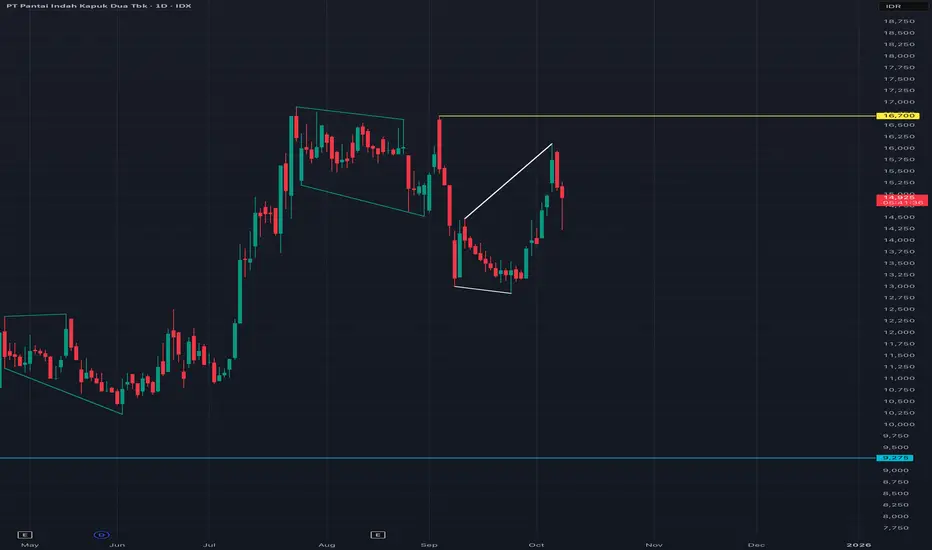
PANI UPDATE I expect this stock to drop below 12,850 without breaking above 16,700 for the moment.
If you plan to buy this stock, in my opinion, it’s a no buy for me at least until 12,850.
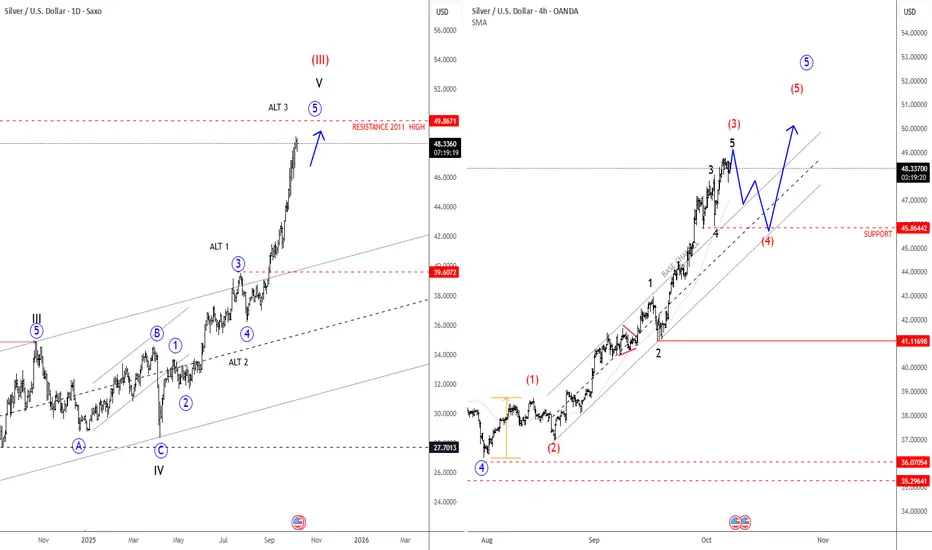
Silver Is Extending Impulsively Higher; All-Time Highs SoonSilver Is Extending Impulsively Higher, which can push the price into all-time highs from a technical point of view and by Elliott wave model.
Silver is on the rise and has been outperforming gold quite a lot over the last week, and it looks like an extended leg up is still in progress; seems like wave three of an extended impulse, therefore more gains are possible after next three-leg retracement. Based on the 4-hour chart, there is a chance that price goes towards 50usd, but there can be some new pullback first. Ideally red wave (4) could stabilize near 45.86. Only a sharp impulse down closer to 43 level will be an indication that higher degree wave four has started.
Higher Time frame charts show an ongoing bull cycle that is now targeting the high from April 2011, which could be the next major level and a potential area for a new retracement, maybe sometime in 2026.
EURUSD Long: Awaiting Bullish Breakout from PennantHello, traders! The price auction for EURUSD has been in a corrective phase, which has taken the form of a large downward pennant. This bullish reversal pattern has been defined by a series of complex lower highs and lower lows, with the price consolidating between the descending supply line and the demand line near the 1.1715 demand level.
Currently, the auction is at a critical inflection point, trading at the apex of this pennant where the supply and demand lines converge. The price has found support near the 1.1715 demand zone, and after a complex series of moves, is now challenging the immediate overhead resistance. This compression of volatility indicates a significant breakout is imminent.
My scenario for the development of events is a bullish resolution of this downward pennant. I expect the price to make an impulsive move and break out above the descending supply line. In my opinion, this breakout will have enough momentum to carry the price up to the major horizontal supply zone. The take-profit is therefore set at the 1.1815 supply level. Manage your risk!

BTCUSD Long: Path to 123000 After BreakoutHello, traders! The prior market structure for BTCUSD saw a significant reversal after the price broke out of a descending channel. This shifted control to buyers and led to a prolonged consolidation phase, with the price auction building a range between the demand zone 2 near 109700 and the supply zone around the 117000 level.
Currently, this long period of balance has been resolved with a decisive breakout. A strong bullish initiative from the demand zone 2 has propelled BTCUSD above the 117000 supply level and out of the consolidation range. The market is now in a clear bullish expansion phase after breaking this key structural point.
My scenario for the development of events is a classic breakout and retest. I expect the price to make a corrective pullback to test the former resistance at the 117000 - 118000 supply zone as new support. In my opinion, a successful bounce from this zone would confirm the breakout's validity and trigger the next impulsive wave higher. The take-profit is therefore set at 123000. Manage your risk.

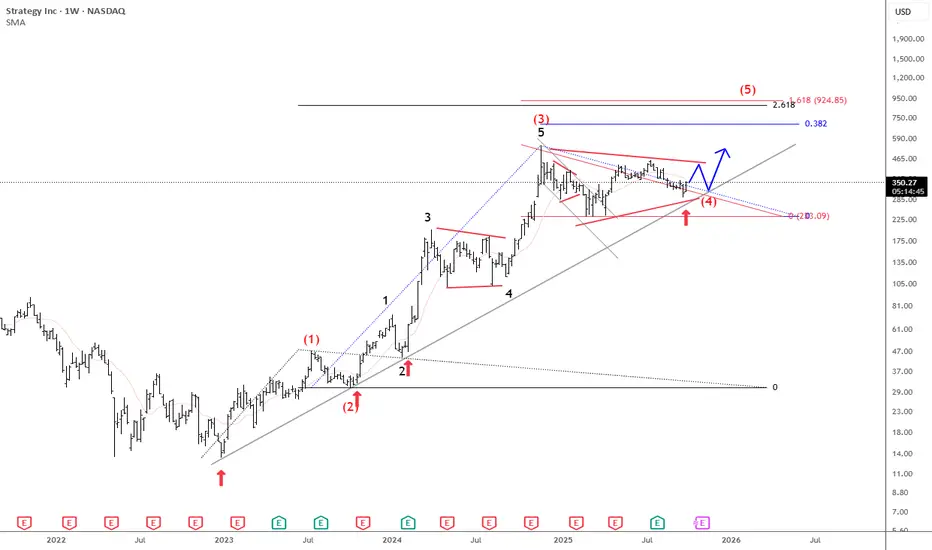
Microstrategy Is Still Pointing Higher For The Final 5th WaveMicrostrategy is a US business intelligence and software company, but it has become best known for its aggressive Bitcoin strategy. Under co-founder Michael Saylor, the company shifted from focusing mainly on software to also using Bitcoin as its primary treasury reserve asset.
Since 2020, MicroStrategy has been steadily buying Bitcoin, often using debt or equity raises to finance purchases. Their strategy is based on the belief that Bitcoin is superior to holding cash, as it can act as a long-term store of value against inflation and currency debasement.
From an Elliott wave perspective, we see Microstrategy nicely holding above trendline connected from the 2022 lows, so it's still unfolding a five-wave bullish impulse. Currently, it's consolidating within a bullish triangle pattern in wave (4), and once it's fully finished, we can expect another and maybe final push to the upside for wave (5) this year before a higher degree correction and bear market shows up next year.
We also want to mention that even Bitcoin can be finishing a 3-year bullish cycle, which can end this year, but there's still some space for more gains along with the Microstrategy to complete the 5th wave of an impulse.
BTCUSD: Awaiting Rejection from the Seller ZoneHello everyone, here is my breakdown of the current Bitcoin setup.
Market Analysis
From a broader perspective, the price action for Bitcoin has been highly volatile, transitioning from a Downward Channel into the current Broadening wedge. This pattern is defined by higher highs and lower lows, indicating an ongoing battle between buyers and sellers with expanding volatility and no clear winner yet.
After failing to break the major Resistance at the 115800 level, the price has rotated down across the entire pattern. Currently, it is trading at a critical location, testing the ascending support line of the wedge, just above the major horizontal Support zone which starts at the 110000 level.
My Scenario & Strategy
My scenario is built around the idea of a potential 'fake breakdown' or a liquidity hunt below the wedge's trendline. I believe the market may make one final push down to test the major horizontal Support at the 110000 level. The key signal I'm watching for is a swift reversal after this potential dip.
Therefore, the strategy is to watch for this reversal. A successful reclaim of the wedge would validate the long scenario. The primary target for the subsequent rally is the 115800 Resistance, which represents a full rotation back to the top of the pattern.
That's the setup I'm tracking. Thank you for your attention, and always manage your risk.

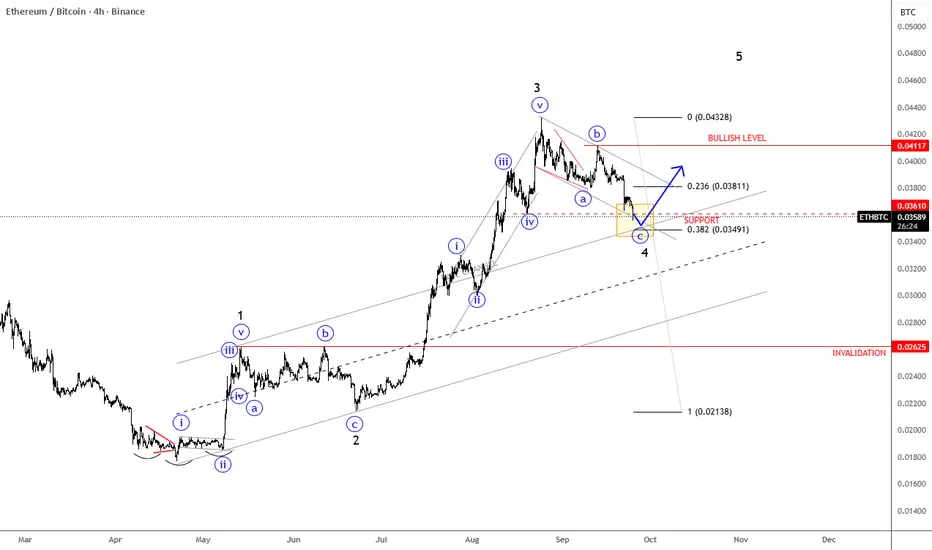
ETHBTC Has A TextBook Bullish PatternETHBTC Has A TextBook Bullish Pattern, as we see an ongoing five-wave bullish impulse by Elliott Wave model
ETHBTC pair is slowed down after a massive extension higher into wave 3, and it's right now testing important 0.035 - 0.034 support zone within an abc correction for wave 4. It's also trading at an important 38,2% Fibonacci retracement and base channel upper line, which can act as a strong support. So soon watch out for a bullish continuation within wave 5, especially if we see a rebound and recovery back above channel resistance line near 0.038 level. Bullish confirmation is above 0.041 level, while the invalidation level is at 0.026.
Gold Pulls Back Within UptrendGold pushed higher to the upper side of the triangle this month, and then also broke above the 3450 area, above both waves D and B swing points. This suggests the contracting range since May is finished and we are now in a new bullish phase, likely the fifth wave on the higher time frame chart. We see metal now in the third subwave of this fifth wave, extending now to 261.8% Fib target. So gold is clearly in an uptrend as long as we trade above 3400, but keep in mind that this higher-degree fifth wave could complete the bull run from the 2023 lows within the next few weeks. But we are not in that final stage yet, looks like more upside after intraday sub wave four pullback., First support is at 3579-3600. So after some slow-down, gold is expected to stay up.

EURUSD - Follow The Bulls Indeed!Hello TradingView Family / Fellow Traders. This is Richard, also known as theSignalyst.
📈EURUSD has been overall bullish trading within the rising channel marked in blue.
This week, EURUSD has been retesting the lower bound of the channel.
Moreover, the orange zone is a strong demand.
🏹 Thus, the highlighted blue circle is a strong area to look for buy setups as it is the intersection of the lower blue trendline and orange demand.
📚 As per my trading style:
As #EURUSD approaches the blue circle zone, I will be looking for trend-following bullish reversal setups (like a double bottom pattern, trendline break , and so on...)
📚 Always follow your trading plan regarding entry, risk management, and trade management.
Good luck!
All Strategies Are Good; If Managed Properly!
~Richard Nasr

BTC - Are You Ready?Hello TradingView Family / Fellow Traders. This is Richard, also known as theSignalyst.
📈BTC has been overall bullish trading within the rising wedge pattern marked in red.
This week, BTC has been retesting the lower bound of the channel.
Moreover, the orange zone is a strong strong and previous all-time high.
🏹 Thus, the highlighted blue circle is a strong area to look for buy setups as it is the intersection of the lower red trendline and previous ATH.
📚 As per my trading style:
As #BTC is around the blue circle zone, I will be looking for trend-following bullish reversal setups (like a double bottom pattern, trendline break , and so on...)
📚 Always follow your trading plan regarding entry, risk management, and trade management.
Good luck!
All Strategies Are Good; If Managed Properly!
~Richard Nasr
