In

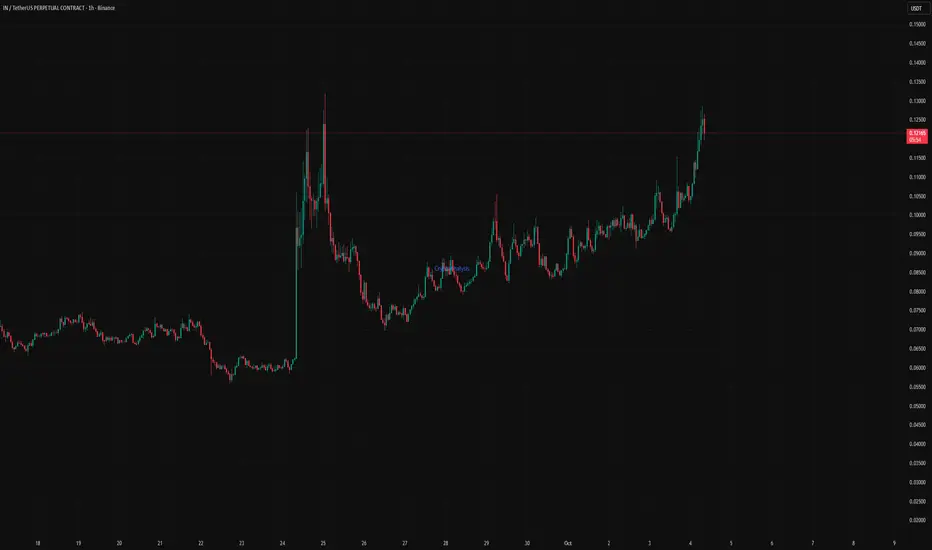
$IN — Agentic DeFi Awakening | Momentum Building for $1
Infinit Labs is gaining strong traction across both technicals and fundamentals — fueled by the rise of Agentic DeFi and upcoming reward distributions.
Key Points:
24H Pump: +75% gain, reaching new all-time highs at $0.1256.
Volume Surge: IN volume up significantly, signaling renewed retail and institutional attention.
Strong Narrative: Backed by Electric Capital, Mirana, and Hashed — Infinit is pioneering AI-powered DeFi Intelligence where agents execute on-chain strategies autonomously.
Catalysts Ahead: Season 2 rewards distribution and a “big announcement” expected within 48h could drive continued upside.
Technical Breakdown
Trend: Bullish continuation confirmed after a breakout from consolidation near $0.09.
EMAs: Price trading well above EMA20 and EMA50 — short-term momentum remains intact.
Volume Profile: Increasing buy-side pressure on dips; consistent higher lows forming.
Targets:
Short-term: $0.18 – $0.22 (Fib extension zone)
Mid-term: $0.35 – $0.50 if momentum and liquidity sustain
Long-term: $1 psychological target, aligning with growing adoption and token utility
Support Levels:
$0.10 (retest zone / former resistance)
$0.085 (EMA50 confluence)
$0.065 (bullish invalidation zone)
Fundamental Context
Utility: Staking IN earns protocol fees, unlocks premium AI-agent features, and grants governance rights.
Ecosystem Growth: “Attention-based tokenomics” will reward users and creators based on real DeFi agent usage — aligning token value with utility and engagement.
Tokenomics: 1B max supply, 49.5% reserved for community and ecosystem incentives over 4 years — fostering long-term sustainability.
Conclusion
IN is transitioning from a stealth narrative to a mainstream Agentic DeFi play. With strong technical momentum, on-chain utility, and a rapidly growing community, the setup remains favorable for continuation toward $0.2+ in the short term and potentially $1 in the coming months if catalysts deliver.
QNT AWAKENED! Elliott Wave Analysis! Zoom into LTFs. Bullish!!4 hour TF shows QNT making good progress towards the 1st wave in teal. As shown in the image included with this post, we have recently finished a wave 4 running triangle correction to the downside. Next, wave 5 should press onwards, if my wave 5 extends beyond $106.82 / the red 1:1 fib ratio of wave 3, it will invalidate this leg of the impulse and i will have to rework the wave count on this 3rd wave in aqua green color.

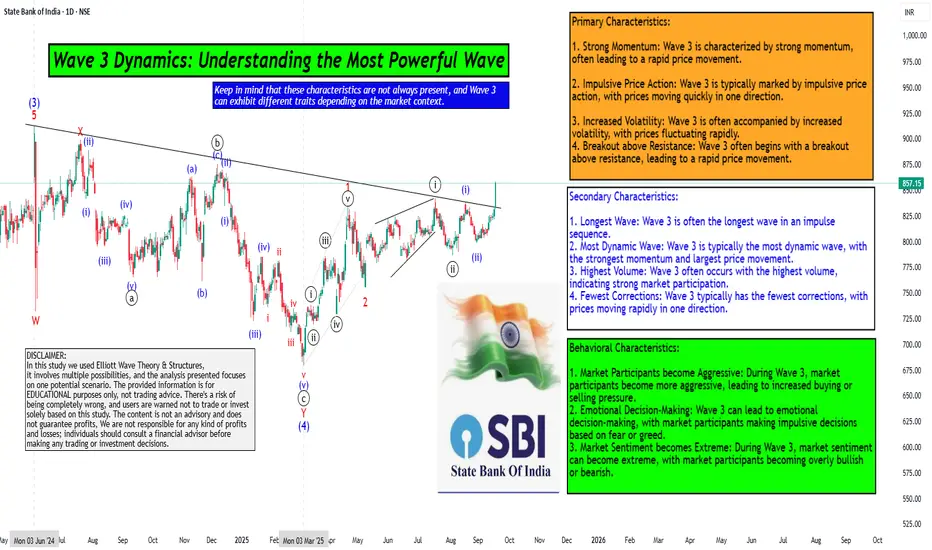
Wave 3 Dynamics: Understanding the Most Powerful WaveHello Friends, Welcome to RK_Chaarts,
For Learning and Practicing chart Analyzing, Today we are trying to Analyse the State Bank of India (SBIN) chart from an Elliott Wave perspective, we can see that the intermediate-degree Wave (3) completed at the June 2024 high. This was followed by a complex correction that ended at the March 2025 low, marking the completion of Wave (4).
We are currently unfolding Wave (5), which will complete the higher-degree Wave ((3)) of Primary degree in black. Within Wave (5), we have five minor-degree subdivisions, which we can see unfolding.
The first minor-degree Wave 1 completed at the 22nd April 2025 high, followed by a Wave 2 correction that ended at the May 9, 2025 low. We are currently in Wave 3, which is a dynamic wave with strong momentum.
Within Wave 3, we have five minute-degree subdivisions, which are unfolding. The first two subdivisions are complete, and we are currently in the third subdivision.
The characteristics of Wave ((iii)) of 3 are evident in the price action, with a strong breakout above the resistance trend line and good intensity of volumes. The Moving Convergence Divergence (MACD) is also positive, and the Relative Strength Index (RSI) is above 60, indicating strong momentum.
The daily Exponential moving averages (50 and 200) are also aligned in favor of the trend. All these parameters support our view, and we can see an inverted head-and-shoulders pattern or a double rounding bottom pattern unfolding.
Overall, the breakout looks promising, and we can expect further upside in SBIN as per Elliott wave theory.
Detailed wave counts on chart
Primary Characteristics:
1. Strong Momentum: Wave 3 is characterized by strong momentum, often leading to a rapid price movement.
2. Impulsive Price Action: Wave 3 is typically marked by impulsive price action, with prices moving quickly in one direction.
3. Increased Volatility: Wave 3 is often accompanied by increased volatility, with prices fluctuating rapidly.
4. Breakout above Resistance: Wave 3 often begins with a breakout above resistance, leading to a rapid price movement.
Secondary Characteristics:
1. Longest Wave: Wave 3 is often the longest wave in an impulse sequence.
2. Most Dynamic Wave: Wave 3 is typically the most dynamic wave, with the strongest momentum and largest price movement.
3. Highest Volume: Wave 3 often occurs with the highest volume, indicating strong market participation.
4. Fewest Corrections: Wave 3 typically has the fewest corrections, with prices moving rapidly in one direction.
Behavioral Characteristics:
1. Market Participants become Aggressive: During Wave 3, market participants become more aggressive, leading to increased buying or selling pressure.
2. Emotional Decision-Making: Wave 3 can lead to emotional decision-making, with market participants making impulsive decisions based on fear or greed.
3. Market Sentiment becomes Extreme: During Wave 3, market sentiment can become extreme, with market participants becoming overly bullish or bearish.
Keep in mind that these characteristics are not always present, and Wave 3 can exhibit different traits depending on the market context.
Here are some snapshots shared below to understand the concept & example
Largest wave among wave 1-3-5
Strong Momentum like 90 degree move, Vertical move, Rapid move & Dynamic move
Breakout with good volumes
Price trading above 50, 100 & 200 Day Exponential Moving Average
RSI Breakout on Daily
RSI Breakout on Weekly
MACD weekly
MACD Daily
Pattern Repeating
I am not Sebi registered analyst. My studies are for educational purpose only.
Please Consult your financial advisor before trading or investing.
I am not responsible for any kinds of your profits and your losses.
Most investors treat trading as a hobby because they have a full-time job doing something else.
However, If you treat trading like a business, it will pay you like a business.
If you treat like a hobby, hobbies don't pay, they cost you...!
Hope this post is helpful to community
Thanks
RK💕
Disclaimer and Risk Warning.
The analysis and discussion provided on in.tradingview.com is intended for educational purposes only and should not be relied upon for trading decisions. RK_Chaarts is not an investment adviser and the information provided here should not be taken as professional investment advice. Before buying or selling any investments, securities, or precious metals, it is recommended that you conduct your own due diligence. RK_Chaarts does not share in your profits and will not take responsibility for any losses you may incur. So Please Consult your financial advisor before trading or investing.
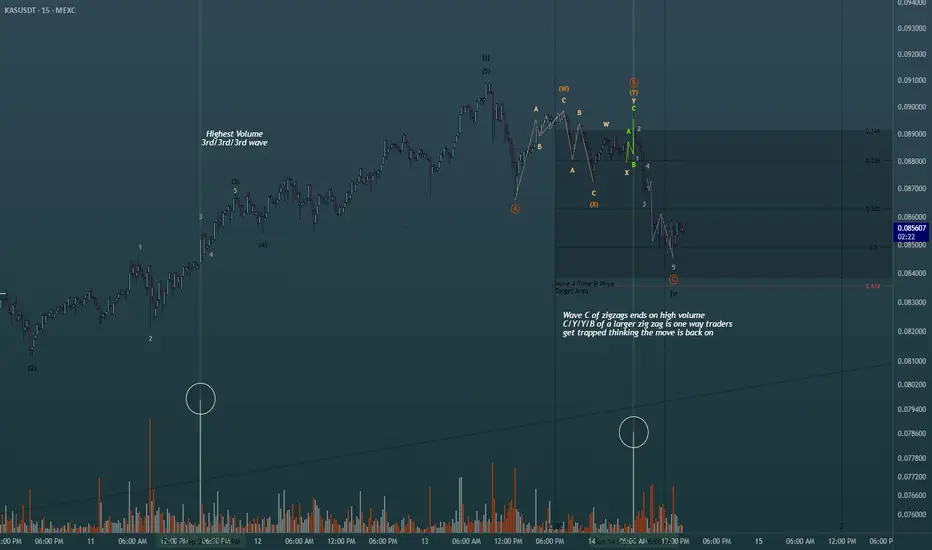
Using simple volume for added confluence in Elliott Wave Theory!Shown on the chart is 2 of the ways you can use the highest volume spikes on the chart to find out where you are in the wave count. Easiest way is to find the highest volume with the steepest slope of trend to label as your third wave. Same concept whether its bearish bars printing or bullish bars. The highest volume shown is actually part of the retracement, albeit in one of the actionary waves (moving with trend), alot of buying happened at the termination of the wave C of the zig zag shown in green. Perfect scenario to rake in buy orders from retail then dump on them to finish out the WXY pattern. This is just 2 of the many scenarios in which you can find help from the volume oscillator to give you a directional bias in Elliott Waves. Happy Trading
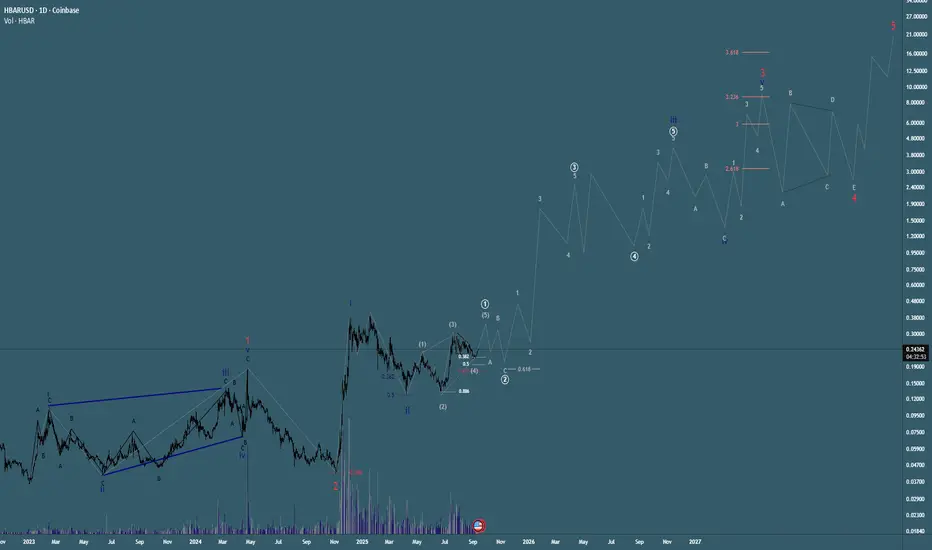
HTF Elliott Wave Count on HBAR! Super Bullish!!Here is the macro bullish outlook on HBAR using the Elliott Wave Theory. Currently we are making progress to the upside to complete the grey wave 5 to finish the leading diagonal in white. Next expect a retracement between .21 (extreme of wave 4) - .18 (.618 of diagonal), it could retrace deeper as is common with a wave 2, although the extreme bullish nature of this impulsive structure makes me think it could be a shallow retracement (38.2% - 50%) before blasting off on everyone looking for their entry to be hit. Exciting times ahead for HBAR i believe. Happy Trading
TAO triple 1,2 impulse to the upside!Super bullish pattern forming in this bullish scenario on TAO. HTF 1,2 in black finished with a deep retracement. Second 1,2 in light blue finished with a retracement to the 0.5. The third micro 1,2 in green finished with a deep retracement to .886 Fib. Since then we chopped around the bottom with our LTF lower degree 1,2 structures to form the base of the extended wave 3 thats coming (or here now!). It could be counted as such that this wave 3 has already formed its own double 1,2 structure which gives more confluence to a massive rally. Several alts are showing similar patterns. Is alt season yet? xD Happy Trading

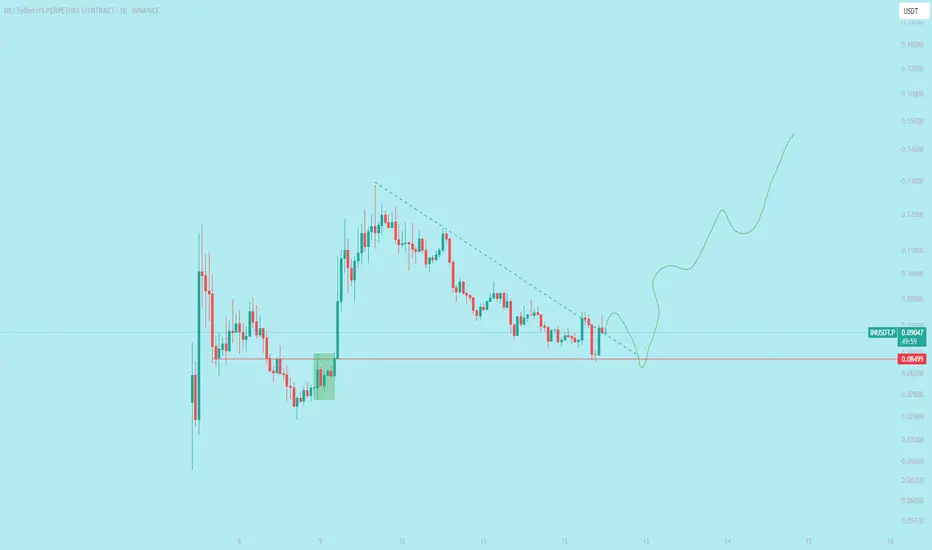
$IN looks ready to run into price discovery mode!BMV:IN looks ready to run into price discovery mode!
Given the recent price action, this could be an optimal moment to take a long position or increase your holdings in $IN. The price has demonstrated a strong rejection at the key order block and demand zone, indicating robust buying interest at these levels. This rejection suggests that the market is defending this critical support area, potentially signaling a bullish reversal or continuation. Technical indicators, such as increased trading volume and positive momentum divergence, further support the case for accumulation. For traders and investors, this zone presents a favorable risk-to-reward opportunity, but it’s essential to monitor market conditions, set appropriate stop-loss levels, and stay updated on broader crypto market trends before making any decisions.
Oberoi reality consolidation #oberoireality is consolidated in daily Timeframe, it looks like triangle pattern, but one needs to be aware has lot of time fake breakout is been seen, good for buying in cash, risk management and patience is important overall bullish for short-term swing.

INJ Long Spot Trade (Support Pullback)Market Context: Since Monday, INJ has shown a strong reversal. A minor pullback to the $18.00 support level could offer a favorable entry for a long position if momentum sustains.
Trade Setup:
Entry: Around $18.00
Take Profit:
First target: $20.50 - $24.00
Second target: $28.00 - $31.00
Stop Loss: Just below $17.00 (daily close)
This trade targets further upward movement while maintaining a manageable risk. #INJ #Crypto

BTCUSD CHART ANALYSIS ON MID & HIGHER TIMEFRAMES!
Firstly, on bitcoin note the bullish Cup & Handle pattern that sure has been in formation for a long time.
On the 1HR & 4HR charts price is getting support on the 200 EMA & 50 EMA respectively. Ideally on the 1HR chart we want the 200 EMA to form underneath the 50 EMA.
Digressing a bit, my feeling is that next week precious metals like Gold will not perform as well as they have this week. Gold in particular is overextended and overbought on the higher timeframe Stochastics. Silver to a lesser extent which will still shine over Gold in the short term. Notwithstanding, the Gold price will go through the roof next month when the USA finally moves on reducing interest rates which is almost a certainty IMO.
I think that the recent blunt price action in Bitcoin as the focus has been on Gold the last couple of weeks, it could be a bullish run for Bitcoin coming up from this Monday. The 1HR chart looks very bullish to me.

XLM STELLAR SET FOR $13.77Stellar is Finally Set
Big Bags Comin'
The Can We Milk the Moon Shot to $13.77 ?

100% TRADERS START WITH DREAM TO GET RICH QUICKHey guys! Do you agree with me?!
It's easy to become charmed by the prospect of making rapid money in the financial markets, yet trading makes almost no one rich – in fact, many individuals lose money*
If you like my graphics, please use Like button 💙💛
* 90% of traders losing money, only 10% get profits. Why?
Here is 3 reasons:
1) Most traders Enter A Trade Too Early
2) Most traders Exit Too Late
3) Most traders Don’t Follow a Risk Management
Here is list my tips to help you to get in profit:


BTC USD Log Scale Overview V.01Just posting this for personal use...
This is not an idea
Trade safely

Happy 618!!!I haven't posted any TA on AMC in a while, It has been peaceful. Can you believe it, tomorrow Feb 10th 23' will be 618 days since ATH's. These low volume days really hurt but the fact that there is nothing backing such a move, just a result of derivatives and degens pissing away premiums.
These are a the current support and resistance i'm tracking. Nothing much just wanted to archive the day.
Hang in there!

Gold Monthly Chart Gold is bullish trend, and I strongly believe next year 2023 will be gold rally again, surely because deflation of the dollar.

Weak Pump to provoke Final Capitulation Wave?Looks like finishing a 3EW here at 3585. Follow-thru selling possible 10/03 but a lift from these LOTY is likely before lower imo.
Final dig down likely coming in October after a weak pump. Still room to drop, RSI above 30 even now. Then Happy Halloween!

How about a new Spike move?! :DAs u can see #FLM is not that co related to the #BTC or #ETH or even USDT dominance...
i have calculated the #PRZ , Fibo ,and set the safe targets...
due to fundamentals n macro economics we r not expecting any harsh or bad news...whales have removed their orders above 23500 on#CEX and we r not expecting any bearish sharp move...
Flm has seccessfully made a spike move before has done a clean pullback on MA s on different time frames... and if u calculate the last spike move , we can confirm our target safely...
last but not leat the divergence on #RSI is bullish...
:D i hope this analys helps u to make some good cash
Godd luck

Sunpharma view for tomorrowSunpharma view for tomorrow
Seeing ascending channel in sunpharma
Breakout will lead to more upside in coming days

Bitcoin Trade Plan: Strongly suggest move to $30,000 in mid termHey guys, here is the Daily timefr ame update on Bitcoin chart. If you like this chart, please use Like button 💙💛
I really like to see bullish outcome for Bitcoin, and to get it as higher as possible this year. But take a look at positions of the Moving averages on the chart: I am using combo of Daily moving averages 500 and 620, this is rarely used MAs, but they works nice on Bitcoin, and shows crucial support bound near $36,000. If we going to see breakout from $36,000 *DMA620 — price will likely to move down to $30,000.
In case breakout from $30,000 it will cause domino effect and price will fall at least down to $22,000 to Weekly Moving Average 200 (WMA200). This is strong support line for Bitcoin all-time history.
In case Bulls can fight for $46,000 + region, we going to see move upwards to Supply zone of $50,000-56,000 where another (3rd) large sell-off can occur. But anyway, this is Plan B for Bitcoin durin Q2 of 2022.
Thanks for your attention.
🙏Pray for Ukraine 💙💛

THIS IS MY CHEAT SHEET DRAWN IN JANUARYSTILL WORKS LIKE MAGIC
TRADING IS EASY
Ok It aint easy but it is possible
I DREW THOSE 2 BOTTOM LINES BEFORE THE PRICE WAS ANYWHERE NEAR THOSE LEVELS
LEVELS TO THIS F*CKN GAME HUH?
Spot buying later this year (10-15k)
BECOME A MILLIONAIRE IN 2025
OR DIE TRYING
@Tradersweekly check this again

BRCHF Hits plane Launch's from new runwayBRCHF on new runway and new glide path. Can you smell what we be cooking can you taste what we be cooking. Locking onto high flying chipmakers to boost their performance. How high they fly depends on sales and marketing. Prepare to launch in 5 4 3 2 1
Do your own research climb on board.
How high will the next climb be?
