Fingerprint Cards the next biometric cycle revolutionWill be multibiometric!
Smartcards (contactless & batteryless, acesscards and payment cards)
Iris (activeIRIS)
Airportsecurity
I o T
In the Cloud
FULL In-Display (touch your thing and it is unlocked)
In the car (nu radionsignal and no more stolen cars)
Outside the car (no more lost keys, look at it or touch it and its open)
At the petrol station
According to the company states will be the company's largest customers!
It´s simple as this!
In

Fingerprint Cards in the next biometric cycle revolutionWill be multibiometric!
Smartcards (touchless & nonbattery solution in access card & payment card)
Iris (AciveIRIS)
Airportsecurity
IoT
In the Cloud
FULL In-Display - touch the device and it is unlocked
In the car (no keys, no radiosignal and no more stolen cars)
Outside the car
In the petrol station (with Visa)
(States will be FPC's largest customers according to the company)
It´s simple as this!

FINGERPRINT CARDS A-B-C wave comparison with NASDAQ 100 A-B-C Everything made easy.
This also show the cycles of many technical innovations.

Long Term S&P500 UpdateOn the weekly chart, it seems as if we are approaching a top that should give us a reasonably substantial correction sometime during 2018. However, on the shorter term, the market it still pointing up, and therefore, is still good to buy on intra-day and intra-week swings to the upside. Historically, the market finds some kind of resistance when approaching round figures such as 2700 and we must be careful when buying around these levels. It would be a bad idea to start looking for bearish trades before the market gives any evidence.
Overall, I am looking for the market to top out in 2018 and retrace but I expect this bull market to continue and by 2019, we should have new highs depending on the duration of Primary 4.

EURUSD: Still more EUR upside in store to 1.1880EURUSD Don't get Spiked in FOMC aftermath
Eur stays under pressure whilst trapped within the parallels -
a break above the upper parallel means trend change back to
positive for EUR - not a spike above the parallel (FOMC) - a
successful break and hold on retest to know that trend is
changing back to positive for EUR.
Update: A fantastic break that we usually only see in the crypto markets. But today the fiat paper currencies caught the fever. EUR is strong above support at 1.1813 and should bounce here at lowest on any consolidation from here before rallying further to 1.1880
*The first section was written for hedge funds ready for the run up and aftermath of FOMC meeting - to simplify and de-noise the event
It's not much use for trading purposes now (TV had an embargo limit running 24 hours ago when it was uploaded and thought it would do it automatically when time limit expired. Wrong. So many limits to getting information out with so many markets to cover. This is not the way.
But the price action here is worth uploading for newer traders: put the parallels on your own chart with a 5 minute chart and see how perfectly EUR comes back to test the parallel from above - one last perfect kiss - before it flies higher through uncontested space above it. The whipsaw you see is normal crap after an FOMC meeting - but out of chaos emerges perfect order. Just takes a little time. You don't need to get caught in the noise. You need to get caught in the aftermath. Sometimes it pays to wait. Hedge funds do. Why not you?

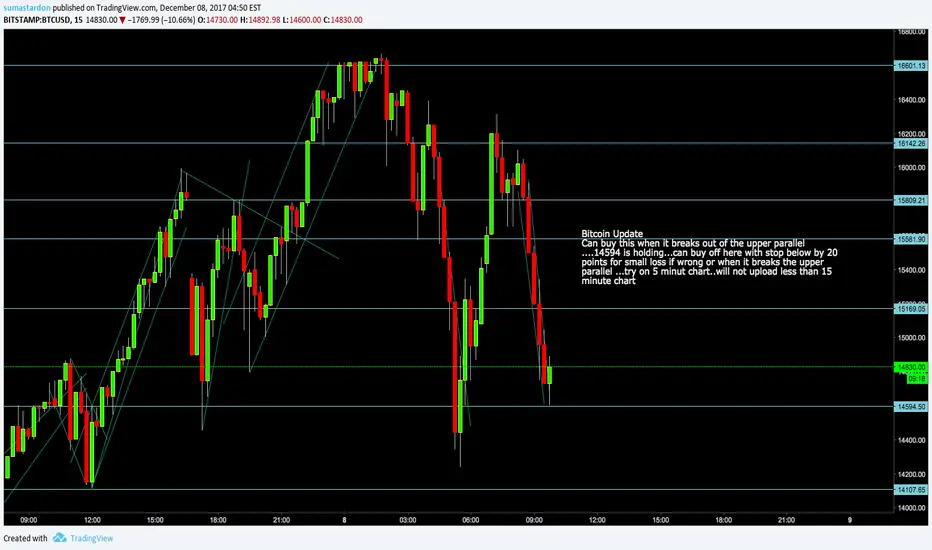
Bitcoin Back in buy zone with stopBitcoin Update
Can buy this when it breaks out of the upper parallel
....14594 is holding...can buy off here with stop below by 20
points for small loss if wrong or when it breaks the upper
parallel ...try on 5 minut chart..will not upload less than 15
minute chart
BTGUSD Back in Buy zone - so long as Bitcoin holds at 11200BTGUSD Back in buy zone at 306-300
Longs should have closed out at the 320 target and now BTG is back
in the buy zone at 306-300 range -it can potentially spike down to the
lower parallel at worst before the rally resumes.
Look to accumulate on weakness with stops placed below the parallel or
can try at 306 with very tight stop at 303 for small loss if wrong from
here - or place orders in market at 300 down to 294 range and they might
get struck. All stops must be either very close if going long here
(it's speccy with 3 downside and 14 upside to 320/upper parallel spike
at highest) or under the parallel if going fishing at lower prices.
So long as Bitcoin holds up at 11200 BTG should be fine too.
Close both if this level is broken, though.

Brent Crude Oil: UKOIL Brent is back in the Buy Zone HereBrent Crude Oil UKOIL Back in the Buy zone
Well the stop on the short from 63.77 never got hit and Brent
duly came off back to the first target at 63.10 for a small 65
pip win - but should have held it longer as it then went on to
test the lower parallel of the flag, bang on 62.17 support at
the same point in time, and has since rallied much more
strongly than anticipated last week, taking Brent right back
up to the old highs at 64.25 before falling away again. (My
bad here for getting way too involved with Alt/USD's last week
and ignoring this complex in the resulting maelstrom)
Anyway, Brent looks OK...Look to buy around current values
down to 63.00 with stops at 62.88 for small loss if wrong
from here. First upside target is the highs at 64.25-64.61
range - (can close out here if you want) but be ready to get
long again on a move above 64.65 for next stage of rally up to
the upper big parallel - close out here if struck and look to
short with stops 30 pips above the parallel on first touch.

BTGUSD Back in the buy zone againBTGUSD
Was banned for 24 hours for posting a text wall yesterday so was unable to update this - which was a pity because that little
continuation pattern running down the parallel when we left it was so well defined, just backing and filling - it needed
a new line over the highs as it ran down the parallel to redefine the perfect trigger for beakout... and when it came
it was excellent quality, big green bear engulfing candle, again, all the things we want to see when trading a breakout.
Not allowed to get to this to update, the trigger here was left at 308 for a move up to 320 minimum...in fact it shot though
here and spiked into the top parallel over a 3 hour period at 339 ...from al ow at 280 to a high at 339 in 6 hours - 20% in 6
hours! Unbelievable what these can do in such a short space of time.
Now it's a buy again on any dips back to 300 - it should rally to 320 minimum
again and more likely to test the same larger parallel at around 330 now
that it hit earlier today before coming off again

BCHUSD: Next Trade set-ups ahead of weekendBCHUSD Next Trade Set-ups ahead of Weekend
This was left as a short backk to 1180-1100 range and with a subsequent low at 1152 it did ok. Obviously the slick trader
will not just close out if the last trade has gone to plan, he (and increasingly frequently, she) will naturally seek to
reverse, with stops underneath and see what comes. If you managed this here you are a star trader in the making (good
traders close out when targets are reached, great ones reverse: who said that?) Anway those who managed the trick
or just got long somewhere around the lows have already seen over 20% gains since yesterday. This market is just
unbelievable. You can compound money faster than ever before in history 24/7. Still find it astounding that the biggest
crap shoot in history is still playing very time we get up, just a button away.
BCH is trading in a little wave from the lows, good green showing, bear engulfing those hours of backing and filling in
minutes...but it's reached close to the limits of its neat term upside potential and meets a crossroads at 1415 where 3 lines
converge, so it's understandable that BCH is shying away from here, being sold off at the natural spot, or just under in fact
so far. If long here it'sthe obvious spot to close out and bank gains and then look to buy from lower and/or add once 1415
is broken to the upside. This will free up the space above and let BCH have a damn good weekend in prospect, opening the
way for a move up to 1516-1539 initially and way above here in medium term, most likely.
In near term whilst BCH continues to track within the impulse wave (loosely defined, so far, early days) it's trend will remain
positive. Buy any dips towards the lower parallel if seen - if not it's strong, isn't it? - so buy again on the break above 1415
with stops 50 below

ETHUSD: Back in the buy zone nowETHUSD
ETHis back in the buy zone - look to buy on dips or put an
order in and go fishing - how deep to lay the bait? 413 with
stops below 409. And then a long shot at 392. Old bull/young
bull - again...to chase or to wait and let the cow come to you
(in this tale of mixed metaphors, it's late) - old bull will sling
an order in at 392 and if it gets hit great and if it doesn't
there are other fish/cows to catch.

BITCOIN: BTCUSD Baxck in Buy zone with stopsBITCOIN: BTCUSD
BITCOIN: BTCUSD
First, if you got long on the eventual break above 10000 the target was 10436 so we should be flat again.
If you bought the double bottom we were hoping for - at 9472 - well done. The real price action on 30 minute chart shows
that 9400 and just under is where the real action is centred but it was imperfect and so difficult to nail down and so if you
got close to it, well done you. But would advise taking profits if still long now...it's probing resistance just under the 10000
line again and is vulnerable to set-backs whilst still under this level. We are looking for entry levels again, ideally from
another test of 9479-9418 range if we see it with stops under 9360. At all costs 9200 must hold up today on all challenges.
Should it fail at any point Bitcoin will turn very negative again, falling back to 8343 and potentially to 7798 at worst.
This cannot happen whilst 9300-9200 holds up - but we need to be prepared in case it does, is all. It shouldn't but it could.
It's Bitcoin, we need to remember this, every day.
So if we don't get another retest of the lows then the blue support line at 9715 will hold price up and it will then try to
break above the dynamics hanging above it...the big number at 10000 is waiting there just above price too, now.
So surmounting all this overhead resistance power will not be straightforward, most likely. It can move down to make
another triple low at 9470-9418 where we buy with stops under 9360 or it can move sideways for a while until it can
escape the power of those overhead dynamics...a day trade for now selling off 9848 line and buying off 9718 line...any
break of 9700 should send it back to the lows/buying zone.
And any break above 10008 - once free of the overhead dynamic resistance lines can be followed.
Bitcoin is still not out of the woods yet. It has to hold up at 9300-9200 all day on all challenges to make that claim stick
from here. We may yet see a good short develop if 9200 gives way Open minds. it's Bitcoin.
Yesterday's Trades reviewed
At some point Bitcoin was going make a Fibo and the classic number in FX markets is 0.618%. Bitcoin's .618% from the low
of this run at 7880 to the high at 11395 is 9218. The low was 9250. Close. We want it become a major currency. Yesterday
it behaved just like one. In addition the trendline supporting Bitcoin for the longer term, and shown earlier was in fact at
9241 at the time of the low, just 9 points below the actual low. This was my mistake and not the chart's - should have
taken more care over the precise line. My bad made worse by Tradingview doing some upgrade which stopped updates for a
while, right in the thick of the action, too.
So spent all day yesterday trying to catch the proverbial falling knife: two buy points smashed through and 140 points
blown, maximum in the maelstrom. There was a small 85 point win along the way but those brave enough to run a wide
stop under the 9300 buy point were rewarded with a fast 700 point plus gain which was sold at 10000 level and just under.
Then we were looking to enter long again on a break above 10000 for a move up to 10436 where profits were to be
taken. This process lasted until 1.30 am (GMT) when finally Bitcoin, after a long 2 hour period messing with heads, found
equilibrium at 10000 and then confidence began return and the upside target was struck for another 430 points profit if
you managed to stay the course with it. Like landing a leaping marlin: Hard work, but ultimately rewarding. So sorrry was
abed when it happened. Missed a great trade there because, being human, have to sleep sometimes. Unlike Bitcoin which
never stops and costs so much in lost opportunities as a result. But it's the only downside Bitcoin has (so long as 9200
holds up from here, at least).

BTGUSD Back in the Buy ZoneBTGUSD Update
This has been a good reliable short once the dynamic support
gave way, as per comment from Monday. Now it's back in the
buy zone so shorts get closed out and reversed long with stops
under 318. Short term target is the falling dynamic around
350 where some day traders will reverse once more for
another short with stops above the dynamic. Pin bars of
rejection off this line shows it's still strong. Price will then
need to break above this line and hold on any retest to trigger
the next long from here.
On the downside major support lies close by at 319.
Any failure to hold here over the coming days would be
extremely bearish for BTG signalling another good shorting
opportunity back to 260 at least, and potentially all the
way back to 156.

BTGUSD steady whilst it holds the trend lineBTGUSD BITCOIN GOLD DOLLAR
The rally today is thin and grindingly dull, but it's steady.
Better to be long with a stop under the little uptrend for the
day than flat. But if at any point the day's supporting line is
broken it will likely force price down 25 to 30 points to
340-330 range where it becomes a buy once more. This thing
has already lost the protection of the bigger trend line which
is now acting as resistance. It's not nearly as good looking as
BCHUSD, but so long as the this new dynamic holds up it
cannot be shorted, only bought, with stops below the parallel
until the pattern changes and tells us to reverse.

BCHUSD Now in the buy ZoneBCHUSD Back in the buy zone now
A little burst of Dollar strength on back of DXY touching near
term support at 92.62 has seen all the alts v USD weaken.
BCH is now coming back into the buy zone, either from 1539 if
touched or alternatively on a break above the dynamic from
the highs.There have been two minor spikes through this line
but both have failed. We want to see some buying power
emerge and green candles as it breaks that dynamic and to
hold up on any retest. It;s getting very close now...be ready
for it. Stops need to stay under the dynamic by 20 points or so
when the break occurs.

DASHUSD: Up 80% + in 13 days:Time to raise stops/watch this flagDASHUSD Update
We were so lucky to get filled at 305 back on November 10th
just an hour or two after the last Dash forecast went live
and trade is still live and going well, so far.
But it could be fading here, it's falling away from the top of
the flag and needs buyers to push higher and trigger the next
addition to longs. If we see this the stop on all positions can
be raised to just under the upper parallel at the point of
break out.
If at any point buyers fade away and sellers are able to drive
price below the lower parallel all longs must be closed out as
quickly as possible to trap in 240 points of gains, up 80% in 13
days so far. Bitcoin eat your heart out.

GOLD: XAUUSD Back in perfect buy zone with low risk GOLD/DOLLAR Switch-Play
Gold has crashed back into the perfect buy-zone again whilst
the dollar DXY is at the very top of it's inverted flag and about
to come off again. Perfect time to go long gold again with
stop under 1274. This looks perfect right now.

Dow Jones - Up 50% in 21 months-How Long Can this keep going On?Dow Jones Industrials Index: DOWI (End of Day) Short Term and Medium term Outlook
At least the markets get the President even if no else seems
to. It's quite impressive that people's pensions are worth 50%
more than 2 years ago in many cases.
How long can it go on?
We can see that the Dow is pushing up against the upper
limits of the two parallels that have controlled this great
impulse wave from the outset. A 50% rise is a natural check-
point, as will be 100% when we get there.
We can also see that each time it tests the upper parallel it
begins to unwind, creating a continuation pattern with a
sideways or downward bias that lasts 2 months or so.
It's already lost the power of the smallest parallels and has
since tracked sideways off the first support at 23237, almost
precisely with the actual low some 7 points higher.
So in the near to medium term it's likely that the Dow will
track down the small parallels shown at the top of the chart,
becoming a perfect environment for day-traders that 'get' the
pattern here...sell off the upper parallel buy back on lower
until one day the the upper parallel is broken to upside (or
downside) and follow that break. But it's more likely to zig-
zag down within the small parallels to fill the gap at 22995
and then bounce powerfully from there. That's a nice little
flag to trade between in the meantime.
So at moment it looks like a lazy continuation pattern back to 22393 before a good rally. This pattern will
change on any successful breach of either of the small parallels - to upside follow on successul break of upper
parallel for another test of the larger parallel above.And if the lower small lower parallel is sucessfully breached
on the downside it will seek support off the blue support line at 22995 - just much quicker than if it tracks within the flag.
The 22995 level is important to the medium term for the Dow.
And we can see that the entire rally between the two blue
supports at 22995 and 22393 is, so far, uncontested. It would
be easy pickings for the bears should 22995 fail at any point.
It would fall quickly 600 points (a fabulous short if we see it
at any point, worth setting an alert for) to 22393 at least and
quite likely to test the lower large parallel before the next
rally could begin in earnest.
But until we see a break of those small parallels that form the
flag top, this space belongs to day-traders.
One other thing, this market is one of the best to trade, making conventional patterns, especially in continuation mode - making it muuch easier to 'read' than, say Nasdaq. Look atthe patterns - they're friendly, familiar. Are Nasdaq's? Find a friend you can trust. That would be the Dow.
Long term, for what it's worth, this index should rally at least 4 X from the February 2106 low and quite easily 6 times. America has never had it so good since Ronald Reagan rode into the sunset. Happy thanksgiving to the USA. Long Term Cycle Analysis:

Bitcoin: BTCUSD Is Bitcoin becoming respectable at last?Bitcoin: BTCUSD Is Bitcoin becoming Respectable?
Bitcoin has been surprisingly quiet around the highs at 8000.
There is no real selling. Any Goldmans whales selling from
8000 have been overpowered but the buying surge out of China hasn't materialised as yet. Instead Bitcoin is moving
sideways, every sale being quickly accumulated but lacking enough buying power to push higher in the near term.
It can carry on moving sideways for a while yet, trying to build a new base at 8000.
Although disappointing so far, Bitcoin is beginning to behave like a regular stock now. The Noah Cross quote from
Chinatown springs to mind: " 'Course I'm respectable. I'm old. Politicians, ugly buildings and whores all get respectable - if
they last long enough." Maybe we can add Bitcoin to that list soon, too. Bitcoin respectable? It's certainly beginning to act
that way. So it's quiet, verging on respectable, moving sideways in a holding pattern as every sale is quickly absorbed.
Those big bear attacks from 8000 have failed. They've realised they can't fight this thing, not at 8000 anyway. It should
continue to grind higher again to 8087 and then move sideways to try to build a base at 8000...it needs to turn this
level from near term resistance into support over the coming hours because if it can't find the power to do this it will drift
away to 7900 and look for support here and down to 7855.
There's more support building just below here, at 7798 (minor) and then major support at 7717-7700 freezer lid
levels. Whilst above here Bitcoin belongs to the bulls. But it needs to clamber above 8000 and hold to avoid drifting
sideways from here for a while longer. Day traders can use the the little dynamic supporting this move as an exit for
longs but it's tricky with such wide spreads - (wouldn't it be good if Goldmans actually did start a Bitcoin desk, forcing
others to join too, bringing competition to spreads and driving down margins and making day-trading so much easier ?
Any comments?) - if it loses the dynamic it will fall back to 7900 but the spread makes it untradeable.
So, Bitcoin is positive above 8000 and neutral whilst under this level, the likely pivot point of the day, and whilst unable
to regain that level and hold up there it's likely to trade sideways/down using 7900 down to 7855 as support before
grinding higher once more. Stay long, stay patient.
A break and hold above 8000 is the price action bulls need now. Now that would be respectable.


Gold: XAUUSD Back in the buy zone for next swing higherGOLD : XAUUSD Update
Continues to grind higher on a weakening dollar. It's a nice
trade if you get the push and pull here...loads of bears who
haven't looked at the dollar (muppets), they are the guys
going to keep buying us dinner. The dollar is just completing a
another failed counter-rally and this has pulled gold back into
the buy zone again around the blue line on the chart for the
next push higher to 1290. Then let it go again but only to
1284 and then buy again for bear-mangling surge to 1305
where it becomes a big short again with stop 3 points higher.

Shakeshack: SHAK Clearly Basing out in a range SHAKESHACK:SHAK
Nice range trading, suitable for trend followers, evidently.
Still looks OK to buy, using the lower parallel as a dynamic
exit point if broken at any point before it reaches a very
obvious upside target at 39.30 -39.62 range - at which point
positions can be reversed with stops above 40.
And then if that short is taken out it will show that it's long
basing activity since IPO is at coming to an end...it should
start a staggered ascent back towards the highs, the next
near term trade being from 40.04 to 41.87.
More as move develops...

EURUSD: Continuation pattern prior to next decline still in playEURUSD It's plain to see that this this pattern is still one of continuation and eventually EUR should break the lower
parallel containing this week's minor corrective up-wave and come much lower still...so am not looking to buy dips, more
to sell the EUR rallies back to the upper parallel, looking for much lower values once the parallel gives way...
Whilst being written another pin bar of heavy selling has been created, only confirming that this is a sucker's rally. This time
we need to keep away from the EUR cookie jar. It's pretty much empty. The last hour of trading only adds weight to that
outlook. Look to sell from the smaller upper parallel if retested and then to sell again once the lower parallel is
broken on the downside. EUR has much further to fall over the coming weeks, as per recent comments.
