✅US30 WILL KEEP FALLING|SHORT🔥
✅US30 is trading in a
Downtrend and the index
Made a good pullback
From the resistance cluster
So I am bearish biased
And I think that we will see
A further move down
After some local correction
To the upside on the
Smaller timeframes
SHORT🔥
✅Like and subscribe to never miss a new idea!✅
Index-dow

S&P500 - Short Idea-I see a double top has formed
-I see a bearish divergence signal on my proprietary indicator.
-I see a crazy market
-I see a HUGE level of $4000 _
-I see a Doji on the uptrend (significant)
I used a wide stop and it's a 2:1 RR, 1% risk.

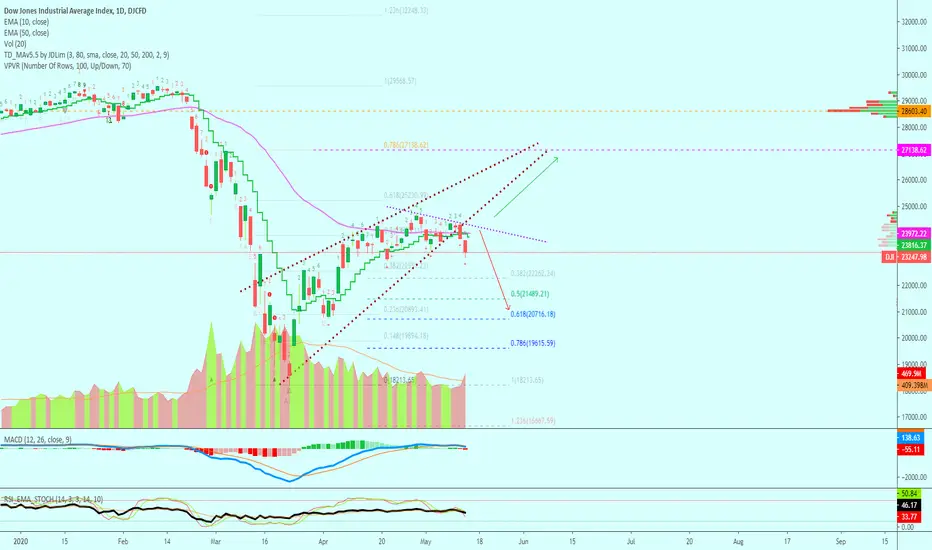
Dow Jones Looking Bearish (Chart Signals)The Dow Jones Industrial Average Index (DJI) is also looking bearish.
This chart tends to look very similar, almost the same, as the SPX (S&P 500 Index).
The signals coming from this chart goes as follow:
1) Decreasing trading volume.
2) Lower high.
3) Bounce completed.
4) Drop below EMA10 and EMA50.
5) MACD bearish cross while trending lower.
6) RSI broke below 50 while trending lower.
All these are pointing to a drop.
If prices move back up the purple line, there can be another attempt at resistance before more low.
Right now the chart is looking bearish and value can continue to drop.
S&P 500 Index Falling Wedge Broken, Time To Drop? (Chart Signals)
Thanks a lot for reading.
Namaste.
DOW JONES INDEX | DroppingThe situation is not good for us economy and the excuse for printing more dollars will not be sustainable.

Apple Inc (AAPL) Starts Crashing Hard, Can Go Lower!Apple Inc (AAPL) the biggest read candlestick in a while to break below EMA10. Multiple signals are telling that this isn't the end... AAPL can go lower, let's take a look.
We have increasing red volume.
We are looking at a MACD that is trending lower.
The RSI moved below 50 (at 47.19 right now) and is clearly looking down.
EMA50 (202.60) worked as support and held Apple's drop... Normally we see a bounce here before additional bearish action. I am getting the feeling that there won't be any bounce, it will be pure blood on Monday... But this is just a guess.
If EMA50 can't hold (breaks), then expect for AAPL to move even lower and test 198.01 or EMA100.
How far low can it go?
For starter, I believe it can easily test EMA300 at 189.40. Depending on how things develop, a bounce can happen here or it can continue going lower.
My guess, you ask?
Apple Inc. will have a really hard time and can continue much lower. It might test the last low (blue dashed line).
Chart
Magenta lines = resistance.
Blue lines = support.
Thanks a lot for reading.
Share your thoughts in the comments section below.
Namaste.

Dow Jones Industrial Can Go Lower (Trading Below EMA300)The DJI is now trading below EMA300, the last time this happened it had a further drop of 11.34%, if the same or a similar scenario repeats (as each time EMA300 is broken on the daily a strong drop follows, with the exceptions when there is an immediate bounce back above EMA300) we can see the Dow Jones go much lower and reach about 22180 or about 1.5% higher.
Previous analysis:
Thanks a lot for reading.
Namaste.

Bullish Butterfly in DIABullish butterfly pattern completed today. PTs are the 38.2% and the 61.8% of A-D leg (in the chart).

Will the DJIA hit the year end target?Investing.com provides average year end forecast of 18050 for the DJIA based on the April poll of 25 analysts. How realistic is this target? The DJIA is currently trading at about 19x trailing earnings while the historical average of 15 is about 20% lower at around 14000 range. The market lows of last August and January of 15500 range was around 16.6 x trailing earnings. Analysed from a valuation perspective the DJIA seems overpriced. Technically the chart appears to be range bound with more downside than upside.
Another perspective is to consider the lower bond yields around the globe. The stock indexes could warrant a higher than average PE ratio. The earnings yield is the inverse of PE or the Earnings to Price ratio. Barrons reports DJIA earnings of $935 which gives us a current earnings yield of 5.29% and the DIA currently yields 2.48%. Both earnings and dividend yield offers a solid premium over the 10 year treasury yield which is currently around 1.61%. The DJIA is estimated to grow earnings over the next 3-5 years at an annual rate of about 7.8%
Whats your thoughts? I look forward to your comments and ideas.


SELL S&P500 1871 STOP 1880 TARGET 1840/1830Trading near the channel and the neckline resistance, Short term trend is down and any recovery may face sell offs again. Yes there is short covering or fresh buying seen from lower levels but I feel with smaller stops this trade is worth taking a chance.
Regards,
SP
CapitalTA
