# GBPUSD Technical Analysis & Forecast# GBPUSD Technical Analysis & Forecast
**Asset**: GBP/USD
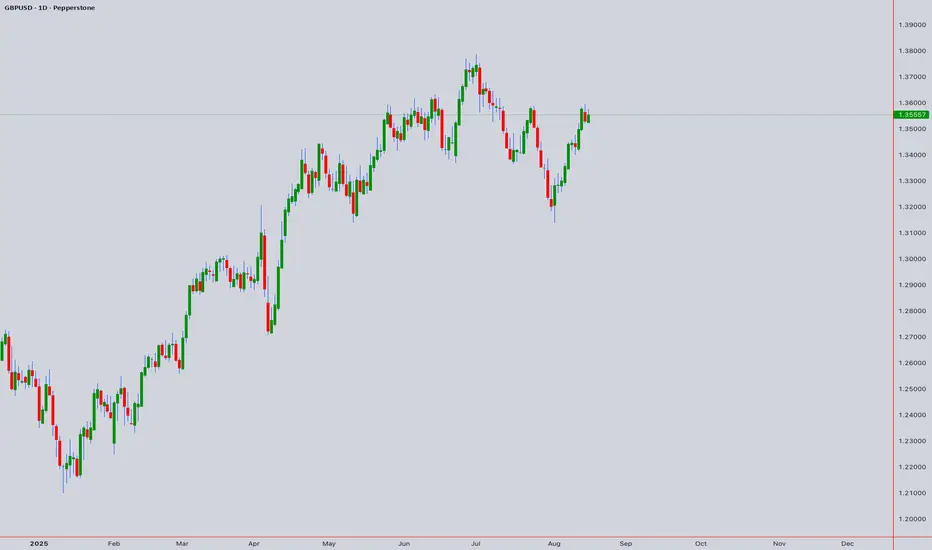
**Reference Price**: 1.35557 (August 16th, 2025, 12:50 AM UTC+4)
**Analysis Date**: August 17, 2025
## Executive Summary
GBPUSD is positioned at a critical juncture with multiple technical confluences suggesting potential bullish continuation. The pair has shown resilience above key support levels and appears to be forming a corrective structure that may lead to higher targets.
---
## 1. ELLIOTT WAVE ANALYSIS
### Primary Count (Daily/Weekly)
- **Current Position**: Gray Wave 3 (Impulsive phase)
- **Sub-wave**: Orange Wave 5 active
- **Structure**: Bullish trend in impulsive mode
- **Completion Status**: Gray Wave 2 likely complete
### Intraday Perspective (1H-4H)
- **Pattern**: Double Three (WXY) corrective structure
- **Key Level**: Equal Legs zone providing support
- **Blue Box Area**: Critical support confluence around 1.3480-1.3520
- **Invalidation**: Break below red X connector invalidates bullish count
### Wave Targets
- **Immediate**: 1.3650-1.3700 (completion of current sub-wave)
- **Extended**: 1.3850-1.4000 (major resistance confluence)
---
## 2. HARMONIC ANALYSIS
### Active Patterns
**ABCD Pattern**
- **Status**: Potential completion near current levels
- **D Point**: Expected around 1.3480-1.3520
- **Target**: 1.3680-1.3750 (127.2% extension)
**Gartley Pattern (4H)**
- **Completion**: 78.6% retracement area
- **Support Zone**: 1.3500-1.3550
- **Targets**: 1.3650 (38.2%), 1.3720 (61.8%)
**Butterfly Formation (Daily)**
- **Status**: Monitoring for completion
- **Critical Zone**: 1.3480-1.3520
- **Upside Potential**: 1.3780-1.3850
---
## 3. WYCKOFF ANALYSIS
### Current Phase Assessment
**Phase**: Accumulation (Phase C - Spring Test)
- **Characteristics**: Testing of support with reduced volume
- **Smart Money Activity**: Accumulation at lower levels
- **Market Maker Position**: Building long positions
### Key Wyckoff Levels
- **Support**: 1.3480 (Last Point of Support - LPS)
- **Resistance**: 1.3650 (Automatic Rally - AR)
- **Breakout Target**: 1.3750+ (Sign of Strength - SOS)
---
## 4. W.D. GANN ANALYSIS
### Square of 9 Analysis
**Current Position**: 1.35557
- **Next Resistance**: 1.3650 (144° angle)
- **Major Resistance**: 1.3780 (180° angle)
- **Support**: 1.3480 (90° angle from previous high)
### Time Cycles
**Active Cycles**:
- 30-day cycle: Peak expected around August 25-28, 2025
- 90-day cycle: Major turn window September 15-20, 2025
### Gann Angles (Daily Chart)
- **1x1 Angle**: Rising from 1.3200 low
- **2x1 Angle**: Critical support at 1.3450
- **1x2 Angle**: Resistance at 1.3720
### Price Forecasting
**Natural Resistance Levels** (Square of 9):
- 1.3610 (Minor)
- 1.3680 (Moderate)
- 1.3750 (Strong)
- 1.3850 (Major)
---
## 5. ICHIMOKU KINKO HYO
### Cloud Analysis (Daily)
- **Cloud Status**: Bullish (green cloud)
- **Price Position**: Above cloud indicating uptrend
- **Tenkan-sen**: 1.3520 (dynamic support)
- **Kijun-sen**: 1.3480 (key support)
### Key Levels
- **Cloud Top**: 1.3450
- **Cloud Bottom**: 1.3380
- **Senkou Span B**: 1.3420 (26-period ahead)
### Signals
- **Bullish Crossover**: Tenkan above Kijun
- **Future Cloud**: Remains bullish through September
---
## 6. JAPANESE CANDLESTICK ANALYSIS
### Recent Patterns (4H/Daily)
**Doji Star Formation**:
- **Location**: Near 1.3550 resistance
- **Implication**: Indecision, potential reversal higher
- **Confirmation**: Needed above 1.3580
**Hammer Pattern (Daily)**:
- **Formation**: August 15th low
- **Support**: 1.3480 area
- **Bullish Bias**: If sustained above 1.3520
### Pattern Projections
- **Engulfing Pattern**: Target 1.3650-1.3680
- **Three White Soldiers**: Potential if break above 1.3580
---
## 7. TECHNICAL INDICATORS ANALYSIS
### RSI (Relative Strength Index)
**Multi-Timeframe RSI Status**:
- **Daily**: 52.3 (Neutral with upward bias)
- **4H**: 48.7 (Slightly oversold, bullish divergence forming)
- **1H**: 45.2 (Oversold, bounce expected)
### Bollinger Bands
- **Daily**: Price at lower band, squeeze formation
- **4H**: Expansion phase beginning
- **Target**: Upper band at 1.3720-1.3750
### VWAP (Volume Weighted Average Price)
- **Daily VWAP**: 1.3530 (current resistance)
- **Weekly VWAP**: 1.3480 (key support)
- **Deviation Bands**: +1σ at 1.3620, +2σ at 1.3680
---
## 8. MOVING AVERAGES CONFLUENCE
### Simple Moving Averages (SMA)
- **20 SMA**: 1.3540 (immediate resistance)
- **50 SMA**: 1.3520 (dynamic support)
- **200 SMA**: 1.3450 (major support)
### Exponential Moving Averages (EMA)
- **12 EMA**: 1.3565 (short-term resistance)
- **26 EMA**: 1.3535 (key pivot)
- **100 EMA**: 1.3480 (confluence support)
### Weighted Moving Average (WMA)
- **21 WMA**: 1.3550 (resistance to break)
- **Golden Cross**: Potential if 50 WMA crosses above 200 WMA
---
## 9. MULTI-TIMEFRAME ANALYSIS
### 5-Minute Chart
- **Trend**: Sideways consolidation
- **Support**: 1.3540
- **Resistance**: 1.3570
- **Breakout Direction**: Awaiting catalyst
### 15-Minute Chart
- **Pattern**: Ascending triangle
- **Breakout Target**: 1.3590-1.3610
- **Volume**: Decreasing on pullbacks (bullish)
### 30-Minute Chart
- **Trend**: Bullish flag formation
- **Measured Move**: 1.3650 target
- **Key Level**: 1.3555 support
### 1-Hour Chart
- **Elliott Wave**: Corrective Wave 4 completion
- **Harmonic**: ABCD pattern near D point
- **Target**: 1.3620-1.3650
### 4-Hour Chart
- **Primary Trend**: Bullish
- **Correction**: Complex WXY structure
- **Upside Target**: 1.3750-1.3800
### Daily Chart
- **Major Trend**: Upward
- **Pattern**: Bull flag continuation
- **Long-term Target**: 1.3850-1.4000
### Weekly Chart
- **Structure**: Impulsive Wave 3
- **Support**: 1.3400-1.3450
- **Resistance**: 1.3800-1.3850
### Monthly Chart
- **Trend**: Long-term bullish
- **Key Resistance**: 1.4000-1.4200
- **Major Support**: 1.3200-1.3300
---
## 10. TRADING STRATEGY & OUTLOOK
### Intraday Strategy (5M-1H)
**Setup**: Buy dips approach
- **Entry Zone**: 1.3540-1.3560
- **Stop Loss**: 1.3520
- **Target 1**: 1.3590
- **Target 2**: 1.3620
### Swing Trading Strategy (4H-Daily)
**Setup**: Breakout continuation
- **Entry**: Above 1.3580 (confirmed breakout)
- **Stop Loss**: 1.3510
- **Target 1**: 1.3680
- **Target 2**: 1.3750
- **Target 3**: 1.3850
### Position Trading (Weekly-Monthly)
**Setup**: Long-term bullish bias
- **Accumulation Zone**: 1.3480-1.3550
- **Major Target**: 1.3850-1.4000
- **Risk Management**: Trail stops below key moving averages
---
## 11. KEY LEVELS SUMMARY
### Critical Support Levels
1. **1.3520** - Immediate support (Tenkan-sen, 50 SMA)
2. **1.3480** - Major support (Blue Box, Kijun-sen, 100 EMA)
3. **1.3450** - Cloud top, 200 SMA confluence
4. **1.3400** - Weekly support level
### Critical Resistance Levels
1. **1.3580** - Immediate resistance (breakout level)
2. **1.3620** - VWAP +1σ, harmonic target
3. **1.3680** - Bollinger upper band, Gann resistance
4. **1.3750** - Major confluence resistance
5. **1.3850** - Elliott Wave target, monthly resistance
---
## 12. RISK ASSESSMENT
### Bullish Scenario (Probability: 65%)
- **Catalyst**: Break above 1.3580
- **Target**: 1.3750-1.3850
- **Timeline**: 2-3 weeks
### Bearish Scenario (Probability: 35%)
- **Invalidation**: Break below 1.3480
- **Target**: 1.3400-1.3350
- **Timeline**: 1-2 weeks
### Key Events to Watch
1. Central bank communications
2. Economic data releases
3. Risk sentiment shifts
4. Technical breakout confirmations
---
## CONCLUSION
GBPUSD is positioned for potential upside continuation based on multiple technical confluence factors. The Elliott Wave analysis suggests we're in an impulsive upward structure, while harmonic patterns indicate completion of corrective phases. Gann analysis supports higher targets with favorable time cycles approaching.
**Recommended Bias**: Cautiously Bullish
**Primary Strategy**: Buy dips near support, target higher levels
**Risk Management**: Strict stops below key support confluences
The technical picture favors patient bulls who can capitalize on the current consolidation phase for potential moves toward 1.3750-1.3850 in the coming weeks.
For those interested in further developing their trading skills based on these types of analyses, consider exploring the mentoring program offered by Shunya dot Trade.(world wide web shunya dot trade)
I welcome your feedback on this analysis, as it will inform and enhance my future work.
Regards,
Shunya.Trade
world wide web shunya dot trade
⚠️ Disclaimer: This post is educational content and does not constitute investment advice, financial advice, or trading recommendations. The views expressed here are based on technical analysis and are shared solely for informational purposes. The stock market is subject to risks, including capital loss, and readers should exercise due diligence before investing. We do not take responsibility for decisions made based on this content. Consult a certified financial advisor for personalized guidance.
Interday
Long PositionKing W. Harbmayg's Journal Entry #19
Interday Position
Long—
according to my criteria, price has successfully:
a. triggered the third coordinate
b. tapped into the demand zone
c. printed rejection structure
all for a trade of 1:10 RR.
2. Performance: (1 out of 5)
Confidence— 5
Discipline— 4
Communication— 5

GBPNZD Short (Daily)Lower high formed, and a nice rejection from the 36ema. We are headed back down to the daily lows, 2R trade, given an intraday SL.
TRADING IDEA -- NOT AN INVESTMENT OPPORTUNITY

BTCUSD-- Daily timeframe analysis Here's a view from a step back using 24H candles to take a
look at where we can anticipate price moving throughout
the month of August. Be sure to check out some more
upclose ideas on the same pair in the related ideas section
below. Like comment, and subscribe!
Happy trading, and good luck!

NZDCAD Longs - 9R Trade potentialPotential longs off the current demand zone to the next supply - as part of a higher low. NZDCAD broke bear trend structure on the last bull swing, and we are now holding at support looking to make a move higher potentially. Could be great R at this level!
TRADING IDEA --- NOT AN INVESTMENT OPPORTUNITY!

AUDCAD Longs (H4)AUDCAD Longs - nice little bull flag formation and break out - some choppiness along the way and a major resistance to contend with. I think resistance is easily achievable, and we are still bullish on daily so we could pump much further!

CADJPY Longs (Daily)Longs on CADJPY (Similar to CHFJPY)
TRADING IDEA --- NOT AN INVESTMENT OPPORTUNITY!

EURAUD Long (Daily)Double hold and retest of demand zone, with a strong, volatile bounce - suggesting continued momentum to Supply zone.
TRADING IDEA --- NOT AN INVESTMENT OPPORTUNITY - TRADE AT YOUR OWN RISK!

Tesla Shorts --- Bearish Projection (WEEKLY)Divergent peaks formed (RSI) + sharp/volatile rejection at supply upon retest. I am expecting a 50%ish retracement to the upside (as shown) before the plummeting happens.
TRADING IDEA --- NOT AN INVESTMENT OPPORTUNITY!

UK100 -- Bullish ProjectionsI like the Idea of bullish action on daily chart. We also have some nice bullish action on H4 which supports this. Let's see how it plays out!
Trading Idea --- NOT AN INVESTMENT OPPORTUNITY!

XAUUSD Shorts (Daily)Waiting for a retracement to retest the wedge and then continue breaking downwards. I don't see price making a big bounce to the upside because I think the deal has been sealed for gold to the demand (support zone) - and then we may see a reaction with gold longs.
Before we can have the shorts, I think it's very reasonable to expect a modest/smallish bullish retracement (daily chart wise) and then a continued dump by what a very dominant $$$.
TRADING IDEA --- NOT AN INVESTMENT OPPORTUNITY!

USDZAR - Daily Flag Break -- Bullish PotentialUSDZAR showing some nice bullish momentum with a flag break, expecting to hit big zone of supply up at the peaks. Expecting a pullback/intraday retracement along the way before we rocket upwards.
TRADING IDEA --- NOT AN INVESTMENT OPPORTUNITY!

Apple - Loading Up The LongsNice buying potential on Apple - H4/Daily charts. Nice mini H4/Daily bear flag forming, hold at demand and bounce upwards - breaking the flag. V. simple trade. Same Principle as the buys on USDZAR.

XAGUSD Daily SHORTSFlat drop - massive sharp rejection from supply. Big Drop incoming !
TRADING Idea --- NOT AN INVESTMENT OPPORTUNITY ! Trade at your own risk.

USDCAD Longs (Daily Charts)USDCAD Longs Idea --- Higher low hold at demand in an upward channel + sharp bounce from demand above 200ema (closing).
Looking to continue the momentum to the upside until the supply zone!
Pretty self explanatory and simple, just like it should be.
Trading Idea --- NOT AN INVESTMENT OPPORTUNITY --- TRADE AT YOUR OWN RISK!

GBPNZD-- Interday TF analysis for last week in JanuaryGBPNZD analysis— Currently overextended at 2.618.. This is sort of falling knife scenario, where im hoping price uptrend is now over. Its better to wait for more confirmation if you are not in the trade yet. Check out the link to related idea for my previous posting of GBPNZD for a more up close look at at the analysis at current price.This post is a follow up to further demonstrate why im currently bearish on this pair.

GBPNZD-- playing a single level in a larger fibo placementLooking at price action on some of the different hourly timeframes + high probability retracement opportunity on GBPNZD. Be sure to check out the next post i make which is my analysis of this same pair from a higher timeframe perspective. Show some love and leave a comment telling what you think about my analysis.

EURAUD Short (Daily)300 pip move potential here... Strong bear action by AUD, looking good for volume - retested supply at lower high with a violent rejection, indicating that selling pressure is much stronger, and there is an interest to sweep the liquidity pools at the bottom.
TRADING IDEA --- NOT AN INVESTMENT OPPORTUNITY!

USDJPY Short Sell (H4)Great little trade here... Let's see what happens. A lot of bear momentum.
TRADING IDEA --- NOT AN INVESTMENT OPPORTUNITY --- TRADE AT YOUR OWN RISK!

ETHUSD (Ethereum) LongShooting for the 5k mark and beyond potentially on Ethereum longs (daily chart)!.
Trading Idea -- Not an investment opportunity!

EURUSD Daily Short Shorts x2All mentioned in the chart, do have a look.
Trading Idea --- Not an investment opportunity!

US30 WEEKLY LongBreaking through a key area of 35k, which has already been achieved on the daily clearly. We are bouncing off the bottom bollinger band in ascending band channel and NO bearish divergence. The small pullback bounced off of the lower boll band, with an upward channel. Given the volume of US30 and the strength of candlesticks, I think we can break through easily and target 36K+ onwards. From there you will have to take incremental profit. First stop is 36k and onwards can be trailed or decided by you. If one was to trade this, i'd recommend placing most of the risk (use no more than 2% risk) on 1:1 RR and leave the rest of this position on trail stop loss etc.
TRADING IDEA --- NOT A TRADING OPPORTUNITY --- TRADE AT YOUR OWN RISK!

USDCAD Short (Daily)Sharp bounce off t resistance area/boll band, looking to target next area of demand, possibly going down lower. First marked rectangle would be TP1, other marked rectangle TP2. Small remainder of the position can be kept as a trailing stop loss, too.
TRADING IDEA , NOT AN INVESTMENT OPPORTUNITY. TRADE AT YOUR OWN RISK!
