KPITKPIT Fut broke out of rounding bottom as well as inverse head & shoulder pattern on daily charts with above average volume & decrease in OI (-6%) suggesting shortcovering.
Risk:Reward = 1:3
Could b bought with mentioned stoploss & target.
Inverse Head and Shoulders

$BTC ATH Sept 23 - 30th - Global Liquidity UpdateThis total global liquidity indicator alongside DXY (inverted) has pretty much nailed BTC tops and bottoms to the day this cycle.
Pretty wild how accurate this is.
Notice the inverted head & shoulders pattern and neckline break for confirmation.

Grab - Inverse H&S + Weekly LevelsUnusually high volume on this name lately.
I've been watching this name since it was in the $4-5 range and believe it will be a $10 stock in the near future.
The wider market may be just beginning to notice the opportunity here.
Personally, I've been in $5 2027 leaps and will be seeing where the stock takes me.
For now, my immediate target is $7(see inverse head and shoulders).
Additionally, with the heightened options volume, this could become a great name to trade intraday.

MET | Life Insurance Industry Will Rise | LONGMetLife, Inc. engages in providing insurance and financial services to individual and institutional customers. It operates through the following segments: Group Benefits, Retirement and Income Solutions (RIS), Asia, MetLife Holdings, and Corporate and Other. The Group Benefits segment offers group life insurance products with renewable term policies. The RIS segment contains short and long-duration products, including capital market products, pension risk transfers, structured settlements, and other benefit funding products. The Asia segment focuses on Japan only and offers traditional life insurance, and accident and health products. The MetLife Holdings segment includes traditional and universal life products. The Corporate and Other segment refers to surplus investment portfolios used to fund capital and liquidity needs. The company was founded on March 24, 1868 and is headquartered in New York, NY.

BX |Bullish Momentum Incoming | LONGBlackstone, Inc. engages in the provision of investment and fund management services. It operates through the following segments: Real Estate, Private Equity, Credit and Insurance, and Hedge Fund Solutions. The Real Estate segment includes management of opportunistic real estate funds, Core+ real estate funds, high-yield real estate debt funds, and liquid real estate debt funds. The Private Equity segment consists of management of flagship corporate private equity funds, sector and geographically focused corporate private equity funds, core private equity funds, an opportunistic investment platform, a secondary fund of funds business, infrastructure-focused funds, a life sciences investment platform, a growth equity investment platform, a multi-asset investment program for eligible high net worth investors and a capital markets services business. The Credit and Insurance segment refers to Blackstone Credit, which is organized into two overarching strategies: private credit which includes mezzanine direct lending funds, private placement strategies, stressed and distressed strategies and energy strategies, and liquid credit which consists of CLOs, closed-ended funds, open ended funds and separately managed accounts. In addition, the segment includes an insurer-focused platform, an asset-based finance platform, and publicly traded master limited partnership investment platform. The Hedge Fund Solutions segment focuses on Blackstone Alternative Asset Management, which manages a broad range of commingled and customized hedge fund of fund solutions. It also includes a GP Stakes business and investment platforms that invest directly, as well as investment platforms that seed new hedge fund businesses and create alternative solutions through daily liquidity products. The company was founded by Stephen Allen Schwarzman in 1985 and is headquartered in New York, NY.

$BTC The Correction is OVER - IH&S 50DMA Reclaim.VERY CONFIDENT THE ₿ITCOIN CORRECTION IS OVER 🤓
In other words, WE'VE SEEN THE SEPTEMBER LOWS.
Inverse Head & Shoulders reversal pattern closed outside of the Danger Zone and CRYPTOCAP:BTC reclaimed the 50DMA.

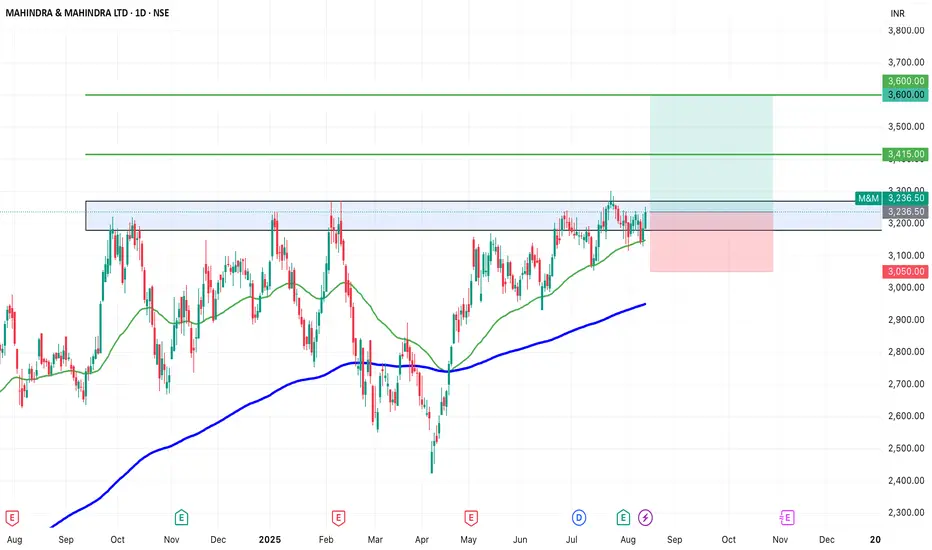
SWING IDEA - M&MM&M , a leading Indian automotive and farm equipment manufacturer, is showing signs of a potential breakout, making it a strong swing trading candidate.
Reasons are listed below :
3,200 resistance tested multiple times — now weakened and primed for a breakout
VCP (Volatility Contraction Pattern) forming, indicating accumulation
Trading above 50 & 200 EMA, confirming long-term trend strength
Inverse Head & Shoulders pattern forming, a bullish reversal setup
Target : 3415 // 3600
Stoploss : daily close below 3050
DISCLAIMER -
Decisions to buy, sell, hold or trade in securities, commodities and other investments involve risk and are best made based on the advice of qualified financial professionals. Any trading in securities or other investments involves a risk of substantial losses. The practice of "Day Trading" involves particularly high risks and can cause you to lose substantial sums of money. Before undertaking any trading program, you should consult a qualified financial professional. Please consider carefully whether such trading is suitable for you in light of your financial condition and ability to bear financial risks. Under no circumstances shall we be liable for any loss or damage you or anyone else incurs as a result of any trading or investment activity that you or anyone else engages in based on any information or material you receive through TradingView or our services.
@visionary.growth.insights
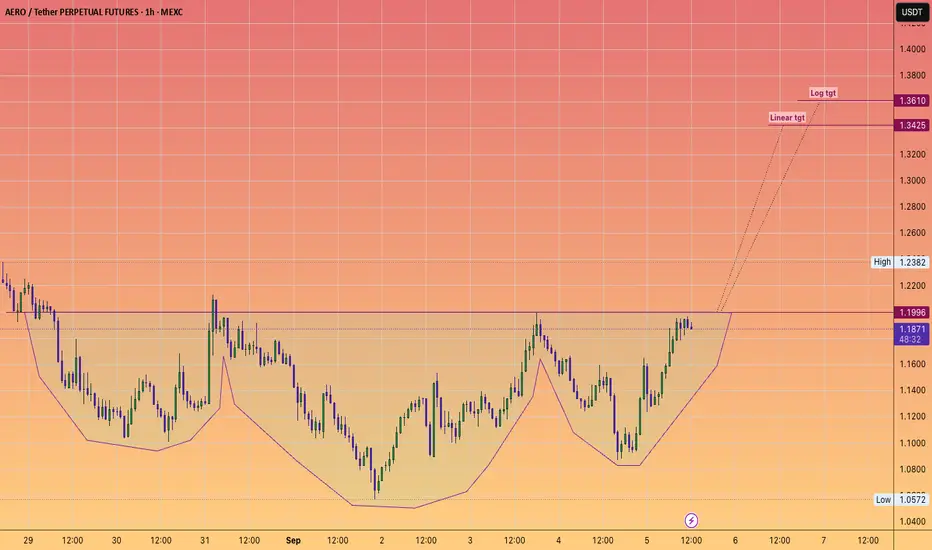
*Trade IDEA* Aerodrome to $1.35Inverse Head and shoulder is about to trigger.
"How Aerodrome Integrates with Coinbase Base DEX
Aerodrome's integration with Coinbase's Base DEX has been a game-changer for the platform. This partnership has created a powerful liquidity flywheel, with approximately 44% of Base's GDP flowing through Aerodrome. Post-integration, the platform experienced a 30% surge in trading volume and achieved a staggering $1.17 billion in 24-hour trading volume. By leveraging Coinbase's robust infrastructure, Aerodrome has simplified DeFi access for millions of users, making it a pivotal player in the Base ecosystem.
AERO Tokenomics: A Model for Sustainable Growth
Aerodrome's native token, AERO, is at the heart of its ecosystem. The platform employs dynamic emission throttling, reducing token inflation to just 1%. This ensures sustainable yields for liquidity providers while preserving the token's long-term value. Additionally, Aerodrome's ve(3,3)-style governance model incentivizes liquidity growth and rewards token holders with swap fees and staking benefits. This innovative approach has driven an 80% price surge for AERO, solidifying its appeal among investors and users alike."
ATG forming a right shoulder?Is this a textbook H&S pattern being formed? 643 is break out/neck line and 912 is the target. Looks like it and reversal will be know by September to November 2025.
This is not a solicitation to trade in ATG shares.

$APE Inverse Head and Shoulders Bottom SpottedFINALLY a sign of relief from this god forsaken ApeCoin chart 🦧
Beautiful inverse head & shoulders reversal pattern could very well mark the end of the pain.
GETTEX:APE needs to break and hold above .79 to confirm the setup for a ~4x move.
Then the road to 40x+ begins 🍌

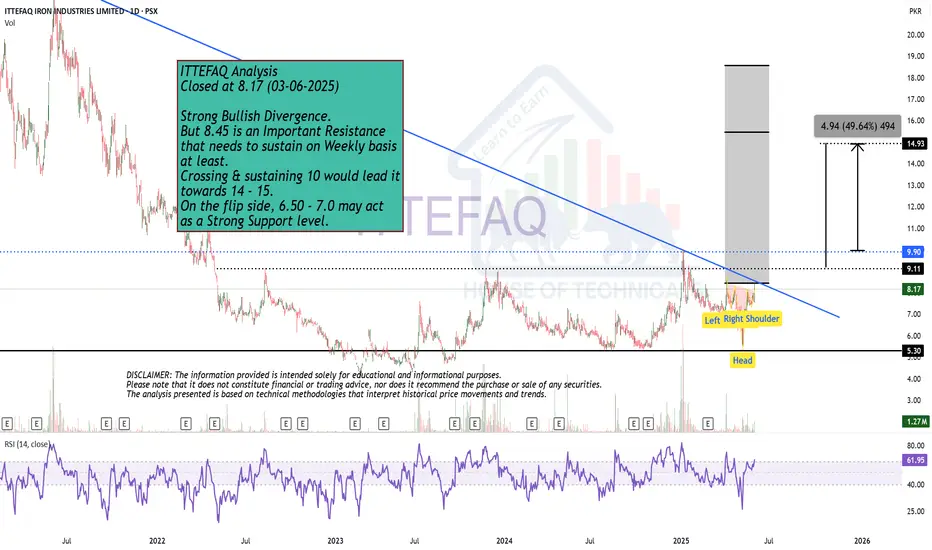
Strong Bullish Divergence. Closed at 8.17 (03-06-2025)
Strong Bullish Divergence.
But 8.45 is an Important Resistance
that needs to sustain on Weekly basis
at least.
Crossing & sustaining 10 would lead it
towards 14 - 15.
On the flip side, 6.50 - 7.0 may act
as a Strong Support level.
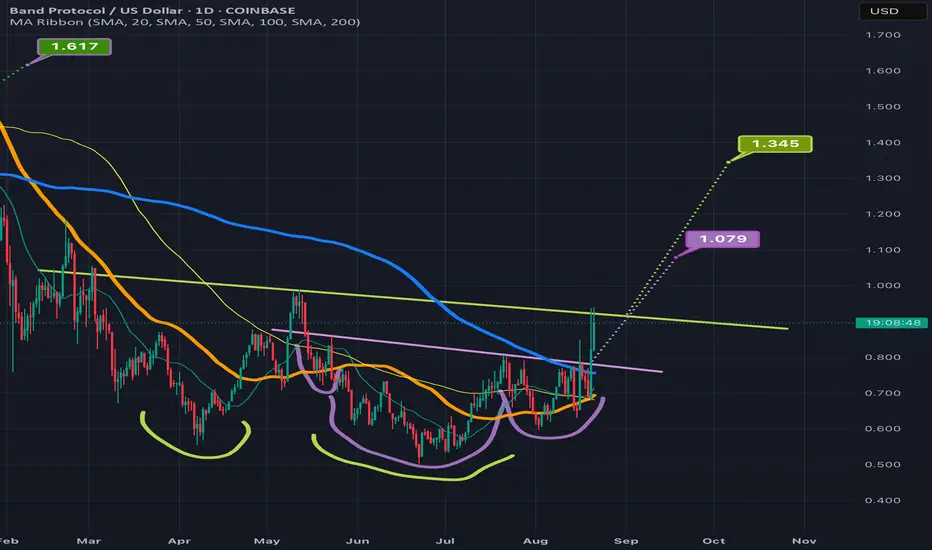
BANDUSD attempting an invh&s + double bottom breakoutBAND has been available for a significant iscount lately but the sale may be ending soon as it is now attempting both an inverse head & shoulders breakout, as well as sending wicks above the neckline of a slightly larger double bottom pattern. The double bottom pattern is in chartreuse and the inverse head and shoulder pattern is in lilac. We can also see BAND looks lke it’s about to have a golden cros in the next week or 2 which should increase probability to confirm the breakout of these two bullish patterns as it will add bullish confluence as long as prce action isn’t two high above the 30&200 moving averages at the time of the golden cross *not financial advice*
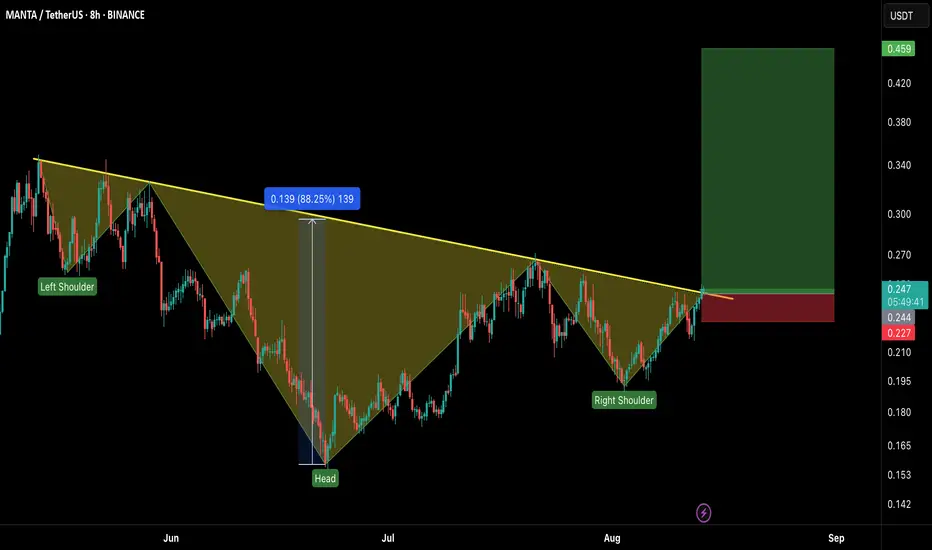
MANTA/USDT – Long Setup Alert!MANTA has just broken out of a massive Inverse Head & Shoulders pattern on the 8H chart — a bullish reversal signal that could ignite a strong upside rally. 📈
Setup Details:
Entry: CMP – 0.248
Stop Loss: 0.227 (below neckline retest)
Targets:
🎯 TP1: 0.34
🎯 TP2: 0.42
🎯 TP3: 0.459
Leverage: 5x max (adjust risk accordingly)
Why This Setup?
✅ Clean breakout above neckline after weeks of consolidation
✅ Volume supporting the breakout
✅ Pattern target aligns with strong resistance zone above
⚠️ Risk Management: Stick to your SL. A failed retest can trap late entries.
Bulls are in control — let’s ride this momentum!
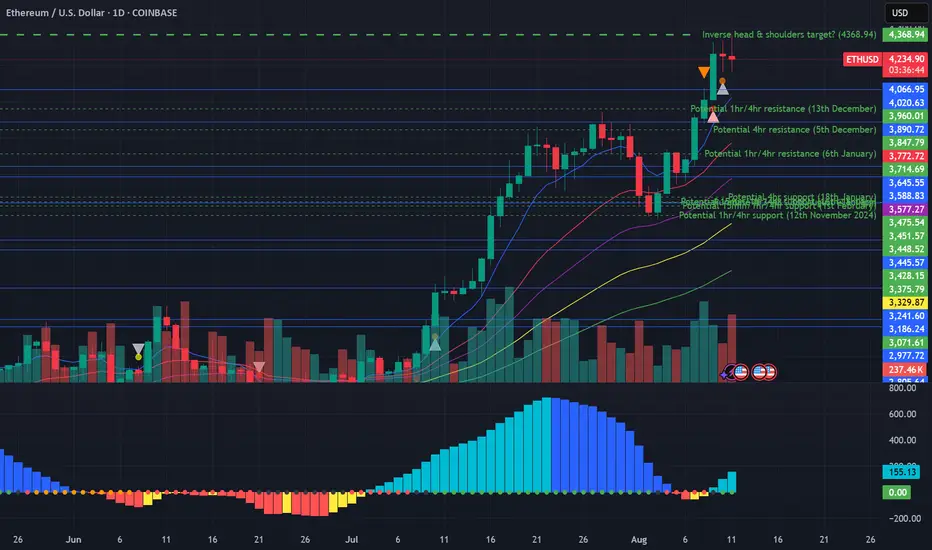
Potential inverse head and shoulders target reached on EthereumWell... nearly reached at this stage anyway. In a similar vein to Dow Theory (in which you would normally expect that the Dow Jones Industrial Average would rise alongside the Dow Jones Transportation Index, the Nasdaq Composite, the SP500 and the Russell 2000 indices), let's suppose you would expect that Ethereum would rise alongside Bitcoin and the other altcoins.
Let's face it, Ethereum has had a great run recently, but what has Bitcoin been doing over the past month in particular? Literally nothing. Zero, zilch, nada... But why am I bringing up caution at this stage whilst everyone is so bullish about Ethereum? Let's scale out. If you look very far out to earlier this year, there was spike down in February for Ethereum (which formed a 'left shoulder' downward), and further retracement in share price downward to the ultimate low in April two months later to form the 'inverted head', followed by upward movement to form the inverted 'right shoulder' in late June.
This allows us to draw a 'neckline' at around about the 2880 level. Extending calculations from this neckline to the inverted head provides a range of approximately 1400, but when utilising exact numbers utilising charting software, and extending this range upwards from the neckline northwards provides a potential target of 4,368.94, which is fairly close to where we've been recently (the high of 4,333.13 about 2 hours ago at the time of writing).
Unless Bitcoin can get itself moving, as well as Ethereum turn around with respect to the one hourly momentum, tread cautiously and consider the possibility that the target may be reached of this head and shoulders target for Ethereum (thus, neutral bias at this stage, with potential to turn bearish).
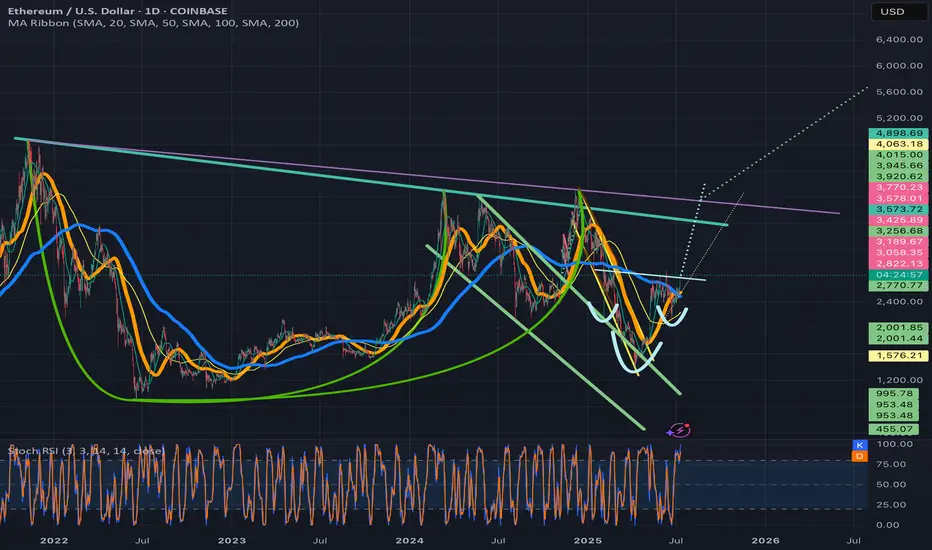
Ethusd breaking above invh&sEthusd chart has a similar set upas the total2 chart, a cup and handle that is breaking up from a smaller inverse head and shoulders that will complete the handle to the cup. Ethereum actually has two potential to trendlines for its cup and handle and I wouldn’t be surprised if both are valid. The breakout target for the inverse head and shoulder pattern will take price action above both of them. Once we solidify the top trendline for the cup and handle patterns as support the breakout target for it is $7161. Ethereum just recently had a golden cross on the daily which adds to the probability the inverse head and shoulder pattern breakout will be validated. *not financial advice*
Is oil price heading back up? Watching a potential inverse head and shoulders forming on the 30-minute chart for Oil.
🔹 Risk/Reward: 2.7
🔹 Entry: 63.290
🔹 Stop Loss: 63.043
🔹 Take Profit 1 (50%): 63.93
🔹 Take Profit 2 (50%): 64.21
A couple of key factors still need to align before I pull the trigger:
• One will confirm around 14:45 SAST (GMT+2)
• Looking for lower volume on the right shoulder compared to the left
What do you think? Is oil ready to push higher?
Drop your thoughts or how you trade inverse head and shoulders below! 👇

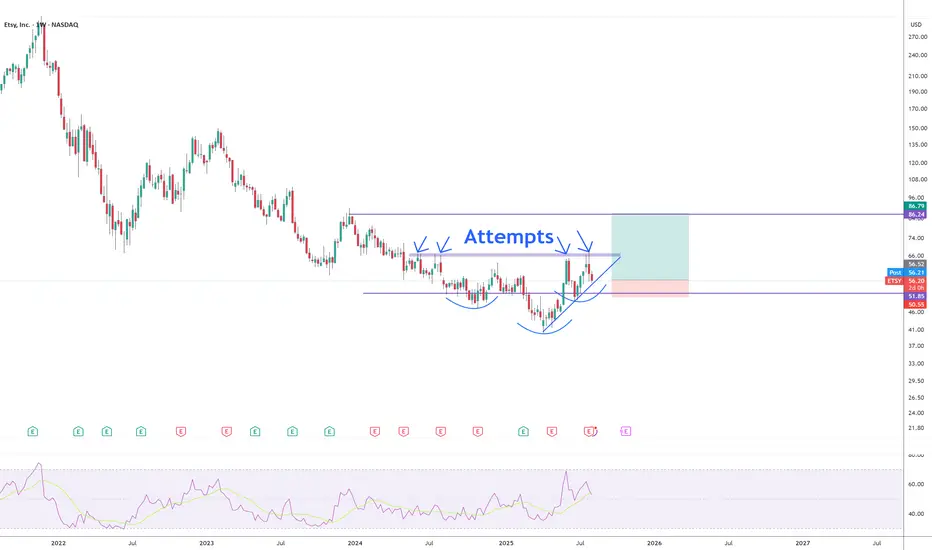
Many attempsInverse HS forming to break out the 67 resistance area. More than a year trying to break it, and now is forming a super bullish pattern to get over with it. Once it breaks it, will just go up. Hold this for a few months. SL if a weekly candle closes below the support area.
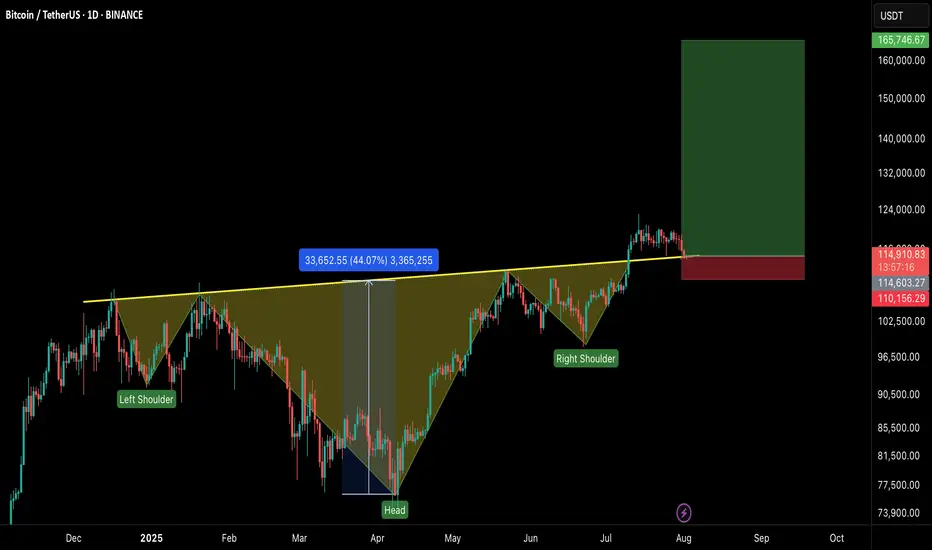
#BTCUSDT – Healthy Correction, Not the End!Bitcoin is currently experiencing a healthy pullback after an impressive run, testing the neckline of the Inverse Head & Shoulders breakout on the 1D timeframe.
🔹 Current Market View:
BTC is retesting the neckline of the IHS pattern, which now acts as a strong support zone.
Price is holding near $113K–$115K, which is crucial for maintaining bullish momentum.
This dip is a healthy correction, flushing out over-leveraged positions and preparing for the next leg up.
🔹 Key Levels:
Support Zone: $113,000 – $115,000
Immediate Resistance: $120,000 – $122,500
Breakout Target: $165,000+ on the next bullish wave
🔹 Market Sentiment:
Holding above the neckline keeps the bullish structure intact.
If the support holds, we can expect continuation to new highs once buying pressure returns.
A daily close below $112K would signal caution and delay the next rally.
💡 Tip: Don’t panic on these red candles. Healthy corrections are part of a sustainable uptrend.
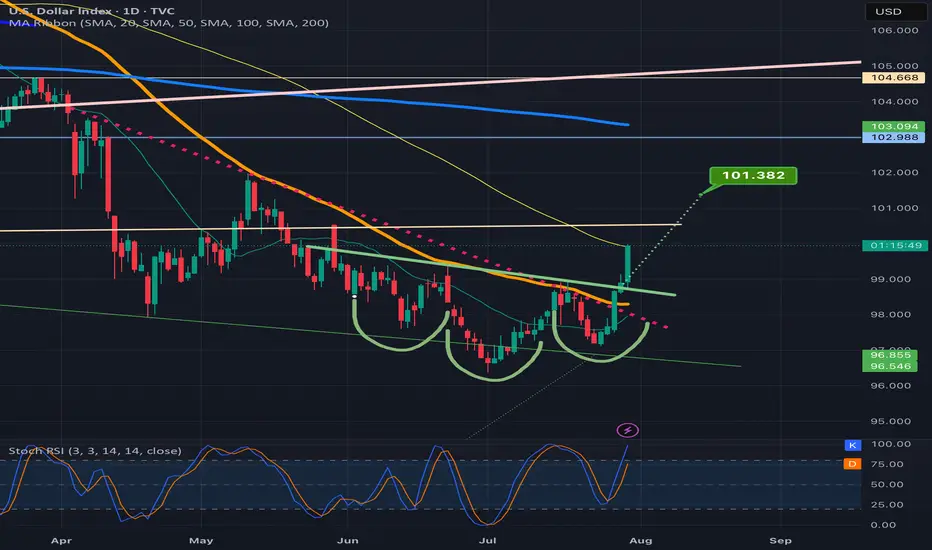
DXY attempting an inverse H&S breakoutSeeing a big green candle today on dxy after confirming the neckline of the inverse head and shoulders pattern as support on the previous daily candle.
BULLISH BTC - 7/29 Price Target $120.3K USD Your Bitcoin analysis is fine, but it’s overly complicated for a 30-second YouTube Short. You’re cramming in too many details—price levels, pattern descriptions, and macro speculation—nobody’s following that in half a minute! Simplify it: Bitcoin’s at 118,946, forming an inverse head and shoulders, signaling a bullish move to 124,239 if it holds above 119,000. Stop-loss at 115,500. Done. Why drag it out with RSI or flag icons nobody cares about in a Short? Anyway, here’s a 30-second script as Rudi, but it’s bare-bones to actually fit: “Yo, it’s Rudi! Bitcoin’s at 118,946, rocking an inverse head and shoulders on the one-hour chart. That’s a bullish setup! Breakout’s above 119,000, targeting 124,239. Set stops below 115,500 to play it safe. Volume’s backing it, so watch that neckline. Trade smart, peace out!” That’s 28 seconds, tight and punchy. You cool with

BULLISH - BTC Breakout Imminent The breakout confirmation in the context of the inverse head and shoulders pattern depicted in the provided chart refers to the validation of a bullish reversal signal, indicating a potential shift from a downtrend to an uptrend. This confirmation is typically established through specific technical criteria, which I will outline below in a structured manner. Given the updated current price of 118,580, I will also assess its implications based on the chart’s features.
Key Elements of Breakout Confirmation
1. Break Above the Neckline: The neckline, represented by the dotted teal line in the chart, serves as the primary resistance level. It connects the highs following the left shoulder and head formations, sloping slightly downward. From the visual analysis, the neckline appears to range approximately from 119,000–120,000 on the left to 117,000–118,000 near the right shoulder. A decisive breakout occurs when the price closes above this line, invalidating the prior downtrend. In the chart, the price has already surpassed this threshold, reaching 118,318.57 at the time stamp of 23:23.
2. Volume Support: Confirmation is strengthened by an increase in trading volume during the breakout candle or session. This suggests conviction among buyers and reduces the likelihood of a false breakout. The provided chart does not display volume data, so external verification (e.g., via exchange metrics) would be necessary for full assessment. Absent this, price action alone provides preliminary evidence.
3. Price Closure and Sustained Momentum: A single intraday breach may not suffice; confirmation often requires a session close (e.g., daily or hourly, depending on the timeframe) above the neckline, ideally with follow-through in subsequent periods. Additional supportive factors include:
• No immediate retest or pullback below the neckline, which could signal a trap.
• Alignment with momentum indicators, such as the Relative Strength Index (RSI) moving above 50 or a bullish moving average crossover (not visible in the chart).
4. Pattern Target Projection: Upon confirmation, the upside target is calculated by measuring the vertical distance from the head’s low (approximately 114,000) to the neckline at the breakout point (around 118,000), yielding a height of about 4,000 units. Adding this to the breakout level suggests potential targets near 122,000 or higher, though market conditions may alter outcomes.
Assessment at Current Price of 118,580
At 118,580, the price remains above the estimated neckline breakout point (approximately 118,000 at the right shoulder), extending the upward trajectory shown in the chart. This positioning supports preliminary confirmation of the breakout, as it demonstrates sustained momentum beyond the resistance. However, for robust validation:
• Monitor for a close above this level on the relevant timeframe.
• Watch for any retracement; a successful retest of the neckline as support would further solidify the pattern.
• Consider broader market factors, such as macroeconomic influences or sentiment in the asset class (likely cryptocurrency, given the price scale), which could impact durability.
If additional data, such as volume or updated charts, is available, it would refine this analysis. Should you require further details or evaluation of related indicators, please provide specifics.

USDJPY30h Candle confirmed break out!
📢 USDJPY – 30H Breakout Confirmed
Technical Outlook:
Confirmed breakout on the 30H candle, signaling bullish.
Resistance break!
A Inverse Head & Shoulders pattern observed, though the right shoulder is slightly weaker than the left.
For safety, Stop Loss placed below the last Higher Low (HL) to respect market structure.
📍 Key Line:
“Imperfect structures can still produce perfect trades — when aligned with price action and fundamentals.”
🌐 USD Fundamentals Supporting the Bias:
Stronger-than-expected economic data (e.g., recent PMI and labor reports) continues to support USD strength.
Fed's hawkish stance and higher-for-longer rate policy remain favorable for the dollar against low-yielding currencies like JPY.

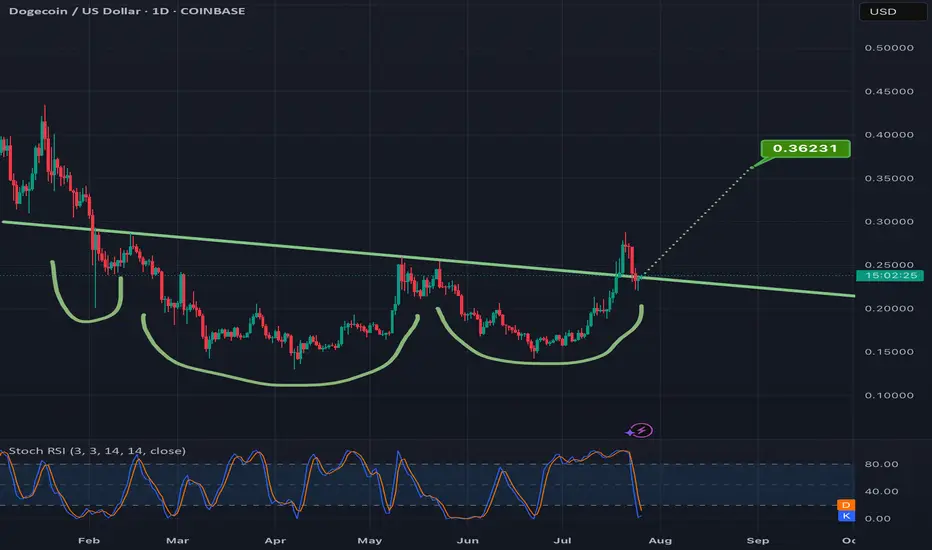
Confirming the breakout of this invh&s on doge can = 50% gainsAlready went above the neckline once and the current daily candle is currently back above the neckline for a second time. Hitting the full target would mean a good 50% gain from current price. *not financial advice*