ADAUSDT - 4Hr Falling WedgeA falling wedge pattern on the 4Hr chart.
This is coupled with a triple bottom which is seen on the green dashed line.
I expect price to drop a little below the green dashed as a fake out and then allow the falling wedge to take the bulls off.
J-ADA

ADA/USDT 1DAT UPDATE BY CRYPTOSANDERS !!hello, welcome to this ADA/USDT update by CRYPTO SANDERS.
CHART ANALYSIS:- Cardano is also found in a flat trend above the key support at 25 cents. For this reason, its price registered a minor loss of 1.3% this week. Sellers were unable to break this support even though they tried several times.
While ADA bulls have shown strength so far, bears could continue to put pressure on the key support. If more tests happen, buyers could become exhausted, which can create an opportunity for a breakdown.
the price action appears fragile to any renewed volatility across the market, particularly if the market leaders such as BTC and ETH decide to drop lower. In such a case, ADA could go to 24 cents again.
I have tried to bring the best possible outcome to this chart.
Hit the like button if you like it and share your charts in the comments section.
Thank you

⚠️Bitcoin is testing an important level!Hello trader! Today I have a new idea for you. Like and subscribe to the channel, there is a lot of useful information.✅
Well friends, bitcoin has finally revived and we are seeing a slight volatility, but the main thing is that in our direction - LONG
Technical: BTC has hit local resistance at $26.426 0.382 Fibonacci. As for me, this is now an important local level from which the reaction of both bears and bulls can follow, if the bulls break through this resistance, then I will expect an impulse to the previous high 27,500-28,100 and higher.
But if a refusal follows, then the guys are every man for himself:) I left the limit for $ 24,999 just in case)
My position: I try again Long with TBX $25,900
Happy trading everyone, don't forget about your risk management!

ADA is coin on the long list with the level 0.2571Hello everyone!!!
AIHermes today identified ADA coin on the long list with the level 0.2571
The stop is short.
We see a long accumulation and a gorgeous squeeze!
1st target 0.2609
Trade with us, trade better than us!
Today:
16 coins on the long list
10 coins on the short list.
The lead is in the short zone.
The full list of coins is delivered by our bot every day at 9.00 am

ADAUSD Analysis 3Sep2023This analysis sees from the market structure that occurs. After Choch the price returns to bearish and there is a fake out. At present the price has not returned bullish, still in the correction stage. There is a possibility that the price touches the fake out area before continuing bullish. Take long when the price approaches the fake out area.

Short-Term ProspectsAfter breaking out of the triangle pattern, Cardano rallied to the $0.28 range with the support of its buyers and temporarily broke the $0.27 resistance. However, the lack of stabilization of the high price within this area resulted in diminished demand, halting the continuation of the upward movement. This retracement led the price to revert back to the range channel, and it now approaches the bottom of this channel.
Taking into consideration the current Relative Strength Index (RSI) level, which stands at 37, we observe a moderate but not extreme level of downward momentum. This RSI reading adds a layer of context to the price movement.
Looking ahead in the short term, there is potential for price growth to reach the resistance range of $0.27 before retracing towards the support range at the channel's bottom, around $0.24. The subsequent phase of movement depends on the favorability of general market conditions. If these conditions remain conducive, we can anticipate an eventual exit from the range channel, potentially marking a period of short-term growth for Cardano.
Once the range channel is exited, the short-term price targets encompass $0.30, $0.32, and $0.35, assuming continued positive market conditions.

Cardano(ADA) Long Term Analysis Hello my friends, How are you doing?
It's a new day and I want to talk about Cardano to you.
Actually, I really like this asset. But at this price, it's so dangerous to buy.
I want to show you where is the best place to buy and Hold and what's the Final target.
As you understand it's a big scale about Cardano.
So don't forget to Like 👍, share with your friends 🤝, and then Follow ✌️ me to be able to see my next analysis.
Did you do that? So, let's go.
Here is the full analysis for this pair, let me know in the comment section below if you have any questions. I suggest you keep this pair on your watch list and see if the rules of your strategy are satisfied.
Ladies and gentlemen, let me introduce Cardano and the best zone to buy 😍😍
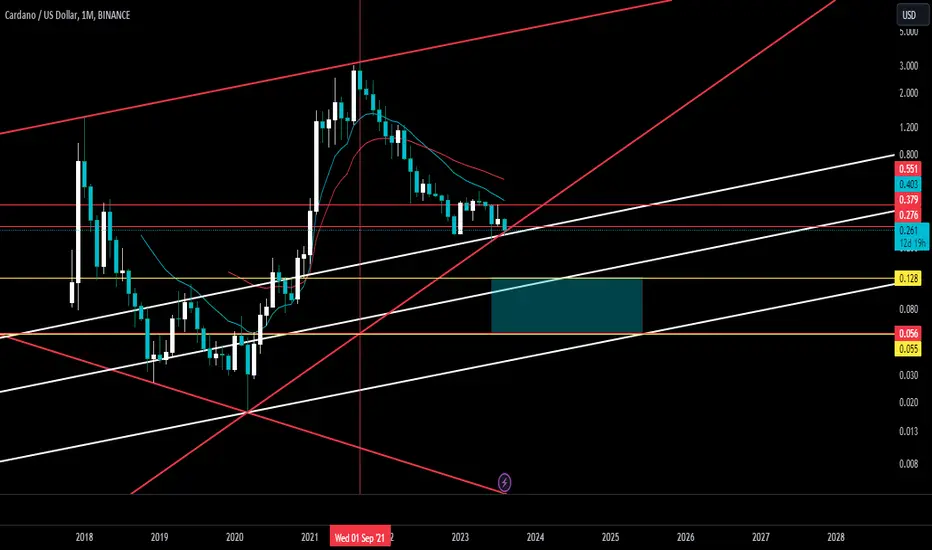
I want to analyze Cardano in Weekly Time Frame.
Before that, I want to remember It's not financial advice. so, just see and think about it.
I'm just sharing my view and opinion of the chart. Please do your own research.
Everything changed when we lost 0.33 USD in Cardano 🤷🏻♂️🤷🏻♂️🤷🏻♂️
As seen on the chart The price is so close to the first Support zone in 15-17 Cent and I expect the price to react to this support. But it's not the End of the movement. I expect the price to go up and then drop again. because the main correction has not ended.
The Second zone is between 8-9 Cent and it's the best zone to buy and hold Cardan for a long time 🧞♂️
Everybody who buys in this zone will be rich. Because from 0.09 To 10 USD.
It would happen around April 2024.
There is too much distance and I want to tell you and huge profit is coming. I mean it's more than 10000%. Such a wow.
As I told you my final target for Cardano is 10 USD 😍😍
So, don’t miss this chance.
We will enter into the depression zone soon.
Please be patient and put your order carefully.
We will never see this price anymore.
Please like, follow, share, and comment if you enjoy this Idea, Also share your ideas and charts in the comments.
Wish you health and wealth 💶
I hope you will fulfill your ambitions.
Sincerely Yours
Ho3ein.mnD ❤️

Cardano (ADA) - Breaking support towards a major zone?Cardano is at the bottom of its range, on important support. In the same way as other current assets, such as the Binance Coin, losing this zone could send ADA back into a lower zone down to $0.14-$0.17. This would appear to be a very attractive area for accumulation.

ADA - Excellent Zone to Accumulate NOWHi Traders, Investors and Speculators of Charts📈📉
A quick look at Cardano. First, let's establish the Macro Market Phase that we're current trading in. This helps manage realistic price action. ADA is currently in pre-bull market phase / accumulation phase, in other words it is a great time to accumulate for the rally to come with scattered buying orders.
However, this doesn't rule out the possibility of another shakeout or bear trap, where the price drops as low as 20c before starting a new bullish phase.
A look at the technical indictor confirms this for the short term, where we see a very bearish scenario on the daily in terms of Technical Indicator.
Worried about the recent drop in price across crypto markets🤔? Check out this idea :
_______________________
📢Follow us here on TradingView for daily updates and trade ideas on crypto , stocks and commodities 💎Hit like & Follow 👍
We thank you for your support !
CryptoCheck
CRYPTOCAP:ADA BINANCE:ADAUSDT BYBIT:ADAUSDT.P OKX:ADAUSDT.P COINBASE:ADAUSD BINANCE:ADAUSD

🌧️ Crypto Forecast But ADA DOT & LINK ☀️ - Bullish UpsideRainy ☔ and cloudy ☁️ trading conditions grip the global crypto market, hinting at a bearish trend over the next 24 hours and one-week horizon.
But Cardano, Polkadot, and Chainlink shine ☀️ unaffected, signaling a slightly bullish market with upside potential.
Follow us for more crypto weather reports!

Trend and Potential SwingsCardano exhibited a consistent overall trend last week, which suggests the possibility of this trend persisting. The price range of Cardano shows it has been moving between a resistance level of $0.27 and a support level of $0.24. The chart's dynamic resistance remains robust, with buyers unable to breach it. This increases the likelihood of a potential test of the lower boundary of the price channel.
In the context of the 4-hour timeframe, buyers have made few attempts to overcome the previous peak during the downward trend. As a result, price ranges below $0.25 are seen as areas where significant market participants are active, aiming to preserve liquidity. This makes it highly probable that the price will reach these levels.
A more specific support area, known as a reaction zone, is identified around the $0.234 mark. It is anticipated that Cardano could experience a positive upswing from this zone, potentially reaching the upper boundary of the range channel.

ADA: Strong Sun ☀️, Market Shift Ahead ⛅️☔ Bearish Signs Cardano's current market stance is under the influence of a strong sun ☀️, hinting at potential changes ahead. According to ATTMO, an AI-powered crypto weather forecasting tool, this solar presence could signal a forthcoming market correction.☔
Investors and traders are advised to keep a watchful eye on Cardano's movements as it navigates these uncertain skies.
Follow us for more reports!

ADAUSDTThis is a 1D frame analysis for ADAUSDT The price of Bitcoin has tested its static support band for some time and is currently above the support line. The candle has started to move upwards with a shadow a few days ago, and we can expect a price increase, but keep in mind that as long as the price is above the support line, we can expect a price increase. If the price can maintain itself above the support line, it can experience higher prices for a long time. But don't be fooled, it is possible for the price to go slightly higher and be pushed back by selling pressure and experience more volatility. We have mapped out support and resistance areas for you dear friends so that you can use them in different situations.

‼️Rebound soon! Bitcoin is approaching a key level!Hello trader! Today I have a new idea for you. Like and subscribe to the channel, there is a lot of useful information.✅
Again we get a powerful FUD and again the market reacts with a strong fall, there is nothing unusual, we work further friends
Attempt #2! I try again to take a long, but more positionally. I act in the usual way for myself, I will arrange a grid of orders for additional draw. 30% of the deposit with 5X leverage.
Technical: bitcoin is slowly approaching the key support range of $25,200-24,800, the last strong buyout after a similar spill was from there. (I'm not saying that the situation will repeat itself again, I'm just guessing). Stop set a little further than the local LOW.
Deal plan:
▪️Entry - 25,850/25,333/24,955$
▪️Stop - $23,950
▪️Take - I will update.
Guys, a huge request do not climb on the rampage, observe the risks and with a small profit, try to move the stop to no loss, they can bang again in the direction of the loy, so be careful!

$KAS following $ADA and $ETH fractalsChance of $KAS reaching a peak by early 2024 if these fractals continue to play out

ADAUSDT → Let's take a look togetherhello guys...
let's check this coin together.
in 4h time frame, this coin engulfed the last higher high but it is on the descending channel so it is risky for getting a long position now.
we can wait until the breakout happens.
what this coin is doing in the upper time frame?!
the bearish trend in a daily time frame:
the bearish trend in the weekly time frame:
what do you think about this coin?!
hold it?!

Ada BottomLooking At market Structure i have previously monthly be critical support ones it possibly brakes down to target is market.
ADA - Short Entry TriggerI entered a short here on Cardano. Showing signs of weakness after a solid pump. A healthy retracement seems like a higher probability outcome.
Looking to take profit right above the #GoldenPocket
1.5% Risk on trade
--------------------------------------------------------------------------------------------------
Every day the charts provide new information. You have to adjust or get REKT.
Love it or hate it, hit that thumbs up and share your thoughts below!
Don't trade with what you're not willing to lose. Calculate Your Risk/Reward!
This is not financial advice. This is for educational purposes only.

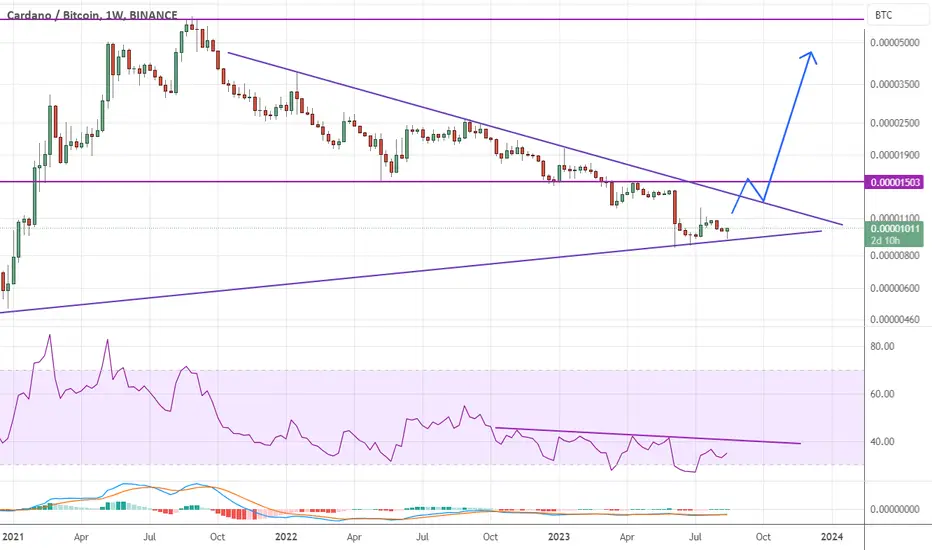
ADABTC looks bullish AF !!Look at that latest weekly candle! Hammer doji!
Bullish!
When we break the diagonal trendline, it'll be party time!
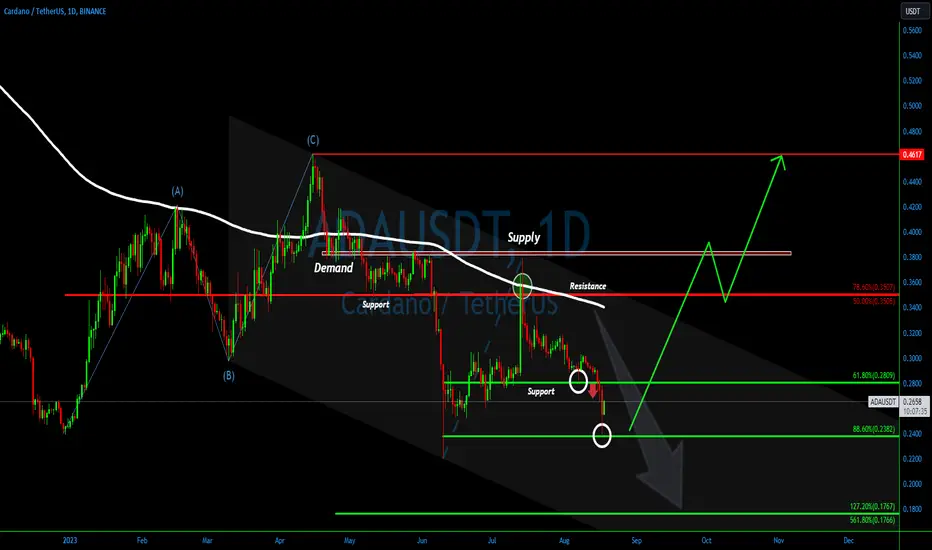
ADAUSDT (Cardano) Potential Bottom Formation Explored💎Attention, Paradisers! An imperative update on #ADAUSDT is here. We've pinpointed another pivotal bounce off the support for #Cardano. Following a verified daily dip below the 61.8% Fibonacci support, the trend persisted in its descent, aligning with our preliminary predictions.
💎With this support breached, our gaze is set on #ADA approaching our lower target at the dual Fibonacci support. Yet, the previous day's decline halted precisely at the 88.6% Fibonacci support, casting shadows on the prospects of a further downward trajectory.
💎If this support remains unyielding, it could herald an optimistic turn in #ADAUSDT's price movement, possibly marking the nadir of the prevailing downtrend. However, for a trend reversal to gain our stamp of approval, we're keenly awaiting a breach and subsequent closure above the resistance thresholds of $0.35 and $0.38.
💎Such a move would amplify the chances of a medium to long-term bullish wave. For the time being, our focus remains unwavering on the current support, which might just be the linchpin for long-term stability. Stay vigilant, Ladies and Gentlemen of ParadiseClub!
Bitcoin - rebound soon, or is it just the beginning of the fall?Hello trader! Today I have a new idea for you. Like and subscribe to the channel, there is a lot of useful information.✅
Guys, this is an update of all my latest ideas that I wrote about in shorts, all ideas worked out 100%, thanks to everyone who put their fingers up and wrote comments.
Fixed a full short position at $27,750. The total profit from the transaction is 30% with 5X leverage.
I had a plan and I adhered to it) more than two weeks in the position were not in vain, all my friends with a profit who were with me
BACK IN THIS ROOM?
Technical: We have support ahead in the $27,500-$27,350 range and there is a chance to bounce back to the trendline and test as resistance. So far, we have tested channel support that may not survive, so I will try to enter with a little extra below.
Placed orders in LONG:
In a deal - 20% X5
Entry - $27,777/$27,350
Stop - $26,880
Take - I will update.
Guys, the pressure on the market, as we see it, is very strong, who is not sure or in doubt, it's better not to try to catch a rebound, I'm trying and my risks are justified. With God!

ADA .P perfomance in last 8 months in 2023This year has been a rough year for crypto. Downward pressure appears with all coins.
With the ADA 2h frame, we see the price continuously entering the red area (possibly signaling a downtrend).
This is test result from the beginning of 2023 to the present including the current bearish period. Let's see how the S1-TM performs in a downtrend.
If you have an opinion or want to see results with Spot ADAUSDT, please leave a comment.

APT, Open interest rose by 100%. Something is going to happen APT, Open interest rose by 100%. Something is going to happen
watch video update
