FFUSDT 1 Hour Technical AnalysisFFUSDT 1 Hour Technical Analysis
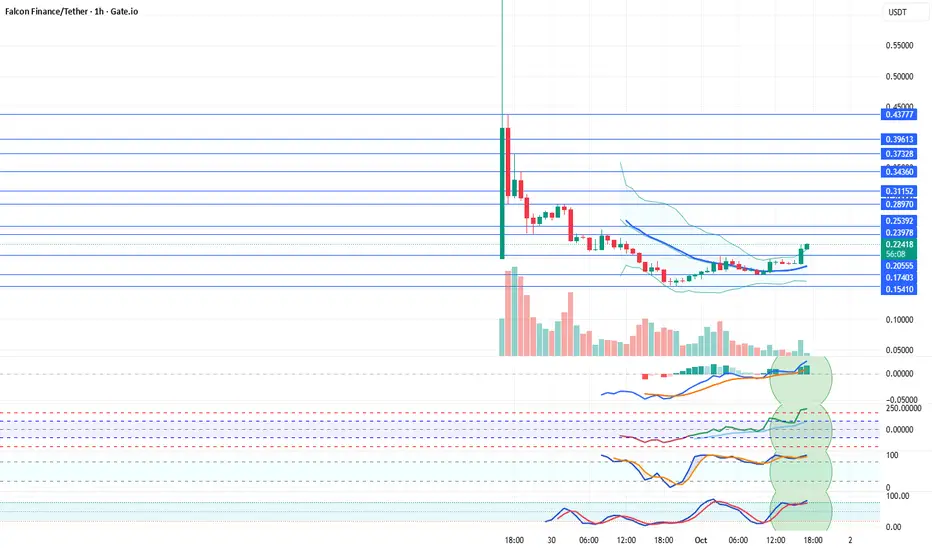
Falcon Finance Coin has risen above its 21-day moving average. After the sharp decline following its listing, it now appears to be recovering. Having broken above the 0.20555 resistance, we believe Falcon Finance Coin may continue its upward movement if indicators remain positive. Resistance levels will be monitored closely.
Resistances: 0.2397 – 0.2539 – 0.2897 – 0.3115 – 0.3436 – 0.3732 – 0.3961 – 0.4377
Supports: 0.2055 – 0.1740 – 0.1541
We’d appreciate it if you 🚀 rocket our posts. Also, don’t forget to share them on your social media accounts.
Legal Disclaimer:
The information, comments, and recommendations provided here do not constitute investment advisory services. Investment advisory services are offered within the framework of an investment advisory agreement to be signed between the client and brokerage firms, portfolio management companies, or non-deposit banks. The content shared on this page reflects only personal opinions. These views may not be suitable for your financial situation, risk profile, or return preferences. Therefore, no investment decisions should be made based on the information provided here.
J-BNB
BNB/USDT 4h chart review1. Trend and structure
• The price struck the relegation (orange) line, which is a positive signal.
• Currently, the course oscillates around 1007 USDT after reflection from holes ~ 930.
2. Key levels
• Support: 995, 971, 930.
• Resistance: 1026, 1051, 1084.
3. MacD
• The histogram grows, but begins to slightly weaken.
• MacD line still above the signal → slightly bullish signal, but with braking signs.
4. RSI (4H)
• RSI around 55–60 → neutral/bullish, not yet burdened.
5. Simple interpretation
• As long as the course lasts above 995, the upward scenario is possible.
• Breaking above 1026 will open the road to 1051 and 1084.
• decrease below 995 → Risk of retests 971, and later 930.

FFUSDT Coin 15 Min. Technical AnalysisFFUSDT Coin 15 Min. Technical Analysis
Falcon Finance, a newly listed coin on the exchanges, is currently moving sideways in the 15-minute technical analysis. As long as it is priced above the 0.239 support, there may be a possibility to test the 0.507 resistance in the future.
Resistances: 0.2897 - 0,3115 - 0,3436 - 0,3732 - 0,3961 - 0,4377 - 0,5071
Supports: 0,2397 - 0,2000
We would appreciate it if you rocket our posts. Also, don’t forget to share on your social accounts.
Legal Disclaimer:
The information, opinions, and recommendations contained here do not constitute investment advice. Investment advisory services are provided within the framework of an investment advisory agreement to be signed between clients and brokerage firms, portfolio management companies, or non-deposit banks. The content written on this page only reflects personal views. These views may not be suitable for your financial situation, risk, and return preferences. Therefore, investment decisions should not be made based solely on the information and writings here.

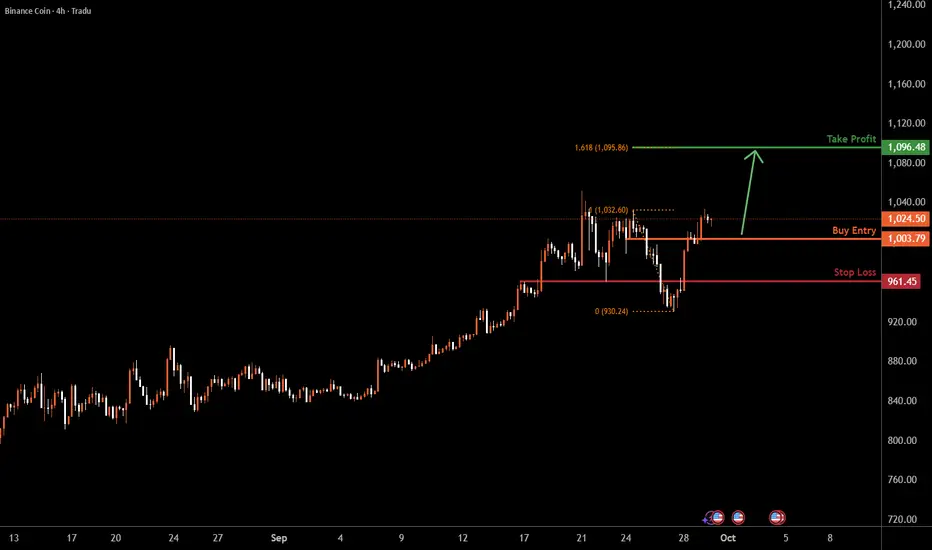
BNBUSD H4 | Bullish bounceBNB/USD is falling towards the buy entry which is a pullback uport and could bounce from this level to the upside.
Buy entry is at 1,003.79, which is a pullback support.
Stop loss is at 961.45, which is a pullback support.
Take profit is at 1,096.48, which aligns with the 161.8% Fibonacci extension.
High Risk Investment Warning
Trading Forex/CFDs on margin carries a high level of risk and may not be suitable for all investors. Leverage can work against you.
Stratos Markets Limited (tradu.com ):
CFDs are complex instruments and come with a high risk of losing money rapidly due to leverage. 65% of retail investor accounts lose money when trading CFDs with this provider. You should consider whether you understand how CFDs work and whether you can afford to take the high risk of losing your money.
Stratos Europe Ltd (tradu.com ):
CFDs are complex instruments and come with a high risk of losing money rapidly due to leverage. 66% of retail investor accounts lose money when trading CFDs with this provider. You should consider whether you understand how CFDs work and whether you can afford to take the high risk of losing your money.
Stratos Global LLC (tradu.com ):
Losses can exceed deposits.
Please be advised that the information presented on TradingView is provided to Tradu (‘Company’, ‘we’) by a third-party provider (‘TFA Global Pte Ltd’). Please be reminded that you are solely responsible for the trading decisions on your account. There is a very high degree of risk involved in trading. Any information and/or content is intended entirely for research, educational and informational purposes only and does not constitute investment or consultation advice or investment strategy. The information is not tailored to the investment needs of any specific person and therefore does not involve a consideration of any of the investment objectives, financial situation or needs of any viewer that may receive it. Kindly also note that past performance is not a reliable indicator of future results. Actual results may differ materially from those anticipated in forward-looking or past performance statements. We assume no liability as to the accuracy or completeness of any of the information and/or content provided herein and the Company cannot be held responsible for any omission, mistake nor for any loss or damage including without limitation to any loss of profit which may arise from reliance on any information supplied by TFA Global Pte Ltd.
The speaker(s) is neither an employee, agent nor representative of Tradu and is therefore acting independently. The opinions given are their own, constitute general market commentary, and do not constitute the opinion or advice of Tradu or any form of personal or investment advice. Tradu neither endorses nor guarantees offerings of third-party speakers, nor is Tradu responsible for the content, veracity or opinions of third-party speakers, presenters or participants.
Weekly Crypto Market Review: BTC, ETH, SOL, XRP, BNB, HYPEReview of trend structures and my expectations for the coming weeks on Bitcoin and key altcoins.
The key local support zones highlighted in the previous market outlook did not hold against selling pressure, increasing the likelihood of a more prolonged consolidation across the crypto space.
As long as prices continue to close below their local resistance areas, the base scenario remains in favor of further correction toward macro support levels.
Below is a brief summary of important resistance, support zones and potential trend structures I am following:
BITSTAMP:BTCUSD
Chart:
Resistance: 112–114.5k
Support: 103.5–101–98k
BITSTAMP:ETHUSD
Chart:
Resistance: 4115–4215
Support: 3700–3430
BINANCE:BNBUSD
Chart:
Resistance: 1020–1040
Support: 900–870–840
BITSTAMP:XRPUSD
Chart:
Resistance: 2.87–2.99 / 3.07
Support: 2.55–2.40–2.32
PYTH:HYPEUSD
Chart:
Resistance: 49–50–53
Support: 35.5–29–23
COINBASE:SOLUSD
Chart:
Resistance: 213–219
Support: 177–169
Thank you for your attention, and I wish you a successful week ahead.

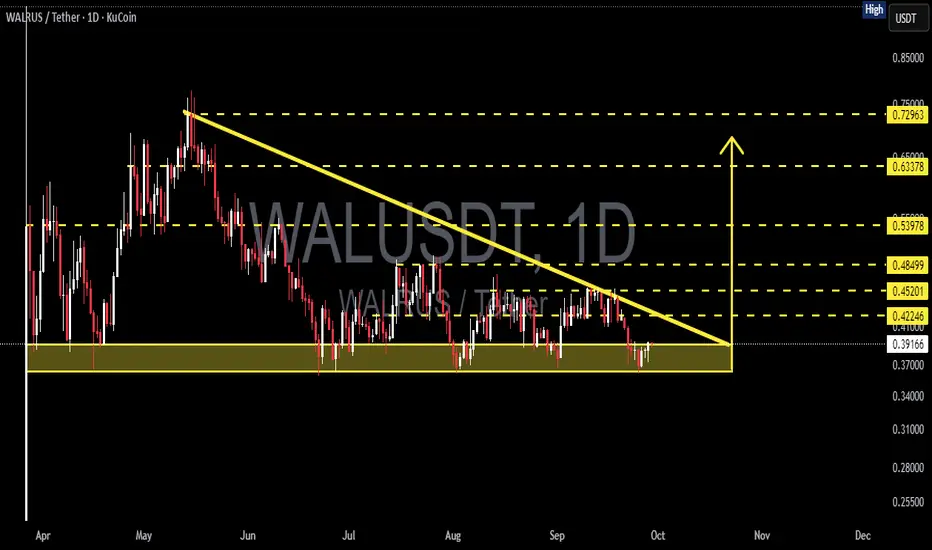
WALRUS/USDT – Descending Triangle at Critical Support!WALRUS/USDT is currently trading within a descending triangle pattern on the daily timeframe. This structure is formed by a series of lower highs pressing from above (descending trendline), while the 0.36–0.40 support zone (yellow box) acts as a major floor below.
This highlights strong selling pressure from the top, but at the same time buyers are still holding the support area. The price is now consolidating within a narrowing range, waiting for a decisive breakout that will dictate the next big move.
---
Bullish Scenario (Upside Breakout)
If WALRUS can break above the descending trendline with a daily close above 0.422–0.452, this descending triangle may flip into a bullish reversal. That would signal buyers regaining control.
Bullish Targets:
Target 1: 0.485
Target 2: 0.539
Target 3: 0.633 – 0.729 (if momentum continues strongly)
Validation: breakout with high volume + successful retest of breakout level as support.
---
Bearish Scenario (Downside Breakdown)
If WALRUS closes daily below 0.36, the descending triangle will confirm as a bearish continuation. This shows sellers overwhelming buyers at support.
Bearish Targets:
Target 1: 0.31 – 0.30
Target 2: 0.255 (long-term demand zone)
Validation: strong bearish daily close with volume, without quick recovery above 0.36.
---
Pattern & Interpretation
The descending triangle often acts as a bearish continuation pattern.
But in strong support zones, it can turn into a reversal pattern if an upside breakout occurs.
WALRUS is at a decision point: the tighter the consolidation, the bigger the potential explosive move once a breakout happens.
---
Conclusion
Bias: Neutral → Bearish as long as WALRUS remains below the descending trendline.
Bullish confirmation: daily close above 0.422–0.452 → potential rally to 0.485 – 0.539.
Bearish confirmation: daily close below 0.36 → possible drop to 0.31 and 0.255.
Traders should wait for volume-backed breakout confirmation before positioning. WALRUS is now at a make-or-break level: will it bounce or break?
---
#WALRUS #WALRUSUSDT #CryptoAnalysis #TechnicalAnalysis #DescendingTriangle #Breakout #SupportResistance #PriceAction
Resistance Zone: 977.90-1047.80
Hello, fellow traders!
Follow us to get the latest information quickly.
Have a great day!
-------------------------------------
(BNBUSDT 1M Chart)
We achieved our target by touching the Fibonacci level of 1.618 (1057.16).
We need to see if the price can rise towards Fibonacci ratio 2 (1259.05).
-
(1D chart)
The HA-High ~ DOM (60) range has formed at 977.90-1047.80.
Therefore, the 977.90-1047.80 range could act as resistance.
If it falls below 977.90, it could encounter the M-Signal indicator on the 1M chart.
Before that, we need to see if the price rises along the uptrend line (1).
-
Thank you for reading to the end.
I wish you successful trading.
--------------------------------------------------

ASTER Market Update📊 ASTER Market Update
ASTER has formed a bearish Double Top pattern ⚠️ and broke the blue support zone 🔵
What’s next? If price keeps retracing down, we have two green zone levels 🟢 where buyers previously accumulated.
These zones could give potential long entries or spots to accumulate more — but always wait for confirmation before entering ✅
⚡ Trade smart, not blind.

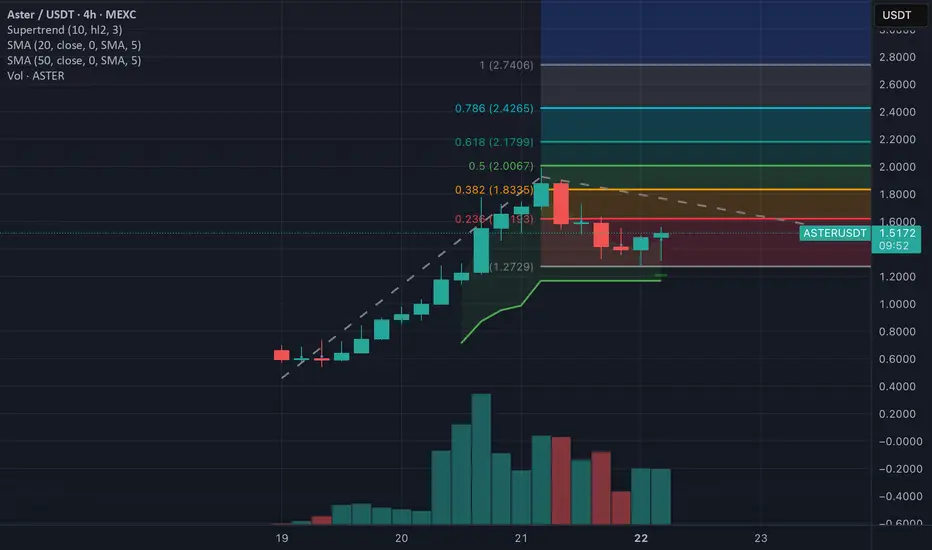
ASTERUSDT — Will Buy Zone Hold or Break?Overview
ASTER price is currently consolidating after a strong rally toward 2.42. On the 2-hour chart, we can clearly see two major highlighted areas: Buy Zone 1 (primary support) and Buy Zone 2 (deeper secondary support).
The structure still maintains a potential bullish continuation, but repeated weakness around support indicates risk of a breakdown if buyers fail to defend the current zone.
---
🔑 Key Levels
Nearest Support (Buy Zone 1): 1.75 – 1.95
Secondary Support (Buy Zone 2): 1.25 – 1.45
Minor Resistance: 2.12
Major Resistance: 2.33 – 2.42 (previous supply zone / local high)
Current Price: 1.91
---
📐 Technical Pattern
1. Bullish Flag / Rectangle
A sideways consolidation after a strong uptrend move, often a continuation pattern. A confirmed breakout to the upside could lead to a retest of 2.42.
2. Multiple Support Tests at Buy Zone 1
Several rejections at 1.8 – 1.9 confirm this zone as a critical short-term demand area. However, the more often a support is tested, the weaker it becomes.
3. Lower Highs Formation
Minor lower highs suggest mild selling pressure. This structure often precedes either a breakout or a breakdown, depending on which side gets taken out.
---
🚀 Bullish Scenario
Confirmation: A 2H close above 2.12 with rising volume.
Targets:
TP1 = 2.12 (breakout retest)
TP2 = 2.33
TP3 = 2.42 (previous high)
Extended Target: If 2.42 breaks, next psychological resistance sits around 2.80 – 3.00.
📌 Bullish entry ideas:
Aggressive: Buy within Buy Zone 1 with stop loss below 1.75.
Conservative: Wait for breakout above 2.12 + confirmed retest.
---
🐻 Bearish Scenario
Confirmation: A 2H close below 1.75 (breakdown from Buy Zone 1).
Targets:
TP1 = 1.50
TP2 = Buy Zone 2 (1.25 – 1.45)
Extended Target: If Buy Zone 2 fails, the structure shifts into a downtrend, potentially moving closer to 1.00.
📌 Bearish entry idea:
Enter short after breakdown (close <1.75), with stop above 1.95 (former support turned resistance).
---
📊 Risk Management
Always set stop losses below support (for longs) or above breakdown (for shorts).
Scale out profits at key resistance levels.
Keep risk per trade ≤2% of total capital.
---
⚠️ Things to Watch
False breakouts: Require volume confirmation.
Correlation with BTC/ETH: Broader market moves can strongly influence ASTER’s direction.
High volatility: Fakeouts may occur before the real move.
---
📌 Conclusion
As long as price holds above Buy Zone 1, the bullish continuation toward 2.12 – 2.42 remains valid.
A breakdown below 1.75 would invalidate the short-term bullish case and open the door toward Buy Zone 2.
Key decision point is very close — watch carefully for breakout or breakdown confirmation.
---
#ASTER #ASTRUSDT #CryptoAnalysis #BuyZone #SwingTrade #PriceAction #SupportResistance #BullishScenario #BearishScenario

BNB 1H Analysis - Key Triggers Ahead😃 Hey , how's it going ? Come over here — Satoshi got something for you!
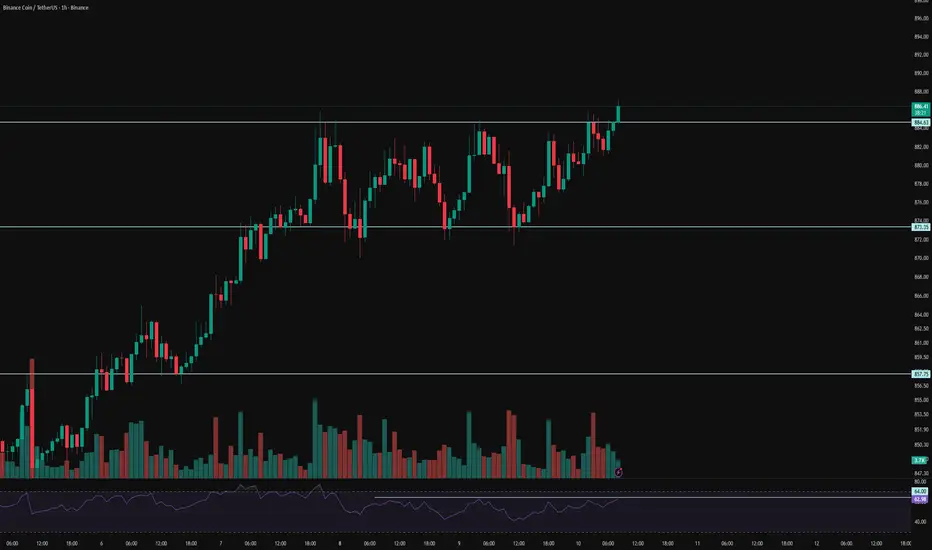
⏰ We’re analyzing BNB on the 1-Hour timeframe.
👀 On the 1-hour timeframe of Binance Coin we can see that this coin, the popular token of Binance exchange with very strong backing, has formed a very important resistance at $885. With a breakout and confirmation above this level, and if the PPI news is positive, BNB could start another strong upward move.
⚙️ The key RSI level for this coin is at 64, and breaking above this level could give BNB higher volatility and even a price surge.
🕯 The volume, size, and number of green candles are increasing, and it seems we are almost exiting the range structure. With buying pressure and rising volatility, BNB could form more green candles and experience solid price growth.
🌒 On the 1-hour timeframe of the BNBBTC pair we can see that it has been rejected from the 0.007915 zone, which has created a trigger for a breakout at this level. If this zone is broken, BNB could also break its marked resistance in the USDT pair and move upward.
💡 This coin had resistance at $885, which has now been broken, and it is moving upward. A pullback to this resistance also happened during this breakout, which was executed well. For confirmation, you can also check the 15-minute timeframe.
❤️ Disclaimer : This analysis is purely based on my personal opinion and I only trade if the stated triggers are activated .
usdt.d 4husdt.d 4h
🔎 A few notes from the chart:
The chart is located on the PRZ (Potential Reversal Zone) or the harmonic pattern completion zone.
The candles have reached an important resistance zone after rising.
At PRZ, we usually expect a reversal (return to the bottom), especially when it overlaps with Fibonacci levels and the trend line.
It is characteristic that a green rectangle (probably a sell position) has been drawn on the chart, which indicates that we expect a decline.
📌 Conclusion:
Due to the harmonic structure + PRZ support, the probability of a price reversal and a downward move is higher ✅

BNBUSDT | Red Box as Potential Hedge ZoneOn BNB, I’m watching the red box resistance carefully. If price reaches that area and CDV gives the kind of signal I’m expecting, I’ll treat it as an opportunity.
Not to flip my long-term view, but to hedge existing long positions with a tactical short. That way, I protect gains while still leaving room in case the broader move continues.
This isn’t a blind short. I’ll only act if CDV divergence and footprint confirm selling pressure at the red box. Without those signs, I let it go.
I keep my charts clean and simple because I believe clarity leads to better decisions.
My approach is built on years of experience and a solid track record. I don’t claim to know it all, but I’m confident in my ability to spot high-probability setups.
If you would like to learn how to use the heatmap, cumulative volume delta and volume footprint techniques that I use below to determine very accurate demand regions, you can send me a private message. I help anyone who wants it completely free of charge.
I have a long list of my proven technique below:
🎯 ZENUSDT.P: Patience & Profitability | %230 Reaction from the Sniper Entry
🐶 DOGEUSDT.P: Next Move
🎨 RENDERUSDT.P: Opportunity of the Month
💎 ETHUSDT.P: Where to Retrace
🟢 BNBUSDT.P: Potential Surge
📊 BTC Dominance: Reaction Zone
🌊 WAVESUSDT.P: Demand Zone Potential
🟣 UNIUSDT.P: Long-Term Trade
🔵 XRPUSDT.P: Entry Zones
🔗 LINKUSDT.P: Follow The River
📈 BTCUSDT.P: Two Key Demand Zones
🟩 POLUSDT: Bullish Momentum
🌟 PENDLEUSDT.P: Where Opportunity Meets Precision
🔥 BTCUSDT.P: Liquidation of Highly Leveraged Longs
🌊 SOLUSDT.P: SOL's Dip - Your Opportunity
🐸 1000PEPEUSDT.P: Prime Bounce Zone Unlocked
🚀 ETHUSDT.P: Set to Explode - Don't Miss This Game Changer
🤖 IQUSDT: Smart Plan
⚡️ PONDUSDT: A Trade Not Taken Is Better Than a Losing One
💼 STMXUSDT: 2 Buying Areas
🐢 TURBOUSDT: Buy Zones and Buyer Presence
🌍 ICPUSDT.P: Massive Upside Potential | Check the Trade Update For Seeing Results
🟠 IDEXUSDT: Spot Buy Area | %26 Profit if You Trade with MSB
📌 USUALUSDT: Buyers Are Active + %70 Profit in Total
🌟 FORTHUSDT: Sniper Entry +%26 Reaction
🐳 QKCUSDT: Sniper Entry +%57 Reaction
📊 BTC.D: Retest of Key Area Highly Likely
📉 TIAUSDT
: Still No Buyers, Bearish Outlook
🎭 BELUSDT
: Manipulation Masterclass – Buyers in Control
📈 OGNUSDT: One of Today’s Top Volume Gainers +32.44%
🛑 GMTUSDT: Resistance & Strategy
⚠️ TRXUSDT: 150% Daily Volume Spike – No Buyers Yet
🔄 AAVEUSDT: Retracement Opportunity

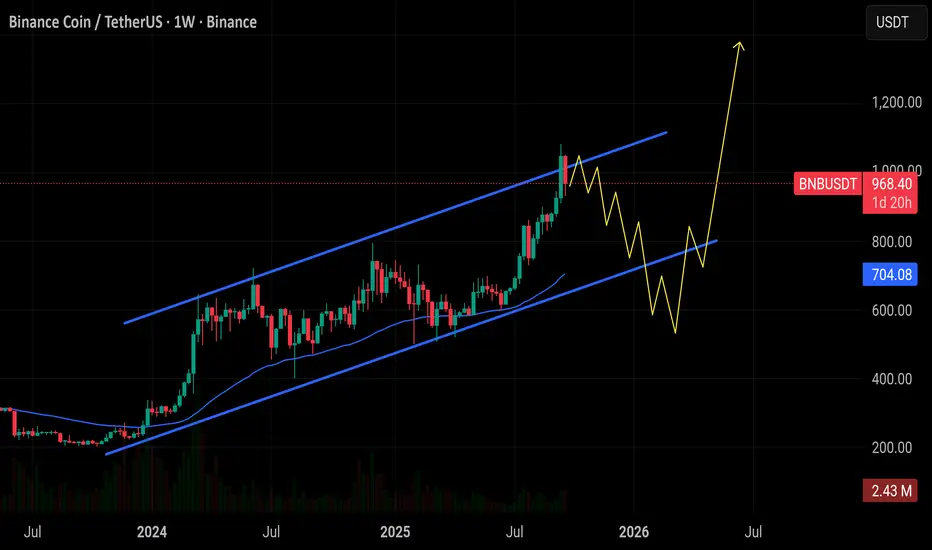
$BNB is holding near $968 with solid momentum, but ? CRYPTOCAP:BNB is holding near $968 with solid momentum, but I expect a healthy dip toward the $710–550 support zone before the next big move. That’s the area I’ll be looking to load, with eyes on a breakout toward $1,200+.
BNB Swing Long Idea - TTKZ Model📊 Market Sentiment
FED has resumed its rate-cutting cycle, starting with a 0.25% cut in September, with two more 0.25% cuts expected in the coming months. Additionally, institutional liquidity inflows have accelerated as the U.S. officially adopts crypto as part of its reserves. While inflation remains elevated, the weakening labor market is forcing the FED to ease, driving more capital into risk-on assets.
📈 Technical Analysis
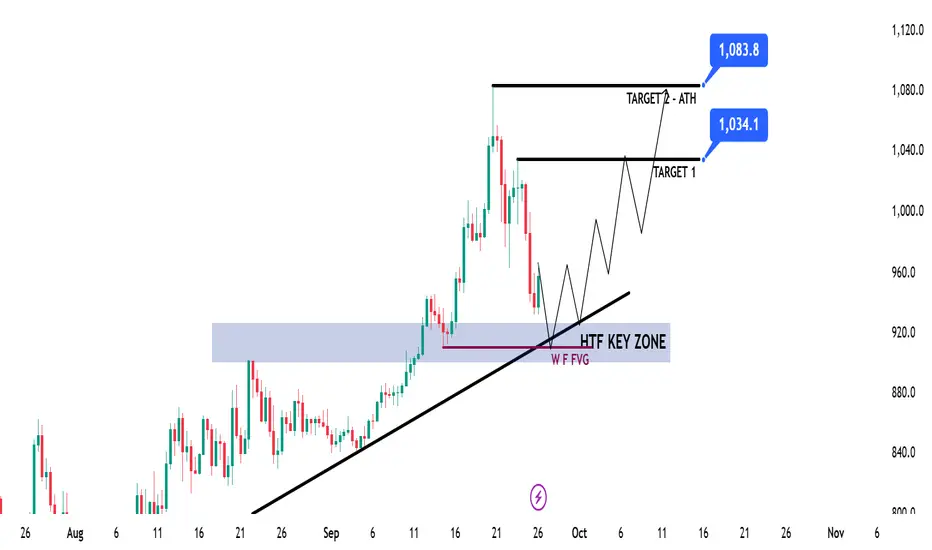
Price is making new all-time highs continuously. The HTF Weekly–Daily structure remains bullish, so my bias is only long.
Currently, price is retracing toward the HTF bullish trendline and a HTF Key Zone, both of which I assume are strong levels for a potential bounce and continuation higher.
📘 Model to be used – Trendline Test w HTF Key Zone (TTKZ)
In this model, I look for a clear HTF trendline that continuously supports price. When price comes back to test that line, I check if there’s also a HTF Key Zone aligned for confluence. Strong overlapping zones create higher probability bounce areas for long setups.
📌 Game Plan
1-Wait for a test of the HTF trendline
2-Confirm test of the HTF Key Zone
🎯 Setup Trigger
I will be waiting for a 4H break of structure before entering the trade.
📋 Trade Management
Stoploss: Below the 4H swing low that creates the break of structure
Targets: TP1: 1034$ | TP2: 1083$
Once TP1 is reached, stoploss will be moved to breakeven.
💬 Like, follow, and comment if this breakdown supports your trading! More setups and market insights coming soon — stay connected!
⚠️ Disclaimer: This content is for informational and educational purposes only and does not constitute financial, investment, or trading advice. Always DYOR before making any financial decisions.
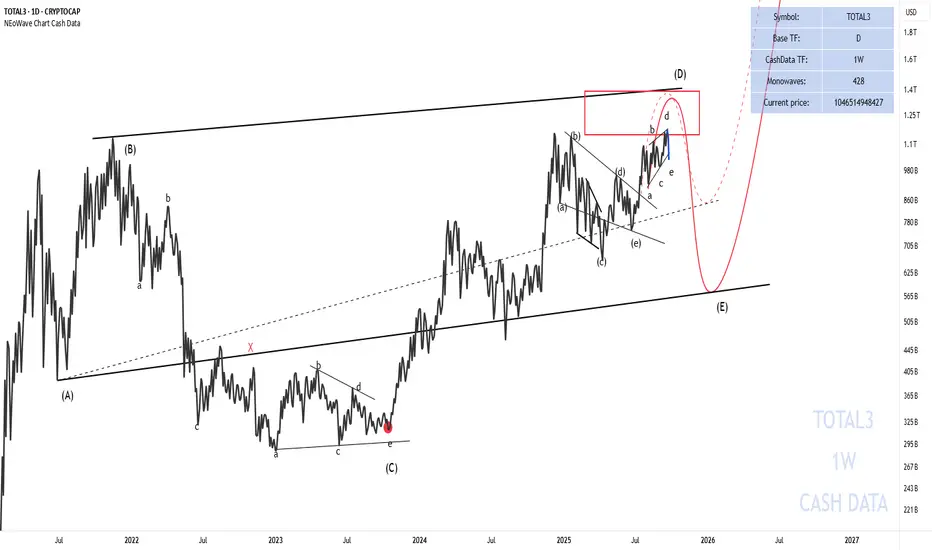
Altseason is likely to occur in 2026
In my latest analysis, I noted: "It appears that after the recent growth in lower timeframes, we have entered a corrective phase, and a Running Contracting Triangle pattern is likely forming. We are currently in wave-d of this triangle."
After the completion of wave-d , we observed a 10% drop in #TOTAL3, which led to a significant decline in altcoins.
Regarding the Running Triangle:
The Running Triangle pattern remains valid. However, with wave-e breaking the a-c trendline, we should consider this as a warning. There is a possibility that instead of a Running Triangle, a Diametric pattern may form.
Regarding the Altcoin Market:
As I previously mentioned, the Altseason that many analysts are anticipating has not yet arrived. By examining the 1W cash data chart , we can see a Neutral Triangle forming, and we are currently in wave-(D) of this triangle. Nevertheless, I still believe altcoins will experience at least a 30% to 70% growth.
In my view, the main Altseason is likely to occur in 2026. However, to determine the precise timing of the Altseason's start, we need to wait for the completion of wave (D).
Good luck
NEoWave Chart
BNBUSD H1 | Bearish dropBNB/USD is rising towards the sell entry which is a pullback resistance that lines up with the 38.2% Fibonacci retracement and could reverse from this level to the downside.
Sell entry is at 968.90, which is a pullback resistance that lines up with the 38.2% Fibonacci retracement.
Stop loss is at 999.86, which is a pullback resistance that aligns with the 61.8% Fibonacci retracement.
Take profit is at 908.57, which is a pullback support.
High Risk Investment Warning
Trading Forex/CFDs on margin carries a high level of risk and may not be suitable for all investors. Leverage can work against you.
Stratos Markets Limited (tradu.com ):
CFDs are complex instruments and come with a high risk of losing money rapidly due to leverage. 65% of retail investor accounts lose money when trading CFDs with this provider. You should consider whether you understand how CFDs work and whether you can afford to take the high risk of losing your money.
Stratos Europe Ltd (tradu.com ):
CFDs are complex instruments and come with a high risk of losing money rapidly due to leverage. 66% of retail investor accounts lose money when trading CFDs with this provider. You should consider whether you understand how CFDs work and whether you can afford to take the high risk of losing your money.
Stratos Global LLC (tradu.com ):
Losses can exceed deposits.
Please be advised that the information presented on TradingView is provided to Tradu (‘Company’, ‘we’) by a third-party provider (‘TFA Global Pte Ltd’). Please be reminded that you are solely responsible for the trading decisions on your account. There is a very high degree of risk involved in trading. Any information and/or content is intended entirely for research, educational and informational purposes only and does not constitute investment or consultation advice or investment strategy. The information is not tailored to the investment needs of any specific person and therefore does not involve a consideration of any of the investment objectives, financial situation or needs of any viewer that may receive it. Kindly also note that past performance is not a reliable indicator of future results. Actual results may differ materially from those anticipated in forward-looking or past performance statements. We assume no liability as to the accuracy or completeness of any of the information and/or content provided herein and the Company cannot be held responsible for any omission, mistake nor for any loss or damage including without limitation to any loss of profit which may arise from reliance on any information supplied by TFA Global Pte Ltd.
The speaker(s) is neither an employee, agent nor representative of Tradu and is therefore acting independently. The opinions given are their own, constitute general market commentary, and do not constitute the opinion or advice of Tradu or any form of personal or investment advice. Tradu neither endorses nor guarantees offerings of third-party speakers, nor is Tradu responsible for the content, veracity or opinions of third-party speakers, presenters or participants.

BNB HIGH PROBABILITY SETUP SOON!!!🚨 BNB HIGH PROBABILITY BUY SETUP 🚨
* Here We Can See Clearly The Next Potential Move For BNB Coming Hours/Days.
* Keep Your Eyes Close On Your Trading Positions.
* Happy PIP Hunting Traders.
FXKILLA.

BNB Fuel Bullish MomentumBNBUSD took support near 55- 4H EMA and showed a nice pullback on positive developments. It hits an intraday high of $1034.90 and is currently trading around $1034.20.
Significant expansion for BNB Chain is possible thanks to corporate treasury adoption, real-world asset (RWA) tokenization, and infrastructure improvements. Planned improvements hope to cut transaction costs in half and increase performance tenfold by 2026; recent Maxwell and Lorentz hard forks are already lowering block times to 0.75 seconds and gas fees to $0.001. Its position as a top Layer-1 with $369.2 billion in 30-day DEX trading volume and more than 5,000 is further enhanced. Corporations like Nano Labs and Windtree, along with institutional interest from groups like B Strategy, are adopting dApps that help to create a supply-demand mismatch by lowering the liquid supply on exchanges. With alliances including Securitize, VanEck, and Ondo Finance, and a $14 billion TVL top, BNB Chain's foray into RWA tokenization is also broadening use, maybe driving BNB prices toward analyst targets of $1,500–$2,000 as these triggers combine to boost institutional demand, real-world applications, and developer activity.
Short-term trend remains bullish as long as support $867 (365 4H EMA) holds. It trades above the 55,200 and 365 EMA on the 4-hour chart. Near-term support is around $989; any close below targets $960/$940/$928/$900/$865/$845/$810/$780/$755/$740. If the pair closes below $500, it potentially leads to further declines towards $400.
Immediate Resistance is at $1035.Any breakout above this resistance confirms bullish momentum and a jump towards $1050/$1100/$1150.
Indicators ( 4-Hour Chart)
Directional Movement Index: Bullish
CCI (50): Bullish
Trading Strategy
It is good to buy on dips around $1000 with a stop-loss set at $960 and a target price of $1150.

I'm shorting $BNB here, guys...📉 ... We just had our first touch at the 1.618 Fibonacci extension — around $1,006 — and I seriously doubt it’s going to break through cleanly and fly into price discovery. 🚫📈
📊 Weekly chart looks extremely extended, and this Fib level is a classic reversal zone.
No clear volume support above, and the rally looks overextended.
⚠️ Risk is asymmetric here — I’m betting on the first rejection.
If I’m wrong, I’ll cut quick.
But if I’m right, we might catch a nasty drop from the top. 💥
🔎 Let’s see how this plays out.

BNB - short in a case of a BULL trapBNB - short in a case of a BULL trap
Coin alreadyy did 100% rise
also Oi started dropping that;s often a signal for range creation or a pullback

BNB/USDT | BNB Bull Run Continues – No Signs of Correction Yet!By analyzing the Binance Coin (BNB) chart on the weekly (logarithmic) timeframe, we can see that the price has set a new ATH above $1,000. Since the last time I analyzed BNB — over 2 years ago — the price has increased by more than 400%!
Currently, BNB is trading around $1,060, and there are still no signs of a correction on the chart. With the current momentum, I expect further growth, possibly pushing the price to levels above $1,200. This analysis will be updated again!
Please support me with your likes and comments to motivate me to share more analysis with you and share your opinion about the possible trend of this chart with me !
Best Regards , Arman Shaban

$ASTER to $4 - CZ would like thisMost of you have forgotten what happened with CAKE (biggest DEX on BSC) last cycle.
CAKE has gone from $3 million mcap to $6.6 billion mcap for 5/6 months. At that point of time biggest DEX and competitor to Pancakeswap was Uniswap which grew in the same time from $500 million mcap to $21.5 billion mcap (ATH)
Now we can see similar pattern. Just that Hyperliquid has been live already for a whole year.
-> This means BCS competitor doesn't have the same time to boost their token and will do it much faster.
Hype is trading around $17 and $20 billion mcap and there is still some time to break it's ATH mcap.
Very similar mcap as Uniswap at it's ATH moment.
Now with CZ backing personally ASTER and taking the $1000 per BNB moment, I see huge potential in the token price and both the fundamentals behind - ASTER exchange performance.
Minimum mcap of ASTER which I am looking to sell is same as in past cycle CAKE ATH mcap - $6.6 billion, which means at 1.65 billion tokens in circulation exactly $4 price per ASTER.
CZ's favourite number :)
1.65 billion tokens in circulation but if you take in consideration that 94% of total tokens are in founders hands, only 480 million tokens stay in real circulation. This means that pumping the token is much easier and needs less buy volume.
From the low info the graph gives us, we can predict the Fib levels.
BNB; ATHHello friends
Given the recent growth we have had, the price has formed a double top pattern and is in the specified support areas, we can expect the price to be supported until the specified targets.
*Trade safely with us*
