GBPUSD Channel Down targeting at least 1.3250The GBPUSD pair has been trading within a 1-month Channel Down pattern since the September 23 rejection on its 4H MA200 (orange trend-line). In fact, we are currently on the third Bearish Leg of this pattern, all of which have been initiated by 4H MA200 rejections.
We expect the price to target at least 1.3250, where it might technically rebound due to the presence of the 1D MA200 (red trend-line). If it breaks though, we can see a -2.07% standard Bearish Leg extension to 1.32000, which would make a perfect technical Lower Low at the bottom of the Channel Down.
-------------------------------------------------------------------------------
** Please LIKE 👍, FOLLOW ✅, SHARE 🙌 and COMMENT ✍ if you enjoy this idea! Also share your ideas and charts in the comments section below! This is best way to keep it relevant, support us, keep the content here free and allow the idea to reach as many people as possible. **
-------------------------------------------------------------------------------
💸💸💸💸💸💸
👇 👇 👇 👇 👇 👇
J-USD

USDCHF: Next important zone! Hello Traders,
Purple trend-line is actually a SL-Hunt.
Open a short after confirmation!
Or you can wait for a break and then enter in an FVG!
Have a nice trade!

EURUSD; Short is possible now! Daily chart reveals that more possible bearish days could be ahead.
1- reaction to the top of the channel.
2- unable to make new HH.
Regarding
1- the volume gap,
2- Candles power
3- # of reactions
this zone is powerful enough for me to be considered as a sell zone.

EURUSD Short: Setup After Fake Breakout and Supply RejectionHello, traders! The market for EURUSD has been developing within a well-defined descending structure, characterized by lower highs and consistent rejection from the upper supply levels. After the earlier breakout from the falling wedge formation, the price transitioned into a broad consolidation range between the 1.1720 Supply Zone and the 1.1545 Demand Zone. This structure represents a balanced market phase, where buyers and sellers are testing control over short-term direction.
Currently, the price has once again approached the upper boundary of the range — the 1.1720 Supply Level — and faced a clear rejection. This move suggests that sellers are still defending this zone and that the market remains trapped within the broader consolidation phase.
My scenario anticipates a continuation of the decline from the Supply Zone.
The recent rejection confirms the presence of strong selling interest and indicates that the next likely move will be a rotation back toward the Demand Zone near 1.1545. Therefore, I’m watching for continued bearish momentum, with the take-profit target placed at 1.1545, in alignment with the lower boundary of the range. Manage your risk.

BTCUSD H1 | Price Approaching 61.8% Fibonacci ResistanceBased on the H1 chart analysis, we could see the price rise to the sell entry which is a pullback resistance that aligns with the 61.8% Fibonacci retracement and could reverse from this level to the downside.
Sell entry is at 111,337.31, which is a pullback resistance that aligns with the 61.8% Fibonacci retracement.
Stop loss is at 113,598.16, which is a pullback resistance.
Take profit is at 104,475.94, which is a swing low support.
Stratos Markets Limited (tradu.com ):
CFDs are complex instruments and come with a high risk of losing money rapidly due to leverage. 68% of retail investor accounts lose money when trading CFDs with this provider. You should consider whether you understand how CFDs work and whether you can afford to take the high risk of losing your money.
Stratos Europe Ltd (tradu.com ):
CFDs are complex instruments and come with a high risk of losing money rapidly due to leverage. 70% of retail investor accounts lose money when trading CFDs with this provider. You should consider whether you understand how CFDs work and whether you can afford to take the high risk of losing your money.

EURUSD: Bearish Continuation Setup Within Broadening PatternHello everyone, here’s my breakdown of the current Euro setup.
Market Analysis
From a broader perspective, EUR/USD has been trading within a broadening formation, characterized by expanding highs and lows — a classic sign of increasing volatility and market indecision.
The key event that has defined the recent structure was a fake breakout above the 1.1757 resistance zone. After briefly pushing higher, the price was strongly rejected, indicating clear seller dominance and triggering a shift back into a bearish phase. Since then, price action has developed multiple range-bound consolidations followed by bearish breakouts, confirming that sellers continue to control momentum.
My Scenario & Strategy
Currently, the pair is pulling back after another breakout to the downside, trading just below the broadening resistance line. In my view, this recovery is a corrective rally rather than a reversal — it’s likely to face renewed selling pressure as it approaches the resistance area. I’m watching for a rejection confirmation around the upper boundary of the pattern. If that rejection holds, it would validate the short scenario and potentially trigger a continuation move toward the 1.1555 support zone — the lower boundary of the formation.
The broader structure remains bearish, and as long as EUR/USD stays below 1.1700, short setups are favored. A confirmed rejection could open the way for another wave of selling toward the next key support at 1.1555.
That's the setup I'm tracking. Thank you for your attention, and always manage your risk.

Bearish reversal off major resistance?WTI Oil (XTI/USD) is rising towards the pivot, which is an overlap resistance and could reverse to the 1st support.
Pivot: 62.10
1st Support: 58.37
1st Resistance: 64.66
Disclaimer:
The above opinions given constitute general market commentary, and do not constitute the opinion or advice of IC Markets or any form of personal or investment advice.
Any opinions, news, research, analyses, prices, other information, or links to third-party sites contained on this website are provided on an "as-is" basis, are intended only to be informative, is not an advice nor a recommendation, nor research, or a record of our trading prices, or an offer of, or solicitation for a transaction in any financial instrument and thus should not be treated as such. The information provided does not involve any specific investment objectives, financial situation and needs of any specific person who may receive it. Please be aware, that past performance is not a reliable indicator of future performance and/or results. Past Performance or Forward-looking scenarios based upon the reasonable beliefs of the third-party provider are not a guarantee of future performance. Actual results may differ materially from those anticipated in forward-looking or past performance statements. IC Markets makes no representation or warranty and assumes no liability as to the accuracy or completeness of the information provided, nor any loss arising from any investment based on a recommendation, forecast or any information supplied by any third-party.

Bullish reevrsal off pullback support?The Aussie (AUD/USD) could fall towards the pivot and could bounce to the 1st resistance which acts as a multi swing high resistance.
Pivot: 0.6500
1st Support: 0.6486
1st Resistance: 0.6522
Disclaimer:
The above opinions given constitute general market commentary, and do not constitute the opinion or advice of IC Markets or any form of personal or investment advice.
Any opinions, news, research, analyses, prices, other information, or links to third-party sites contained on this website are provided on an "as-is" basis, are intended only to be informative, is not an advice nor a recommendation, nor research, or a record of our trading prices, or an offer of, or solicitation for a transaction in any financial instrument and thus should not be treated as such. The information provided does not involve any specific investment objectives, financial situation and needs of any specific person who may receive it. Please be aware, that past performance is not a reliable indicator of future performance and/or results. Past Performance or Forward-looking scenarios based upon the reasonable beliefs of the third-party provider are not a guarantee of future performance. Actual results may differ materially from those anticipated in forward-looking or past performance statements. IC Markets makes no representation or warranty and assumes no liability as to the accuracy or completeness of the information provided, nor any loss arising from any investment based on a recommendation, forecast or any information supplied by any third-party.

Bullish continuation?USD/JPY is falling towards the pivot which acts as a pullback suport and could bounce to the 1st resistance.
Pivot: 152.13
1st Support: 151.53
1st Resistance: 153.12
Disclaimer:
The above opinions given constitute general market commentary, and do not constitute the opinion or advice of IC Markets or any form of personal or investment advice.
Any opinions, news, research, analyses, prices, other information, or links to third-party sites contained on this website are provided on an "as-is" basis, are intended only to be informative, is not an advice nor a recommendation, nor research, or a record of our trading prices, or an offer of, or solicitation for a transaction in any financial instrument and thus should not be treated as such. The information provided does not involve any specific investment objectives, financial situation and needs of any specific person who may receive it. Please be aware, that past performance is not a reliable indicator of future performance and/or results. Past Performance or Forward-looking scenarios based upon the reasonable beliefs of the third-party provider are not a guarantee of future performance. Actual results may differ materially from those anticipated in forward-looking or past performance statements. IC Markets makes no representation or warranty and assumes no liability as to the accuracy or completeness of the information provided, nor any loss arising from any investment based on a recommendation, forecast or any information supplied by any third-party.

what is happening wiyth xauusd?1. Fundamental Analysis (Macro Drivers)
🏦 Monetary Policy & Interest Rates
Federal Reserve stance: The Fed has paused rate hikes amid slowing US growth and moderating inflation. Real yields have begun to fall, which supports gold prices.
Market expectation: Traders now expect possible rate cuts in early 2026, lowering opportunity costs of holding non-yielding assets like gold.
Impact: Lower real yields → bullish for gold.
💵 US Dollar Trends
The US Dollar Index (DXY) has weakened over the last quarter due to rate-cut bets and growing fiscal deficits.
A weaker dollar directly lifts XAU/USD since gold is priced in USD.
📈 Inflation & Recession Fears
Despite softening inflation (US CPI ~3.2%), sticky services inflation and fiscal pressures maintain gold’s appeal as a hedge.
Global growth is fragile, and recession fears (notably in Europe and Japan) have increased safe-haven demand.
🌍 Geopolitical & Structural Factors
Escalating geopolitical tensions (Eastern Europe, South China Sea, Middle East) and US election uncertainty have driven institutional and central bank gold buying.
Central banks (notably China, India, and Turkey) are diversifying away from the USD — net gold purchases are at multi-year highs.
🏦 Central Bank Gold Demand
According to the World Gold Council, 2025 central bank purchases are on pace for another record year.
This provides a floor for gold prices even during corrective phases.
📊 Fundamental Outlook Summary
Factor Current Status Gold Impact
Fed Policy / Yields Dovish bias ✅ Bullish
US Dollar Weakening ✅ Bullish
Inflation Moderate but sticky ✅ Bullish
Geopolitical Risk Elevated ✅ Bullish
Central Bank Demand Strong ✅ Bullish
Global Growth Slowing ✅ Bullish
🔎 Overall Fundamental Bias: Strongly Bullish (Short-to-Medium Term)
📉 2. Technical Analysis (as of Oct 23 2025)
🔹 Current Price
XAU/USD ≈ $4,340/oz (TradingEconomics, Oct 20 2025)
🔹 Trend Overview
Long-term uptrend since early 2024 continues.
Gold broke out from a multi-decade ascending channel earlier this year and now trades well above 200-day moving average.
🔹 Moving Averages
Indicator Value Signal
20-day MA $4,215 ✅ Bullish
50-day MA $4,030 ✅ Bullish
100-day MA $3,740 ✅ Bullish
200-day MA $3,290 ✅ Bullish
→ All MAs are aligned in a bullish configuration (short-term > long-term).
🔹 RSI (Relative Strength Index)
RSI ≈ 78 → Indicates overbought conditions → risk of short-term correction or consolidation before further rally.
🔹 Key Levels
Type Level (USD/oz) Note
Resistance 1 $4,400 Recent high
Resistance 2 $4,500 Psychological round level
Support 1 $4,200 Short-term support
Support 2 $3,950 Strong support (previous breakout zone)
Support 3 $3,700 Long-term support / 100-DMA
🔹 Chart Pattern
Ascending channel with potential breakout continuation.
Some analysts note a rising wedge, signaling possible short-term exhaustion.
🔹 Volume & Momentum
Volume peaked on breakout above $4,000 — confirming strong institutional participation.
Momentum indicators show minor divergence → watch for short-term pullback.
📊 3. Combined Outlook
Horizon Technical Bias Fundamental Bias Combined View
Short-Term (1–3 weeks) ⚠️ Overbought – possible pullback to $4,150–4,200 ✅ Bullish Consolidation likely before next leg up
Medium-Term (1–3 months) ✅ Uptrend intact ✅ Bullish Buy on dips strategy favored
Long-Term (6–12 months) ✅ Strong uptrend ✅ Bullish Targets $4,500–$5,000 possible
🪙 4. Scenario Analysis
Scenario Trigger Likely Outcome
Bullish Continuation Fed confirms 2026 rate cuts, DXY weakens Gold → $4,500+
Short-Term Correction RSI reset, USD rebound Pullback to $4,100–$4,200
Bearish Reversal Sharp rise in yields or risk-on sentiment Gold retests $3,700–$3,900
🧩 5. Trading/Investment Insights
Short-term traders: Watch for retracement toward $4,150–$4,200 to consider buy setups.
Swing traders: Maintain partial longs; trail stops below $4,000.
Investors: Maintain core exposure; gold remains a hedge against macro and geopolitical volatility.

ETHUSD H1 | Possible Bearish Turn Ahead”ETH/USD is rising towards the sell entry, which is a pullback resistance that is slightly above the 50% Fibonacci retracement and could reverse from this levle to the downside.
Sell entry is at 3,936.30, which is a pullback resistance that is slightly above the 50% Fibonacci retracement.
Stop loss is at 4,079.07, which is a pullback resistance.
Take profit is at 3,703.89, which is a multi-swing low support.
Stratos Markets Limited (tradu.com ):
CFDs are complex instruments and come with a high risk of losing money rapidly due to leverage. 68% of retail investor accounts lose money when trading CFDs with this provider. You should consider whether you understand how CFDs work and whether you can afford to take the high risk of losing your money.
Stratos Europe Ltd (tradu.com ):
CFDs are complex instruments and come with a high risk of losing money rapidly due to leverage. 70% of retail investor accounts lose money when trading CFDs with this provider. You should consider whether you understand how CFDs work and whether you can afford to take the high risk of losing your money.

SOLUSD H1 | Bearish Reversal from Pullback ResistanceSOL/USD is rising towards the sell entry which is a pullback resistance that aligns with the 61.8% Fibonacci retracement and could reverse from this level to the downside.
Sell entry is at 190.50, which is a pullback resistance that aligns with the 61.8% Fibonacci retracement.
Stop loss is at 198.02, which is an overlap resistance.
Take profit is at 175.45, which is a swing low support.
Stratos Markets Limited (tradu.com ):
CFDs are complex instruments and come with a high risk of losing money rapidly due to leverage. 68% of retail investor accounts lose money when trading CFDs with this provider. You should consider whether you understand how CFDs work and whether you can afford to take the high risk of losing your money.
Stratos Europe Ltd (tradu.com ):
CFDs are complex instruments and come with a high risk of losing money rapidly due to leverage. 70% of retail investor accounts lose money when trading CFDs with this provider. You should consider whether you understand how CFDs work and whether you can afford to take the high risk of losing your money.

DOGEUSD H1 | Bullish Momentum BuildingThe price could fall towards the buy entry, which is a pullback support and could rise from this level to the upside.
Buy entry is at 0.1903, which is a pullbakc support.
Stop loss is at 0.2064, which is an overlap resistance.
Take profit is at 0.2178, which is a swing high resistance.
Stratos Markets Limited (tradu.com ):
CFDs are complex instruments and come with a high risk of losing money rapidly due to leverage. 68% of retail investor accounts lose money when trading CFDs with this provider. You should consider whether you understand how CFDs work and whether you can afford to take the high risk of losing your money.
Stratos Europe Ltd (tradu.com ):
CFDs are complex instruments and come with a high risk of losing money rapidly due to leverage. 70% of retail investor accounts lose money when trading CFDs with this provider. You should consider whether you understand how CFDs work and whether you can afford to take the high risk of losing your money.

BNBUSD H1 | Signs of a Bullish ReversalBNB/USD could fall towards the buy entry, which is a pullbakc support and could bounce from this level to the upside.
Buy entry is at 1,082.13, which is a pullback support.
Stop loss is at 1,035.10, which is a swing low support.
Take profit is at 1,148.71, which is an overlap resistance.
Stratos Markets Limited (tradu.com ):
CFDs are complex instruments and come with a high risk of losing money rapidly due to leverage. 68% of retail investor accounts lose money when trading CFDs with this provider. You should consider whether you understand how CFDs work and whether you can afford to take the high risk of losing your money.
Stratos Europe Ltd (tradu.com ):
CFDs are complex instruments and come with a high risk of losing money rapidly due to leverage. 70% of retail investor accounts lose money when trading CFDs with this provider. You should consider whether you understand how CFDs work and whether you can afford to take the high risk of losing your money.

BCHUSD M30 | Potential Upside MoveBCHUSD has reacted off the buy entry, which is a pullback support and could rise from this levle to the upside.
Buy entry is at 475.84, whichis a pullback support.
Stop loss is at 463.77, which is a multi-swing low support.
Take profit is at 500.15, which is a pullback resistance.
Stratos Markets Limited (tradu.com/uk ):
CFDs are complex instruments and come with a high risk of losing money rapidly due to leverage. 68% of retail investor accounts lose money when trading CFDs with this provider. You should consider whether you understand how CFDs work and whether you can afford to take the high risk of losing your money.
Stratos Europe Ltd (tradu.com/eu ):
CFDs are complex instruments and come with a high risk of losing money rapidly due to leverage. 70% of retail investor accounts lose money when trading CFDs with this provider. You should consider whether you understand how CFDs work and whether you can afford to take the high risk of losing your money.

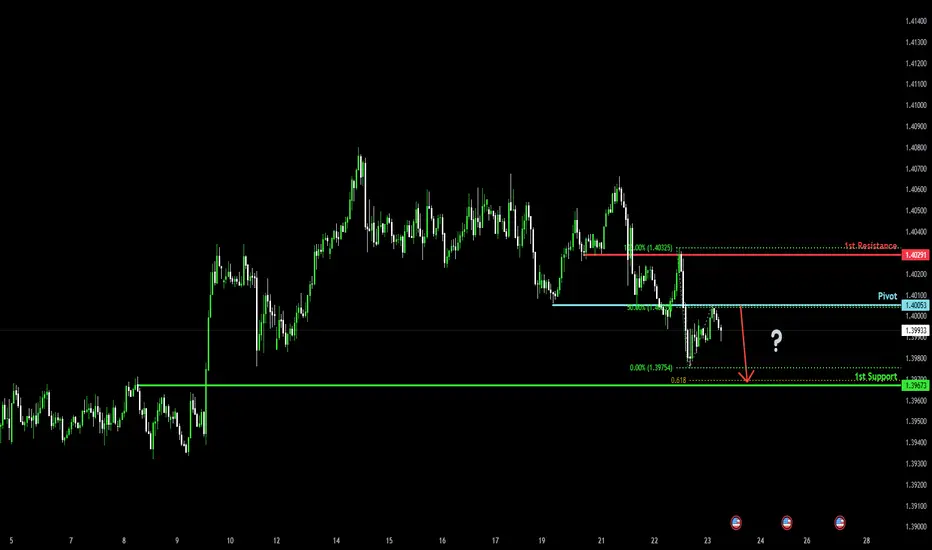
Bearish reversal off 50% Fibonacci resistance?The Loonie (USD/CAD) has rejected off the pivot, which acts as a pullback resistance that aligns with the 50% Fibonacci retracement and could drop to the 1st support.
Pivot: 1.4005
1st Support: 1.3967
1st Resistance: 1.4029
Disclaimer:
The above opinions given constitute general market commentary, and do not constitute the opinion or advice of IC Markets or any form of personal or investment advice.
Any opinions, news, research, analyses, prices, other information, or links to third-party sites contained on this website are provided on an "as-is" basis, are intended only to be informative, is not an advice nor a recommendation, nor research, or a record of our trading prices, or an offer of, or solicitation for a transaction in any financial instrument and thus should not be treated as such. The information provided does not involve any specific investment objectives, financial situation and needs of any specific person who may receive it. Please be aware, that past performance is not a reliable indicator of future performance and/or results. Past Performance or Forward-looking scenarios based upon the reasonable beliefs of the third-party provider are not a guarantee of future performance. Actual results may differ materially from those anticipated in forward-looking or past performance statements. IC Markets makes no representation or warranty and assumes no liability as to the accuracy or completeness of the information provided, nor any loss arising from any investment based on a recommendation, forecast or any information supplied by any third-party.
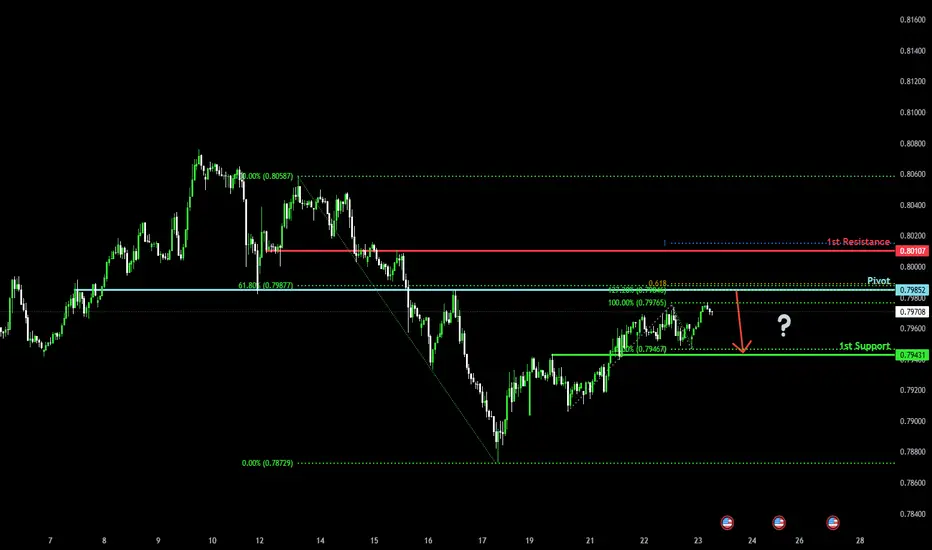
Bearish reversal off Fibonacci confluence?The Swissie (USD/CHF) is rising towards the pivot and could reverse to the 1st support.
Pivot: 0.7985
1st Support: 0.7943
1st Resistance: 0.8010
Disclaimer:
The above opinions given constitute general market commentary, and do not constitute the opinion or advice of IC Markets or any form of personal or investment advice.
Any opinions, news, research, analyses, prices, other information, or links to third-party sites contained on this website are provided on an "as-is" basis, are intended only to be informative, is not an advice nor a recommendation, nor research, or a record of our trading prices, or an offer of, or solicitation for a transaction in any financial instrument and thus should not be treated as such. The information provided does not involve any specific investment objectives, financial situation and needs of any specific person who may receive it. Please be aware, that past performance is not a reliable indicator of future performance and/or results. Past Performance or Forward-looking scenarios based upon the reasonable beliefs of the third-party provider are not a guarantee of future performance. Actual results may differ materially from those anticipated in forward-looking or past performance statements. IC Markets makes no representation or warranty and assumes no liability as to the accuracy or completeness of the information provided, nor any loss arising from any investment based on a recommendation, forecast or any information supplied by any third-party.
USD/JPY(20251023)Today's AnalysisMarket News:
The shutdown continues, and the US Senate has rejected the temporary funding bill for the 12th time.
Technical Analysis:
Today's buy/sell levels:
151.83
Support and resistance levels:
152.38
152.17
152.04
151.61
151.48
151.27
Trading Strategy:
If the stock breaks above 152.04, consider buying, with the first target price being 152.17.
If the stock breaks below 151.83, consider selling, with the first target price being 151.61.

USD/JPY – Buy Entry (H1- Channel Breakout Pattern)
The USD/JPY Pair, Price has been trading within a Channel Breakout Pattern on the H1 chart, forming consistent higher highs and higher lows. Price action is now testing the upper boundary of the Pattern, signalling a possible breakout. FX:USDJPY
✅Market Context:
1️⃣Strong Upward Structure Inside the Pattern.
2️⃣Buyers are showing strength near Resistance.
3️⃣Breakout above the Trendline indicates Momentum continuation toward higher zones.
✅Trade Plan:
Entry: Buy after Confirmed Breakout above the Resistance (H1 candle close above trendline or retest of the breakout).
💰Take Profit (TP): At the Key Zone – a Major Resistance area identified ahead.
🛑Stop Loss (SL): Below the Pattern Structure.
✅Psychological Discipline :
1️⃣Stick to plan – No Revenge Trades.
2️⃣Accept losing trades as Part of the Strategy.
3️⃣Risk only 1–2% of your account balance per trade.
💬 Support the community: If you found this useful, drop a 👍 like and share your thoughts in the comments!
⚠️ Disclaimer: This analysis is for educational purposes only and does not constitute financial advice. Forex trading involves high risk. Trade only with capital you can afford to lose and always do your own research.

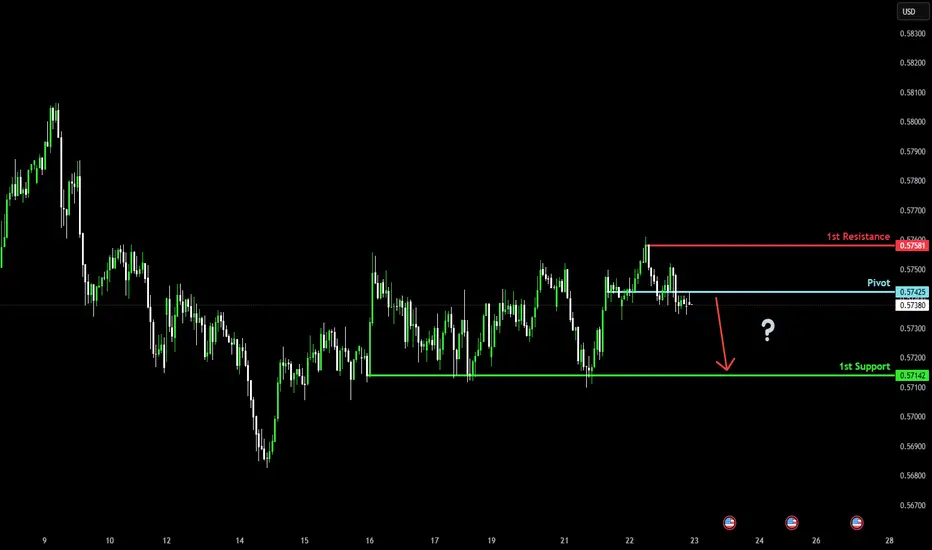
Bearish reversal?The kiwi (NZD/USD) is reacting off the pivot which is a pullback resistance, and could drop to the 1st support which is a multi-swing low support.
Pivot: 0.5742
1st Support: 0.5714
1st Resistance: 0.5758
Disclaimer:
The above opinions given constitute general market commentary, and do not constitute the opinion or advice of IC Markets or any form of personal or investment advice.
Any opinions, news, research, analyses, prices, other information, or links to third-party sites contained on this website are provided on an "as-is" basis, are intended only to be informative, is not an advice nor a recommendation, nor research, or a record of our trading prices, or an offer of, or solicitation for a transaction in any financial instrument and thus should not be treated as such. The information provided does not involve any specific investment objectives, financial situation and needs of any specific person who may receive it. Please be aware, that past performance is not a reliable indicator of future performance and/or results. Past Performance or Forward-looking scenarios based upon the reasonable beliefs of the third-party provider are not a guarantee of future performance. Actual results may differ materially from those anticipated in forward-looking or past performance statements. IC Markets makes no representation or warranty and assumes no liability as to the accuracy or completeness of the information provided, nor any loss arising from any investment based on a recommendation, forecast or any information supplied by any third-party.
Bullish bounce for the Cable?The price is falling towards the pivot which is a pullback support that aligns with the 50% Fibonacci retracement and could bounce to the 1st resistance, which acts as an overlap resistance.
Pivot: 1.3344
1st Support: 1.3310
1st Resistance: 1.3393
Disclaimer:
The above opinions given constitute general market commentary, and do not constitute the opinion or advice of IC Markets or any form of personal or investment advice.
Any opinions, news, research, analyses, prices, other information, or links to third-party sites contained on this website are provided on an "as-is" basis, are intended only to be informative, is not an advice nor a recommendation, nor research, or a record of our trading prices, or an offer of, or solicitation for a transaction in any financial instrument and thus should not be treated as such. The information provided does not involve any specific investment objectives, financial situation and needs of any specific person who may receive it. Please be aware, that past performance is not a reliable indicator of future performance and/or results. Past Performance or Forward-looking scenarios based upon the reasonable beliefs of the third-party provider are not a guarantee of future performance. Actual results may differ materially from those anticipated in forward-looking or past performance statements. IC Markets makes no representation or warranty and assumes no liability as to the accuracy or completeness of the information provided, nor any loss arising from any investment based on a recommendation, forecast or any information supplied by any third-party.

Bullish reevrsal?The Fiber (EUR/USD) has bounced off the pivot which is a pullback support and could rise to the 1st resistance.
Pivot: 1.1591
1st Support: 1.1543
1st Resistance: 1.1648
Disclaimer:
The above opinions given constitute general market commentary, and do not constitute the opinion or advice of IC Markets or any form of personal or investment advice.
Any opinions, news, research, analyses, prices, other information, or links to third-party sites contained on this website are provided on an "as-is" basis, are intended only to be informative, is not an advice nor a recommendation, nor research, or a record of our trading prices, or an offer of, or solicitation for a transaction in any financial instrument and thus should not be treated as such. The information provided does not involve any specific investment objectives, financial situation and needs of any specific person who may receive it. Please be aware, that past performance is not a reliable indicator of future performance and/or results. Past Performance or Forward-looking scenarios based upon the reasonable beliefs of the third-party provider are not a guarantee of future performance. Actual results may differ materially from those anticipated in forward-looking or past performance statements. IC Markets makes no representation or warranty and assumes no liability as to the accuracy or completeness of the information provided, nor any loss arising from any investment based on a recommendation, forecast or any information supplied by any third-party.

EUR/USD Hints At Swing LowA small doji formed on Wednesday, snapping a three-day losing streak for EUR/USD. The session low respected the 100-day EMA as support, while the brief dip below the monthly S1 pivot proved to be a false break.
The bias remains bullish while prices hold above the 1.1544 swing low. Bulls could look to buy dips towards the monthly S1 pivot in anticipation of a move up towards the 1.17 handle and monthly pivot point (1.1754).
Matt Simpson, Market Analyst at City Index and Forex.com
