JD.com trading at a blatant valuation discount- LONGOne of the trends taking place in my portfolio is an increased weighting in China's technology sector.
Amid the trade-driven pessimism over China, clamp down on digital assets and increased control over online content China's economy is trading at a blatant valuation discount to the U.S.
Within the last few months the BAT stocks Baidu BIDU, Alibaba BABA and Tencent TCEHY have been among the biggest losers.
The recent arrest of JD CEO Richard Liu has caused JD stocks to tumble further relative to its e-commerce peers and is now almost 50% off its 52-week high. I view this as a risk-reward profile that is heavily tilted in favor of the bull.
All indicators explained on the graph.
JD

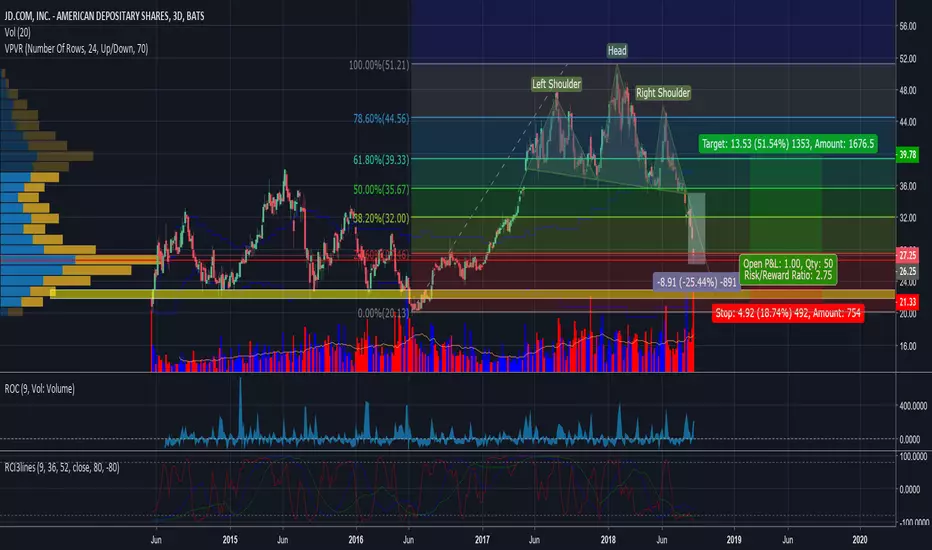
JD technical analysis*** THIS IS NOT AN ADVICE, DO YOUR RESEARCH AND TRADE WITH YOUR OWN RESPONSIBILITY***
Fundamentally, Apart from what people think about the CEO's criminal charges, contrarian thinking, that changes nothing in terms of business structure, fundamentally ly JD.com still is the second largest shopping website.
Now, let's look at the chart, the H&S pattern is fulfilled with huge volume climax, the short will close their trade soon and buyers will come in , a level like this is where bulls and bears agree with each other and that will push the price higher, 88% of the time.
Volume profile gives us a good lead on where to take profit.
*** THIS IS NOT AN ADVICE, DO YOUR RESEARCH AND TRADE WITH YOUR OWN RESPONSIBILITY***
JD Long Term Supply and Demand AnalysisPrice has reached 3M demand on JD, triggered long here on the MN.
This is a long term investment for me so I purchased the stock, will also be looking for an options trade if we start to see bullish moves on the WK chart.
Price is way too low to think about shorts, longs only!

JD.COM in trouble if you care about head and Shoulders
For me JD.com will be a nice furture investment to battle Alibaba and Amazon, but by now they just don't make any profits and the chart tells the same story.
Buying opportunity at around 20 $ for a long run up.
Just my opinion so make your own research
and like always
May the markets be with us

BABA bullish gartley patternBABA has a bullish gartley pattern here while its peer JD.com is having some troubles recently.
As it's actually not really a systematic risk on the sector but some personal affairs, it may create some buy-low opportunity for BABA.
Based on the pre-market movement, BABA currently is at the 167.00 fig spot.
Of course I have no intention to catch the falling knife, so I'll be waiting for intraday reversal sign off the open.
Even if this bullish pattern failed, 160-163 gap of BABA is still very attractive to take some long,
which will be another spot that I am interesting in potential reversal signs.
Let's see how it goes!

JD.com, will the past repeat itself. I believe $JD is good for a bounce here with a target up to near the 50 week MA(blue). As you can see in the chart, JD has had a head & shoulders neckline break very similar to one in the past. In both instances the 7, 8, and 9 candles are trending upward. Presently, this week's candle is right on the 200 week MA (yellow). Using TD_sequential, we should see a 1-4 candle correction.
I think we see this correction begin next week. As of today it looks as if a diamond bottom is forming on the daily. Also, today had a bullish cross of the macd on the daily.
I am long 31.98 average.

JB: Head and Shoulders formation in progress -10%JD is forming the right shoulder of a long term head and shoulders formation; Aug'17 left shoulder and Jan'18 head. Downside target to neckline is $34, -10%. ABCD completion from the Jan'18 peak will imply a downside target of $29, -24%.

JD thoughtsI feel this company has a good future and agree with their focus on expanding their logistics to bring better services to their clients. Without a good logistics group the system will fall apart. I would be looking for a similar pattern of a double bottom it had from April to Early June. Could last a bit longer this time as earnings are set for sometime in November.

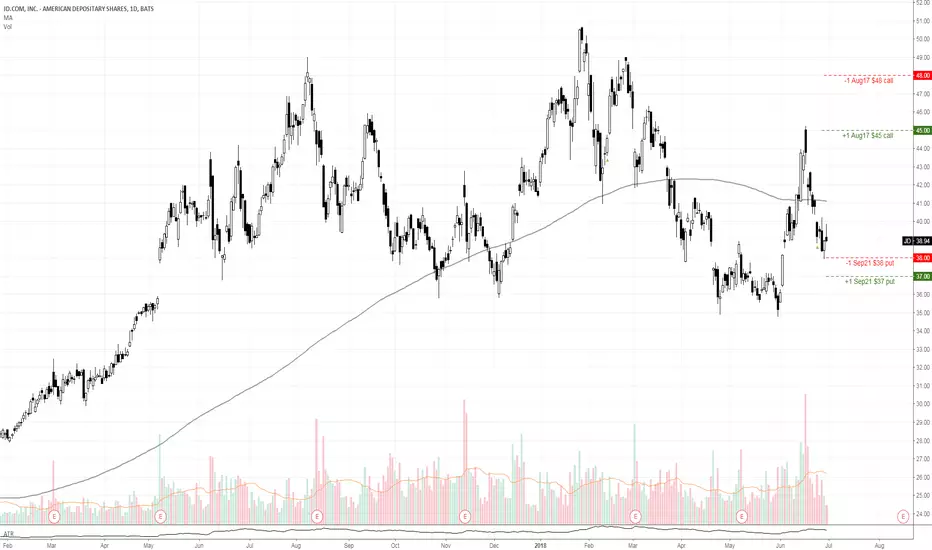
JD - JD.comEarnings coming up soon and I like JD overall. Low part of the range after a great 2017.
I went with a synthetic covered call, selling the Aug17 $39 put for $1.90 cr. This trade is around a 5% cash ROC within the next 35 days.
I'll go for 50% W or continue rolling this position out, collecting credit through time.

BABA is ready to skyrocket higher and this is why:NYSE:BABA is looking very good on multiple timeframes (4h, 1d, 1w and smaller timeframes).
I'll highlight the bigger timeframes to give the big picture.
Overall:
Baba successfully tested both the support from the bigger and smaller falling wedge. Eventually, baba broke out of the smaller falling wedge. Also, you can see bullish divergence for baba on the RSI.
4h:
Baba made a move over the lower kelt and is consolidating there. Usually, this is a bullish signal for testing at least the middle kelt.
Golden cross with the ma5 and ma10 in the making.
1d:
Daily candle closed above the lower kelt.
ma5 starting to point upwards.
1w:
1w made a hammer of the support.
Watch what the Chinese market did on Monday before the US markets start. A good close of the Chinese markets will give baba more chance to go higher.
Disclaimer:
I have a long position in Baba since last Friday, this is not an investment advice.


JD Buy Low / Sell HighJD is at a perfect buying location for a move higher for the longer term
I will be buying 6 month Call options on this stock at this entry level.


JD - JD.comTrade set up on chart. Executed for $.15 credit.
ROC: 15% (7.5% if managed at 50%), with more upside available in the call spread.
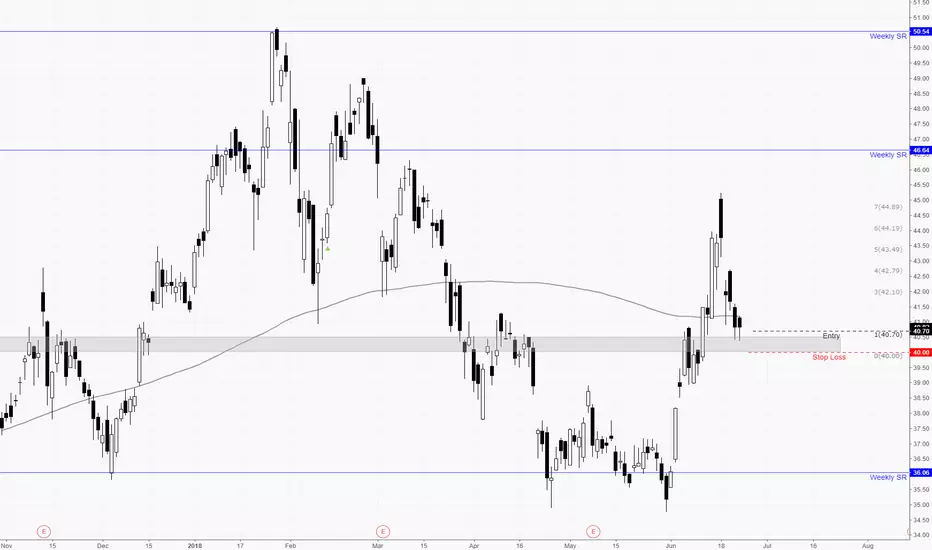
JD - JD.comJD yet again offering up a long R:R setup after pushing up the first time.
I think we can look for a re-entry around 40.70 with a stop around 40.00. If you wanted a bit more bullish conformation, you could take the trade with price moving above the last two days' highs.
I'm looking at the Aug17 $40 calls, with the plan to roll up and out in time if JD starts to move. Earnings are also right before this expiration, something to take note of.
130m chart:
China's Double TopI posted about this a while back, so wanted to reiterate given the developments abroad.
The HSI appears to have formed a double top (with a potential bull trap, too) and I suspect selling pressure may escalate.
A decisive break in price above the top would need a few weeks of closing above to invalidate the pattern. Given the negative catalysts surrounding China regarding trade, I don't see how bulls reverse this train.

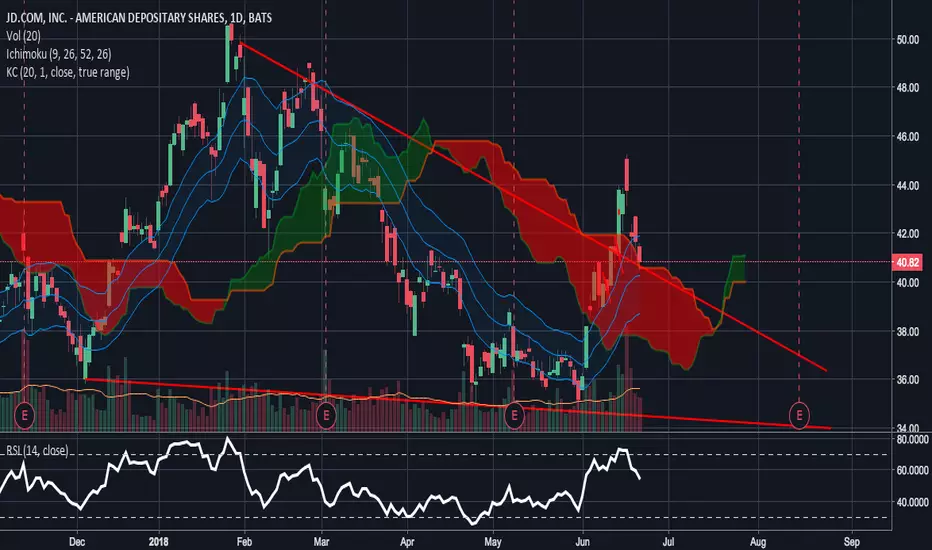
JD.com Trading China's 618 eCommerce shopping day15 June JD.com had risen along side all major technology stocks including the NDXT. The Dow Jones however had dropped and this lead me to believe that people were exiting other categories and entering into technology as a safe haven. This could also be because of the trade wars chatter between US & CN that has lead to people leaving categories that had a reliance on commodities.
I also found out that the 618 Festival that ends on the 18 June. This festival in 2017 lead to JD to achieving a record US17.6Billion in sales. A report of the 2018 sales results i'm sure would be released after the 18 June and this will drive JD's stock price up.
16 June saw the enter Technology index dropping and JD stock saw a huge drop within the first trading hour. I quickly entered as it was a better price that what I was looking at and I believe the drop was a market reaction and given that both the 15 June and 16 June were aligned with the market. I made the assumption that the potential 2018 618 result had no been factored in the existing price.
Let's see how next week goes! super excited


Buying BIDU... Right here, Right now.Shares of BIDU came under pressure because of management changes, but the selloff seems grossly overdone.
Shares are currently sitting on a massive support zone... the 50, 100, and 200 day moving averages are bundled up between $242.39-245.42. Right below those averages is the 61.8% retracement of the previous major swing, further strengthening the support. Additionally, rising trend line support is holding. Should shares decline, there's additional support at $228-230, which is the bottom of a rising channel that's reinforced with the 78.6% retracement of the aforementioned swing.
I'm a buyer right here, right now, and I'll look to add on additional weakness.

Bilateral pattern on JD: Ready to gain $10 or lose $10?JD is facing a critical point over here. After a disappointing result in Q1 (due to heavy investment on AI, logistics, etc.) JD was heavily punished by the market. There is a signal of recovery over here with a bullish divergence. The descending triangle has two opportunities. Further down movement or breaking through and moving up again.
Target upwards: 45
Target downwards: 25
Following this one.
-- Just personal doodles, no financial advice --


JD longLong via Mar16 42/48 call spread for $2.36.
POP: 41%
Max Loss: $236
Stop Loss: Price at $42
Max profit: $364
Target: $48 (will peel off here)
long 42 call: 61 delta
short 48 call: 23 delta
