$SPY & $SPX — Market-Moving Headlines Thursday Jan 29, 2026🔮 AMEX:SPY & SP:SPX — Market-Moving Headlines Thursday Jan 29, 2026
🌍 Market-Moving Themes
🏦 Fed Head Fake Absorbed
Markets shake off hawkish Powell comments as dip buyers step in late
🚗 Tesla Earnings Shock
TSLA jumps after-hours on Model 2 timing and European FSD licensing headlines
🧠 AI Capex Split Reaction
META slides on higher spending plans while suppliers stay in focus NVDA ANET
⚛️ AI Energy Undercurrent
Uranium names firm as power constraints resurface CCJ OKLO VST
📊 Macro Sensitivity Day
Labor and trade data test whether post-Fed stabilization holds
📊 Key U.S. Economic Data Thursday Jan 29 ET
8:30 AM
- Initial Jobless Claims Jan 24: 205K
- U.S. Trade Deficit Nov delayed: -42.9B
- U.S. Productivity Q3 revised: 4.9%
10:00 AM
- Wholesale Inventories Nov delayed: 0.2%
- Factory Orders Nov delayed: 1.3%
⚠️ Disclaimer: For informational purposes only. Not financial advice.
📌 #SPY #SPX #Fed #Earnings #TSLA #META #AI #Energy #Macro #Markets #Stocks #Options
JOBS

$USNFP - Non-Farm Payrolls (November/2025)ECONOMICS:USNFP
November/2025
source: U.S. Bureau of Labor Statistics
- U.S job growth totaled 64K in November, compared with a 105K loss in October and market expectations of a 50K increase.
Employment rose in health care and construction, while federal government continued to lose jobs.
Meanwhile, the unemployment rate rose to 4.6%, more than expected.

$SPY $SPX Scenarios — Friday, Nov 7, 2025🔮 AMEX:SPY SP:SPX Scenarios — Friday, Nov 7, 2025 🔮
🌍 Market-Moving Headlines
🚩 Jobs Day: The October Employment Report headlines Friday, with payrolls expected at -60,000 and the unemployment rate rising to 4.5% — signaling labor market cooling.
📉 Policy implications: A weak print would reinforce expectations for multiple rate cuts in early 2026, while upside surprises could stall the dovish momentum.
💬 Fed watch: Morning remarks from Williams and Jefferson set the tone before the data drop; Miran rounds out the week with a late-day speech.
⚠️ Shutdown delays: The Employment Report and related labor metrics are at risk of delay pending government data releases, adding uncertainty to Friday’s open.
📊 Sentiment & credit check: U-Mich Consumer Sentiment and Consumer Credit round out the macro picture.
📊 Key Data and Events (ET)
⏰ 3:00 AM — John Williams (NY Fed) speech
⏰ 7:00 AM — Philip Jefferson (Fed Vice Chair) speech
⏰ 🚩 8:30 AM — U.S. Employment Report (Oct) — subject to delay
• Nonfarm Payrolls: -60,000
• Unemployment Rate: 4.5%
• Hourly Wages (MoM): 0.3%
⏰ 10:00 AM — UMich Consumer Sentiment (Prelim, Nov) | 53.0 expected
⏰ 3:00 PM — Consumer Credit (Sept) | $10.0B expected
⏰ 3:00 PM — Stephen Miran (Fed Gov) speech
⚠️ Note:
The Employment Report, Unemployment Rate, and Wage Data are flagged at risk of delay due to the government shutdown. All other releases are expected on time. Market volatility will hinge on whether the data prints or is postponed.
⚠️ Disclaimer: Educational and informational only — not financial advice.
📌 #trading #stockmarket #SPY #SPX #JobsReport #NFP #Fed #Jefferson #Williams #inflation #yields #macro #shutdown

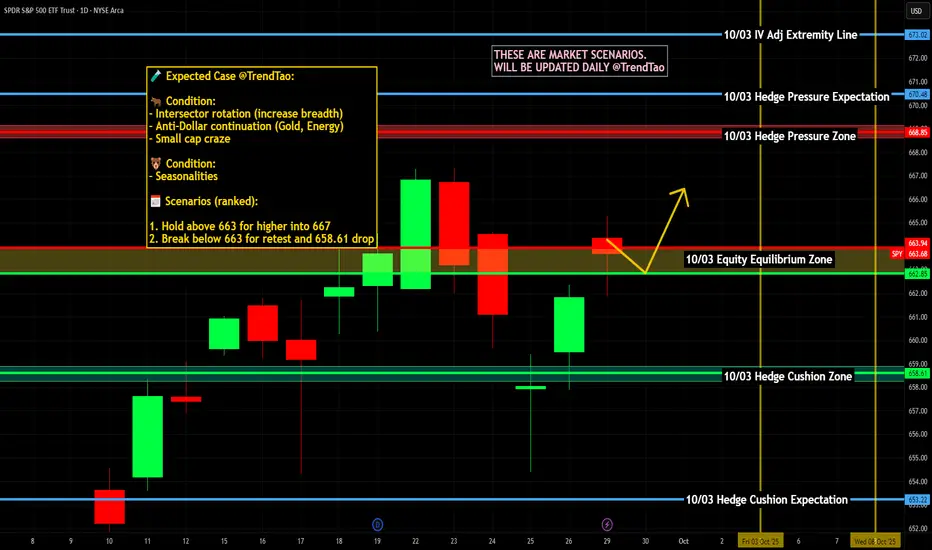
$SPY / $SPX Scenarios — Tuesday, Sept 30, 2025🔮 AMEX:SPY / SP:SPX Scenarios — Tuesday, Sept 30, 2025 🔮
🌍 Market-Moving Headlines
📉 Q3 closeout: Last trading day of September = quarter-end rebalancing flows in equities and bonds.
💵 Fed watch: Multiple Fed speakers across the day keep policy tone in focus.
💻 Mega-cap drift: NASDAQ:AAPL , NASDAQ:MSFT , NASDAQ:NVDA leadership remains sensitive to yields + growth data.
📊 Key Data & Events (ET)
⏰ 🚩 9:00 AM — S&P Case-Shiller Home Price Index (Jul, 20-city)
⏰ 🚩 10:00 AM — JOLTS Job Openings (Aug)
⏰ 🚩 10:00 AM — Consumer Confidence (Sep, Conf. Board)
⏰ 9:45 AM — Chicago PMI (Sep)
🗣️ Fed Speakers:
• 6:00 AM — Philip Jefferson (Fed Vice Chair)
• 9:00 AM — Susan Collins (Boston Fed)
• 1:30 PM — Austan Goolsbee (Chicago Fed)
• 3:30 PM — Austan Goolsbee (Chicago Fed, TV appearance)
⚠️ Disclaimer: Educational/informational only — not financial advice.
📌 #trading #stockmarket #SPY #SPX #Fed #Powell #JOLTS #ConsumerConfidence #CaseShiller #PMI #Dollar #bonds #megacaps
Critical jobs data you need to watch this week Fresh labor market data will likely be the focus this week, with payrolls, unemployment, and wage growth all carrying weight for the Federal Reserve’s policy path. Stronger-than-expected job reports could revive dollar demand, while weaker figures may keep pressure on the greenback as markets price in further Fed easing.
Nonfarm payrolls for September are projected at 39K, a modest improvement from August’s 22K, but still far below the levels seen through most of 2023 and earlier years (chart, top left).
The unemployment rate is expected to hold at 4.3% (chart, top right).
Average hourly earnings are seen rising 0.3% month-on-month, matching August’s gain. That would keep annual wage growth steady, reflecting sticky wage pressures even as job creation softens.
The JOLTS job openings series remains elevated at 7.3 million (chart, bottom left), but still well below the peaks of 2022. This suggests firms are slower to post new jobs, but demand has not collapsed entirely.

What to trade if you can't trust jobs data? U.S. President Donald Trump has dismissed the head of the Bureau of Labor Statistics (BLS), reportedly in response to jobs figures he disagreed with.
This raises concerns about the integrity of government-reported economic data, especially ahead of the next key Non-Farm Payrolls (NFP) release on September 5.
This upcoming report also includes the BLS’s annual revision, adjusting past job growth figures from April 2024 through March 2025. Goldman Sachs “estimate a downward revision on the order of 550,000 to 950,000 jobs—or a reduction of 45,000 to 80,000 jobs per month over the April 2024 to March 2025 period.”
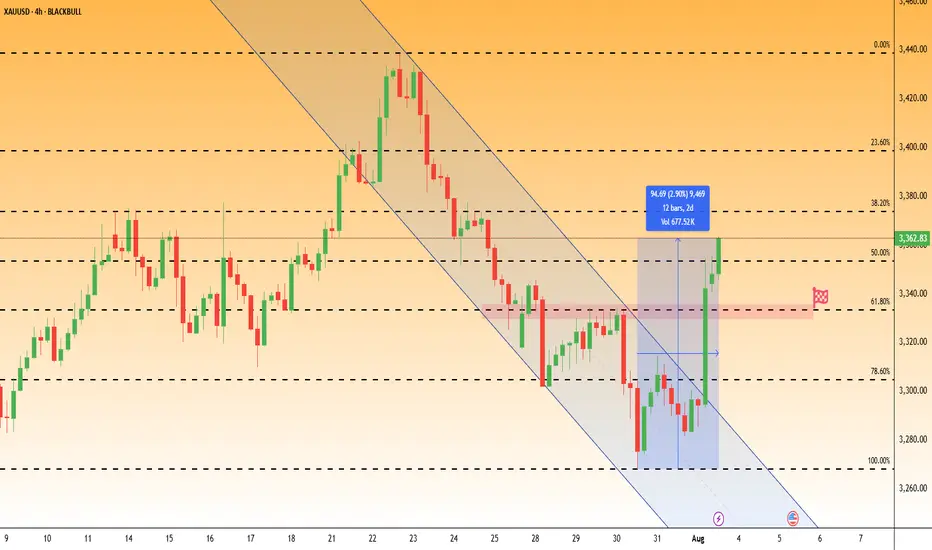
Given macro uncertainty and signs of distrust in U.S. economic data, the bid for gold may persist.
Gold has rebounded sharply in recent sessions, breaking a short-term downtrend and climbing back above the 3,360 level. Price has now retraced more than 50.0% of the July 24–31 selloff. The pair may be Short-term bullish, if price holds above 3,310.
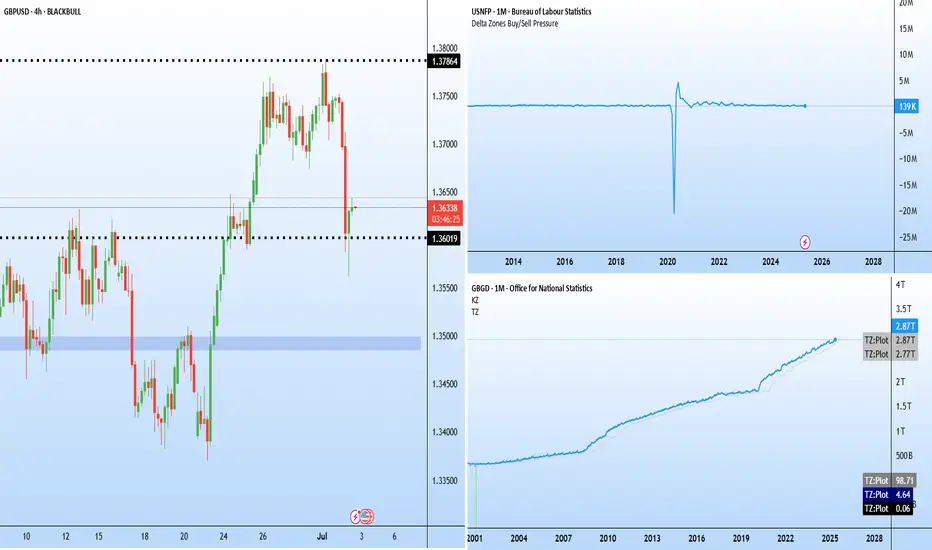
Jobs vs politics: GBPUSD caught in crossfire Two major stories are developing on either side of the Atlantic.
ADP reported a 33 k fall in June private payrolls (consensus +95 k). It is the third straight miss and sets the tone for Thursday’s early Non-Farm Payroll (NFP) release, brought forward because of the 4 July holiday.
In the UK, speculation is growing around the position of Chancellor Rachel Reeves after an emotional appearance in Parliament. Prime Minister Keir Starmer declined to confirm whether she would remain in the role, sparking questions over the government’s fiscal direction.
The political uncertainty helped accelerate the sell-off in GBPUSD, which has fallen sharply from recent highs near 1.38. The latest candles show a long lower wick around 1.3600, indicating that buyers are attempting to defend the area. If this support fails to hold, the next downside target lies near 1.3485–1.3500, which acted as a base for the late-June rally.
Just got the May NFPs... Let's have a lookWe just received the May NFPs, which, overall, are not bad. Let's dig in.
TVC:DXY
TVC:DJI
FX_IDC:USDJPY
FX_IDC:USDCAD TVC:GOLD
Let us know what you think in the comments below.
Thank you.
77.3% of retail investor accounts lose money when trading CFDs with this provider. You should consider whether you understand how CFDs work and whether you can afford to take the high risk of losing your money. Past performance is not necessarily indicative of future results. The value of investments may fall as well as rise and the investor may not get back the amount initially invested. This content is not intended for nor applicable to residents of the UK. Cryptocurrency CFDs and spread bets are restricted in the UK for all retail clients.
D

Let's cover the action of some instruments as we get the NFPLet's see what's happening with the market as we get the NFP number live.
Let's dig in!
MARKETSCOM:DOLLARINDEX
TVC:DXY
TVC:GOLD
FRED:SP500
FX_IDC:EURUSD
MARKETSCOM:EURUSD
Let us know what you think in the comments below.
Thank you.
77.3% of retail investor accounts lose money when trading CFDs with this provider. You should consider whether you understand how CFDs work and whether you can afford to take the high risk of losing your money. Past performance is not necessarily indicative of future results. The value of investments may fall as well as rise and the investor may not get back the amount initially invested. This content is not intended for nor applicable to residents of the UK. Cryptocurrency CFDs and spread bets are restricted in the UK for all retail clients.
G

US FEDERAL WORKERS and COMING DECLINEThe chart Posted is that of Government worker Has PEAKED ! As you can see under Elliot Wave We have reached the point That Governments thru out the United States has FIVE LEGS up ! and to which the jobs created over the last fours has been where most jobs have been. It is my view that this has come to an end ! and that we are going to see a true sea change . Timing is for a decline to start NOW !This should also slow down the rate of Debt and inflationary forces ! . I stand by my work and the data the US Unemployment levels have bottomed and a upturn that started last year will see it increase to a level in the mid 5 to 5.5 % .and that the recession started last year mid summer early spring . If cycles based on the data we should see the peak in unemployment in Oct 2026 and the low in the Liquidity cycle and recession low . Best of trades WAVETIMER

US Unemployed to Employed as Indicator of Job Market HealthIn this chart, we use the following symbols: ECONOMICS:USNFP , FRED:UNEMPLOY
ECONOMICS:USNFP represents the number of jobs created in a month. FRED:UNEMPLOY represents the number of unemployed individuals for a month.
Assuming exactly 1 payroll per person , the ratio 100 * ECONOMICS:USNFP / ( FRED:UNEMPLOY + ECONOMICS:USNFP ) estimates the percentage of previously unemployed individuals who transitioned to employment in the month. If enough jobs are created, the current FRED:UNEMPLOY should equal the previous month's FRED:UNEMPLOY minus ECONOMICS:USNFP , as the jobs created should correspond to the unemployed who found work.
When sufficient jobs are created, the number of unemployed decreases, and the ratio increases. A "healthy" value for this ratio is around 2.5% , indicating that approximately 2.5% of unemployed individuals transition to employment each month .
Conversely, if insufficient jobs are created, the number of unemployed rises, and the ratio decreases. Ratios around 0% or negative values are usually observed during or before recessions, indicating an unhealthy job market .
For last two consecutive months, the ratio has been 0.17% , suggesting an unhealthy job market . Similar patterns were observed before the DotCom and GFC recessions. If this trend continues for several months, it strongly suggests that the US is either on the verge of or already in a recession.
Historically, when the 30-week SMA crosses below the 50-week SMA, it signals a recession. This signal was triggered in June '24.

2024 ADP Jobs Created Overstated by Near 550K?Recently, the September ADP Employment Report was published. (You can download historical data from the link above.)
After the report was released, TVC:DXY , TVC:US02Y , TVC:US10Y , and TVC:US30Y rose, suggesting that the market perceived the report as strong. However, the details of the report tell me the opposite.
Note, the data being published is seasonally adjusted (SA). However, it is possible to obtain the raw, non-seasonally adjusted (non-SA) data from the website above. I calculated the number of jobs created from the beginning of the year until September (inclusive) for both non-SA and SA data and determined the differences between these two values. You can find my spreadsheet here: www.icloud.com A screenshot of the results is also shown in the chart.
As you can see, in typical years, the difference between jobs created from the start of the year through September for non-SA and SA is around 1.1M . Non-SA figures are usually higher because the last quarter tends to be weak for job creation. However, 2024 is quite different. The 2024 SA total jobs created is larger than expected by about 550K jobs . If we adjust by removing 550K reported SA jobs from 2024, the difference between non-SA and SA jobs would become approximately 1.1M, which is typical for a regular year.
Why is this significant? Many indicators suggest that the U.S. economy is nearing a recession. Thus, this unusual job creation pattern is very suspicious. The published SA ADP employment numbers may be masking underlying economic weakness.
Even with rate cut(s), I expect that the last quarter of 2024 will be weaker for job creation compared to a typical year. Therefore, I anticipate significant revisions to ADP employment data around December or January.

Full Time Employment All Time HighsCongratulations to Trump supporters! you got what you deserve.
Americans yesterday voted for Trump because he convinced them that the "economy "feels" bad."
Nothing could be further than the truth. Never in the history of America have more people been employed. That's just a fact.
In the next four years, Americans will experience what a real "bad economy" feels like.
Don't shoot the messenger kids! I can only tell you what the charts say.

Nightly $SPY Prediction for 10.31.2024🔮
⏰7:30am
Challenger Job Cuts y/y
⏰8:30am
Core PCE Price Index m/m
Employment Cost Index q/q
Unemployment Claims
Personal Income m/m
Personal Spending m/m
⏰9:45am
Chicago PMI
⏰10:30am
Natural Gas Storage
#trading #stock #stockmarket #today #daytrading #swingtrading #charting #investing

Nightly $SPY Prediction for 10.29.2024⏰8:30am
Goods Trade Balance
Prelim Wholesale Inventories m/m
⏰9:00am
S&P/CS Composite-20 HPI y/y
HPI m/m
⏰10:00am
CB Consumer Confidence
JOLTS Job Openings
#trading #stock #stockmarket #today #swingtrading #charting #investing

THE KOG REPORT - NFP THE KOG REPORT – NFP
This is our view for NFP, please do your own research and analysis to make an informed decision on the markets. It is not recommended you try to trade the event if you have less than 6 months trading experience and have a trusted risk strategy in place. The markets are extremely volatile, and these events can cause aggressive swings in price.
Simple one for this NFP as we’re going to be more of the observer rather than the trader unless again, we get those extreme levels that we want.
Key level here is 2670 which was our bias level earlier in the week, that is also now a resistance being attempting to break open. For that reason, we will wait to see if it breaks and look higher at the levels of 2675 and then step by step upwards following the path. We’ll be looking at the extreme level of 2710-20 for the exhaustion and the RIP to attempt the short trade.
On the flip, downside risk on the break of 2650 key level should take us in to the order region 2630-35 where we may get a slight reaction in price, but potentially only for the scalp. Breaking this level opens the door and we won’t be looking to long again until we target 2600-10.
Please do support us by hitting the like button, leaving a comment, and giving us a follow. We’ve been doing this for a long time now providing traders with in-depth free analysis on Gold, so your likes and comments are very much appreciated.
As always, trade safe.
KOG

$USJO (MoM)ECONOMICS:USJO U.S Job Openings Down to 2021-Lows
source: U.S. Bureau of Labor Statistics
The number of Job Openings fell by 237K to 7.673 million in July 2024,
the lowest level since January 2021, compared to a downwardly revised 7.91 million in June, and well below market forecasts of 8.1 million.
Job openings decreased the most in health care and social assistance; transportation, warehousing, and utilities; and state and local government.

Federal Reserve is Behind the Curve, Recession is 100% CONFIRMEDHello everyone,
The federal reserve has kept interest rates at near zero and printed the MOST money in US history back in 2020 and this has caused one of the worst inflation in 40 years. Jerome Powell decided to fight inflation by giving us the fastest rate raising campaign in history. He has kept rates too high for too long and we are now guaranteed a recession. Jerome Powell will find himself in a position to cut rates very fast due to the cracks in the job market. It is already too late we will be witnessing a huge spike in unemployment. Who knows how high this can go, back in 1929 unemployment hit 24.9%.

FOMC & 800K Fewer Jobs Dragging on Dollar The dollar is under pressure, with persistent selling pressure driving it to new yearly lows across several currencies, including the pound.
A recent revision of jobs data revealed that U.S. job growth was significantly weaker than initially reported, with 818,000 fewer jobs added (for the year ending March 2024). This huge downward adjustment, the largest since 2009, indicates that the labor market cooled more rapidly than previously thought.
These revised job figures could likely intensify concerns that the Federal Reserve has been too slow in lowering interest rates.
At its July meeting, Federal Reserve officials considered the possibility of a rate cut but opted to hold off, hinting at a move in September. Markets are now pricing in a September cut, which would be the first since the emergency measures taken during the early days of the Covid crisis.
Regarding the labor market, “many” officials noted that “reported payroll gains might be overstated,” which means that the Federal Reserve might be ahead of the rest of us, and exactly where it wants to be regarding timing the rate cuts.

Is This the Start of a Recession? Why You Shouldn’t PanicMarkets have been selling off amid the latest fears of a recession, with the NASDAQ dropping over 10% and Bitcoin dropping over 20% in just a matter of days. Last Friday’s unemployment report further affirmed investors’ sentiment, exceeding expectations by 0.2% and sparking one of the biggest rotations of capital since the COVID crash. Investors are gearing up for tough times by flocking to bonds and panic-selling risky assets, but has a recession really begun? Should you panic?
Understanding the Economic Data
Recent unemployment numbers have triggered the Sahm Rule Recession Indicator, created by Claudia Sahm in 2019 to identify recessions as they start. This indicator is triggered when the three-month simple moving average (SMA) of the US unemployment rate rises by 0.5% above the lowest rate observed over the past year. Despite its growing popularity, it’s important to note that this tool has never actually identified any recessions in real time, except for the 2020 recession.
In contrast, more established indicators like the Smoothed U.S. Recession Probabilities, developed by Marcelle Chauvet and James Hamilton in 1998, have not indicated that the economy is currently in a recession. Unlike the Sahm Rule, this nearly 26-year-old tool, which relies on complex calculations and various datasets, accurately identified the 2001 and 2008 recessions in real time.
Moreover, recessions in the US typically occur when the US Composite Leading Indicator (CLI) is on a downward trend, which hasn’t happened yet. This further suggests that other indicators besides the unemployment rate aren’t currently showing signs of concern.
Even though the unemployment rate has risen sharply, other leading unemployment indicators, such as initial claims and continued claims, remain at historically low levels. Typically, these leading indicators rise sharply before a substantial increase in the unemployment rate, not the other way around.
With the market pricing in substantial rate cuts following the unemployment numbers, yields have dropped, increasing the spread between the short and long ends of the yield curve. Historically, recessions haven’t usually unfolded during inverted yield curves.
Additionally, expected looser monetary policy from the Fed combined with surprisingly tighter monetary policy from the BOJ pushed the DXY substantially lower. This resulted in a breakout in global liquidity, which is inversely correlated with the DXY and serves as a helpful indicator of future trends in risk assets.
Understanding the Market Trends
While the real economy hints that we are likely not currently in a recession, it’s crucial to examine the charts to better understand the downside risks and how to position oneself in order to stay on the right side of market risk. The spike in the VIX and the put-to-call ratio on Monday indicated extremely fearful sentiment, which historically suggests limited downside risk and the potential for a short-term rebound.
The sudden surge in fear was reflected in the sharp increase in bond prices as investors shifted from high-risk to low-risk assets. With bullish short-term and long-term trends since early June, bond prices have reached overbought conditions, suggesting they are likely to slow down in the short term but continue outperforming in the long term, aligning with market expectations of future rate cuts.
The inverse can be observed in the equity markets, with US indices in oversold conditions and exhibiting recent bearish short-term and long-term trends. This suggests that equities are likely to experience a short-term bounce but will continue to decline in the long term, providing a potential opportunity to sell.
The cryptocurrency market tells a similar but much more pronounced story, with bearish short-term and long-term trends evident since late June. Despite being oversold, the future outlook for the cryptomarket remains pessimistic and is likely to underperform equities, especially if investors continue to reduce risk.
This flight to the relative safety of mega caps has been a recurring theme since March 2021, when both the small cap and mid cap to mega cap ratios turned bearish, a trend that remains unbroken and is likely to continue unless a recession materializes and forces a shift to looser monetary policy.
Similar trends are likely to continue in the cryptocurrency markets, as evidenced by the breakout in Bitcoin dominance, which currently positions Bitcoin’s market cap at 62% of the entire cryptocurrency market when stable coins are excluded from the calculation.
Concluding Thoughts
While the market is starting to panic amid recessionary fears, the data does not yet confirm that the economy is currently entering a recession. Investors should avoid panic selling, as a rebound is likely to occur in the short term given the current overextended conditions. For the mid to long term, the situation calls for a cautious approach, focusing on managing risk and gradually shifting from riskier to less risky assets, as indicated by longer-term trends in asset markets.
Disclaimer: This article is for informational and educational purposes only and should not be construed as investment advice.

Does the US have an AI problem?This chat compares the monthly unemployment rate and the job openings since 2022. Unemployment has been rising since end of 2023, basically beginning of AI, and available jobs have been down since 2022, all while the market is reaching new highs. It seems that AI brings in more revenue and reduces cost for companies. I wonder if they’ll be any regulations.

THE KOG REPORT - NFP THE KOG REPORT – NFP
This is our view for NFP, please do your own research and analysis to make an informed decision on the markets. It is not recommended you try to trade the event if you have less than 6 months trading experience and have a trusted risk strategy in place. The markets are extremely volatile, and these events can cause aggressive swings in price.
Please note, this NFP looks like it’s going to slip a lot of traders up, so please be careful if you’re going to trade it, otherwise, like us, stay out of the market and come back to it on Monday where we will find better, cleaner opportunities. We’ve done well in Camelot, we’re not going to risk anything on this NFP, not even a 0.01lot.
So, we have an early session move downside into the support region 2330-35 with extension into the 2325 price point, which if held here could give us bounce up into the order region above 2345-50 which is where ideally we will want to see the price pre-event. We’ve plotted the extreme levels on the chart and the potential move, the extreme support level sitting at 2305-10 which, if they do take the price down into, we feel the RIP upside will come from to at least the 2330 price point.
We would say below the 2355-60 region we’re looking lower, and that price point will need to hold for us to see a continuation of the move. The structure needs to form however!
On the flip, breaking above the 2355 region we could see this attempt the 2400-2405 price point before we even think about shorting it.
It’s one or the other for us, it either comes down into extreme level and we’ll look for a set up after the event, or, it goes up into extreme level and we’ll look for a set up. In the middle, we’re not interested in trying to catch the moves today.
Please do support us by hitting the like button, leaving a comment, and giving us a follow. We’ve been doing this for a long time now providing traders with in-depth free analysis on Gold, so your likes and comments are very much appreciated.
As always, trade safe.
KOG
