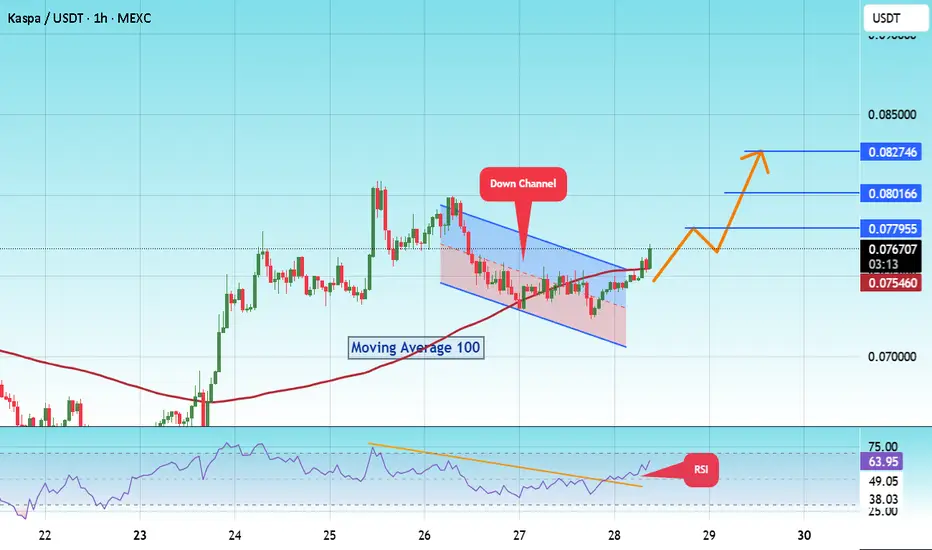
$KASUSDT Breaks Trendline #KAS
The price is moving within a descending channel on the 1-hour frame and is expected to break and continue upward.
We have a trend to stabilize above the 100 moving average once again.
We have a downtrend on the RSI indicator that supports the upward break.
We have a support area at the lower limit of the channel at 0.071500, acting as strong support from which the price can rebound.
Entry price: 0.075917
First target: 0.077955
Second target: 0.080166
Third target: 0.082746
To manage r
Kasbtc
KAS ANALYSIS (12H)A significant trendline has been broken on the chart, and a bullish iCH formation has also formed. Additionally, a liquidity pool is visible above the chart, which is expected to be swept soon.
The demand zone is our entry area. If the price reaches this zone before touching Supply 2, we can consider entering a position.
A daily candle close below the invalidation level will invalidate this analysis.
Do not enter the position without capital management and stop setting
Comment if you have any
Kaspa / KAS ( 70X in 9 month )The price of Kaspa (KAS) is $0.011 today with a 24hour trading volume of 5 million dollar. This represents a 30% price increase in the last 24 hours and a 7000% price increase in the past 9 month..wait what?! that's exactly why you should be in crypto and find the next crypto gems.
Kaspa is a proof-of-work cryptocurrency which implements the GHOSTDAG protocol. Unlike traditional blockchains, GHOSTDAG does not orphan blocks created in parallel, rather allows them to coexist and orders them in c
Kaspa | KAS (100X in Bear Market!)If Kas can jump 10000% in bear market, what will happen in bull market then ?
Well first of all Respect the pump and the beautiful chart pattern because while all world class banks dump like Ponzi scheme there are many solid projects in crypto that shines and shows crypto is the future of the finance and technology.
Kas still didn't list on big exchanges which means there are more liquidity and attention on the way but right now you should know the best case scenario for a token with 320 milli
KAS ANALYSIS (1D)The KAS symbol appears to be completing a diametric. It seems to be in early wave F now. If it reaches the red range, we can look for sell/short positions.
Closing a daily candle above the invalidation level will violate the analysis
For risk management, please don't forget stop loss and capital management
Comment if you have any questions
Thank You
$KAS Huge Cup and Handle?CRYPTOCAP:KAS has played out several smaller cup-and-handle patters over the past year. This idea shows two larger cup-and-handle patterns on the $KAS/BTC pair - one which played out already (yellow) and one that could be leading up to a breakout.
If this breakout occurs, it could shoot KAS*1,000,000/BTC from ~3.0 to 5.0 - 5.5. at ~$60k BTC, that's $0.30 - $0.33 per $KAS. Very fair target considering others' recent models.
Where things could turn really juicy, is if BTC continues to rip and
KAS LOOKS BEARISHThe KAS symbol is close to a supply resistance range
Considering that it is a bearish structure, it is expected to be rejected from this supply downwards.
I specified the targets on the chart. I also specified the invalidation level. Closing a 4-hour candle above this level will violate the analysis
For risk management, please don't forget stop loss and capital management
When we reach the first target, save some profit and then change the stop to entry
Comment if you have any questions
Thank
KAS LONG SETUPHi, dear traders. how are you ? Today we have a viewpoint to BUY/LONG the KAS symbol.
By protecting the green zone, it can move up and defeat the previous peak.
For risk management, please don't forget stop loss and capital management
When we reach the first target, save some profit and then change the stop to entry
Comment if you have any questions
Thank You
Maximum point of this wave: 0.034542Hello?
Traders, welcome.
If you "Follow", you can always get new information quickly.
Please also click "Boost".
Have a good day.
-------------------------------------
(KASUSDT chart)
The largest measurable part of the current wave is the 0.034542 point.
Therefore, if it rises above 0.034542, you should be cautious in trading until the next wave.
(1h chart)
Therefore, the key is whether it can rise with support around 0.029505-0.031822.
If not,
1st: 0.026392-0.027106
2nd: 0.022125 (0.020