Bitcoin Continues Aiming At $9999... Can It Go Higher?Greetings my fellow cryptocurrency owners, lovers, critics, and traders... Please allow me to entertain you for a few minutes... ok?
Yes! Let's get started...
Bitcoin continues growing.
Bitcoin continues to defy the mind of the masses.
Bitcoin continues to become stronger... with much more to come.
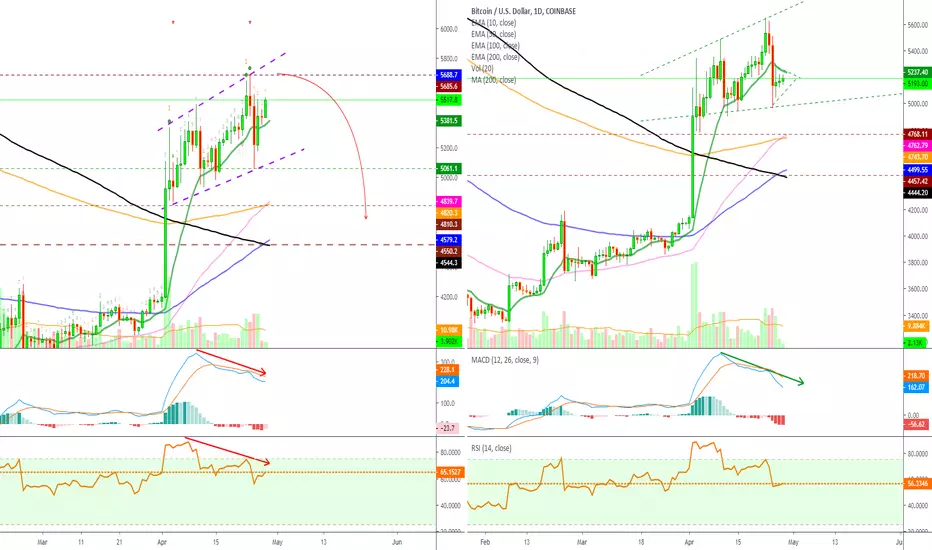
Above we are looking at the same chart we shared last week. We can see plenty of lines on the chart marking the strong support and resistance levels.
One of our most important indicators, volume, continues to grow. We are looking to close this week with the highest volume bar since December 2018.
December 2018 is when Bitcoin hit the bottom of the bear market. The trend now changed completely, we are looking at higher highs and higher lows week after week.
And even though we want Bitcoin to go higher, it can also consolidate sideways (blue arrow), as it can retrace (red arrow) before it continues with this feat.
The most likely scenario at the moment? Bullish impulse... Up, up, up, up, or at least that is what we want, what we believe.
But why?
Because market sentiment changed from bearish to bullish, so the bears will be annihilated until they believe that all is lost. Only when there is no way that Bitcoin can correct and go lower, that's exactly when the price will start to fall.
So before we go and retrace, let's see another impulse to the upside, maybe $10,000 or more.
Where do you think Bitcoin is headed?
First, hit like, and then share your thoughts in the comments section below.
Thanks a lot for reading, we appreciate your support.
Namaste.
Kraken

Tron (TRXM19) Gaining Bullish Momentum (180% ROE Possible)Tron (TRXM19) is starting to gain bullish momentum on the 4H time frame. The last four candles closed green and volume is starting to build up on a Monday.
We saw how Ripple (XRPM19) took off with great strength, Ripple and Tron tend to move together on BitMEX.
If TRXM19 can break 0.00000366 (EMA50) and remain above this level, a strong bullish move can happen. A good trade set up is available here.
Make sure to hit like if you would like to see a full trade for TRXM19. I will share if there is enough interest/support.
Thanks a lot for reading.
Namaste.

ETHUSD, good time for investment.Like i wrote in previous post i wait good long trend on ethusd. This trend is confirmed by volumetric analysis using the X-volume indicator.
Also, some proven people write about the rapid withdrawal of a huge amount of eth from the Bitfinex exchange. In my opinion, this is only to the benefit of asset growth, because there will be nothing to sell))
Levels thanks to X-Lines indicator.

BTC INVESTMENT IDEA LONG TERMABCD PATTERN SPOTTED ON WEEKLY TIME FRAME
Pattern points :
BC correction ratio 0.382 from AB
CD correction ratio 1.618 from BC
_______
*Entries
_______
first entry : 4650$ 20% from capital
second entry : 4470 20% from capital
third entry : 4210 20% from capital
_______
*Note:
_______
can it go lower .. ?? i think no .. but in case we have a strong base and i don't think we will break it down at 3800ish areas .. just in case .. but i dont expect it even to breakdown the first entry then i will find you a point to add more contracts to your invest
_ _ _ _ _ _ _ _ _ _ _ _ _ _ _ _ _ _ _ _ _ _ _ _ _ _ _ _ _ _ _ _ _ _ _ _ _ _ _ _ _ _ _ _ _ _
Targets :
*T1 : 7800
*T2 : 8360
*T3 : 8950
*T4 : 9861
*T5 : 11690
if you are using leverage its better to use 2x to 3x leverage maximum on this trade
and if you are not using leverage like in binance exchange you can enter this trade in parts and accumulate bitcoin in parts
NOTE : this idea for long term invest and can be from 6 to 8 months
for scalping ideas and mid term signals please follow my telegram and twitter .. posted below in links

XTZUSD, strong short to better price 0.70.I continue writing about Kraken. And Today is XTZ USD. Volume analysis show strong short and this idea confirmed by level analysis in Kraken trade glass. Target for bears is 0.70.
Levels thanks to X-Lines indicator.

XBTUSD (BTCUSD), long to real interesting price 6465.I continue the cycle of good investment ideas and today the main cryptocurrency. Volume analisys with x-volume indicator show big purchases without nice sells last day. Big player purchase from 4400 (its on Kraken) and i think they want full 50% profit! On Day timeframe x-lines show 6465. So we go up!
Levels thanks to X-Lines indicator! Follow me)

EOSUSD, long to transit (7.83) or gold interesting price - 8.87.Ok, guys, today its Kraken and EOSUSD. I automaticaly mark all interesting price with X-lines indicator. Like you can see 8.87 its a real strong and interesting price (marked gold color). Also gold status have strong resistence level 5.47 there is a big seller on it. Volumetric analisis by X-Volume indicator show good medium purchases without obstacles. So i think you can do two things:
1) Purchase now and sell on 5.4.
2) Purchase now and wait 7.0 or higher.
It all depends on your trading activity.
Levels thanks to X-Lines indicator.

Litecoin (LTCM19) Double Bottom, More Upside Possible!Litecoin (LTCM19) just went through a massive correction and retraced from the 3rd until the 29th of April.
It then continued to produce what we call a "double bottom", marked with blue arrows on the chart. This ended in a perfect bounce at the low-end of our recommended buy-in (around 0.0128 was the low-end of our buy-in), with LTCM19 now doing some nice bullish action.
On the chart above we can appreciate:
Break above EMA10 and EMA50.
Increasing bullish volume.
Green candle after green candle. This is the strongest LTCM19 has been since early April on the chart above.
The RSI is super bullish.
Remember to hit like.
Additional bullish action is expected for Litecoin (LTCBTC).
We shared full trades for Tron (TRXM19) and Ripple (XRPM19) and both are now generating great profits.
XRPM19 generated 89%+ ROE after hitting just one target, with more to come. You can see this trade here:
Our TRXM19 trade is just getting started and can be found here:
The reason why there isn't a full trade for LTCM19 is because there wasn't enough interest/support. If you want to see a full trade for this Litecoin on BitMEX, make sure to hit like, if enough people hit like we will share the full trade.
All details shared on the chart.
Remember... This is in no way any type of financial advice.
Leveraged trading is for advanced/experienced traders only. Beginner traders, please stick to Binance, Bittrex, Poloniex and other non-leveraged exchanges.
These trades are high riks and intended only for those that know what they are doing.
With that said... Enjoy the profits.
Enjoy the trades.
This is Alan Masters.
Namaste.

Cardano (ADAM19) Is Approaching Our Buy Zone (Over 190% PotentiaWe are getting ready for Cardano on BitMEX (ADAM19), which is approaching our buy zone (yellow on the chart).
There isn't much to do here actually other than wait for the price to continue retracing, once our buy zone (support) is hit/found, we prepare to trade.
All the details on the chart.
IMPORTANT
We shared some general guidelines and very important tips that can help you maximize profits while minimizing loss when trading.
You can read those here:
Remember to hit like if you would like to see a full trade for ADAM19 for 190%+ ROE on 10X.
This is Alan Masters.
Namaste.
P.S. This is not financial advice.
All the information above is intended for learning and entertainment purposes only.

XTZUSD, long in medium term.Like we can see volume analysis by x-volume indicator show good buyers accumulation between 1.0 - 1.14 which can truly turn up price of xtz. First TP level is 1.27. Level for sell is 1.34.
Levels thanks to X-Lines indicator.

Storj Is Showing Signs Of Revival (Over 500% Next Wave)We haven't heard about StorJ since we shared our educational chart on mid-January, soon after sharing this chart, STORJBTC went ahead and made a 200%+ profits impulse move...
You can see this happening here:
Now, StorJ is starting to move again after 4.5 months of retrace, which tells us, without even looking at the signals, that this is very likely to be a real move, but why?
The market moves in cycles. There are large cycles and small cycles, we have cycles within cycles and all sorts of variations.
To put it simply, we share it likes. Wave up, wave down, wave up, wave down... simple.
So we had this strong wave up that started back in January/Early Feb. This wave ended and we had the 4.5 months I just mentioned, which was the retrace.
Keeping it simple. We had the wave up, followed by a wave down... What comes next? That's right, another wave up.
So when we see this breakout after 3 failed attempts to move higher, a full-blown correction and a strong bounce at support, we no longer need to look at the MACD, RSI, or TD Sequential, we know that STORJBTC is getting ready for some more.
It has been decided... 2 more weeks and the entire altcoins market will start moving up.
Note: When I say altcoins I am excluding Bitcoin and the top 10 alts by market cap.
Thanks a lot for your amazing support.
Namaste.

EOS Token Higher Lows on BitMEX (125%+ ROE on 10X)EOS Token (EOSM19) is showing signals of an upcoming change of trend.
I am looking mainly at:
Chart structure.
Higher lows.
Support holds.
Indicators turning to the bull side and gaining momentum.
General guidelines and tips for Alan Masters BitMEX trades
Please remember that this is for experienced/advanced traders only, not beginners, Binance, Bittrex, Poloniex and such for beginners.
This is not financial advice.
IMPORTANT TRADING TIPS FOR LEVERAGED TRADES
Secure your profits. Sell 50% of your holdings on the first target to secure profits.
Secure your trade. Raise stop-loss above buy-in price after hitting the first target.
The above tips are valid for all of our BitMEX trades. These rule of thumbs can be used to maximize profits.
Want to see a full trade for this EOSM19 set-up? Make sure to hit like.
If enough people hit like I will share a full trade with buy-in, targets, capital allocation, stop-loss, and additional information.
Thanks a lot for reading.
Namaste.

Viacoin Is Setting Itself Up For Nice Gains!Viacoin (VIABTC) is setting itself up for some nice gains after breaking above multiple resistances with increasing volume.
One more confirmation is needed but the set-up looks beautiful.
We have a break above MA200.
Now challenging EMA100.
MACD bullish crossover.
RSI is now above 50 (bullish).
This set up can lead to an easy 40%+ profits.
Conditions for change: If VIABTC moves down and closes below EMA10, the above signals are invalidated.
Thanks a lot for reading.
Namaste.

XRPUSD, long from 0.17 - 0.21. Dont invest now.Ok, guys what we have there from 10 dec 2018 to 1 april 2019 crypto makers accumulate hopes and then sell it on 2 april 2019. If you think that 0.27 - 0.29 best price for investing you truly mistaken. X-volume indicator show furser selling to 0.16-0.21. And i think that price 0.16 - 0.21 is a gold for investing. Also x-lines indicator show best interesting price for sell its 0.71884. Low trend isnt exhausted its very good shown by x-volume indicator.
All levels on this chart really right becouse they all draw by x-lines indicator.
Conclusion: we are waiting for the right price to buy an asset 0.16-0.21. We sell existing assets immediately.

ADAUSD, low trend exhausted, now long to 0.07749.Ok, like i see this situation, i draw on the chart. In past we have "selling the hopes " after which people who disappointed in ada start they native selling. So now market is empty and crypto maker need a new victims. So we go up.

Litecoin (LTCBTC) Bounces From Support (What Now?)Litecoin (LTCBTC) had a really strong bullish wave that lasted from early December 2018 until early April 2019. Needless to say, this bullish wave generated massive profits (over 170% from bottom to top).
On the 6th April LTC started to retrace until it found support at the 0.786 Fib. retracement from the Feb-April wave, this is right below EMA100.
At this point, Litecoin printed a big green candle that managed to put it back above EMA100 as well as EMA10.
Now trading above EMA10, LTCBTC is showing good bullish potential, the next challenge is sitting 0.014492 or EMA50.
Let's get to business... Will Litecoin continue moving up?
If you look at the MACD, you can see that it is starting to curve up and the histogram is going in favor of the bulls.
The RSI downtrend has been broken and a strong bounce happened but it is still below 50.
Volume isn't as strong as we would like to see for bullish confirmation, so we are seeing the good potential but still with some mixed signals.
To confirm additional bullish action we would have to see a lot more volume coming in in the next two days, as well as LTC remaining above EMA100, or even better, EMA10.
What's your take on where Litecoin (LTCBTC) is headed next?
Share your thoughts in the comments section below.
Thanks a lot for reading.
See you on our next call.
Namaste.

ATOM, strong short to base price.So, what we see there ... new crypto on Kraken. So young, exactly we have only one interesting price on x-lines indicator. Seller do first money on none proffesional buyers. Price will go down and stop only we find better price for big volue purcheses. Like you can see there is some volume in the past after wich price still go down so it was sellers.
Strong short to strong volumes.

BitFinex Vs CoinBase ($325 USD Spread, Risk Increases)Looking at Bitcoin (BTCUSD) on CoinBase vs BitFinex, the price difference is becoming bigger, the risk is starting to increase.
Go here for a full detailed analysis and why this is unhealthy for the cryptocurrency market, especially Bitcoin:
We are now looking at $325 USD in price difference and we see BitFinex moving higher and higher but with no volume, which is a terrible signal, bloody Monday coming soon?
Feel free to hit like now... If you want to, and let's continue with this analysis.
Looking at the MACD on both exchanges, the bearish is becoming more pronounced.
While there has been no action on CoinBase, BitStamp, BitMEX, etc., BitFinex continues to grow, do they know something that we don't know? Not likely, this is just the usual Tether (USDT) situation.
All the price action details are explained in my previous analysis, but if BTCUSD does fall, you can expect support to be found first at the $4900 - $5000 range followed by EMA50 if the above level breaks.
As for a break to the upside... I believe it is possible but very unlikely, looking at CoinBase chart. EMA10 is still the challenge to break and the structure of the chart isn't that inviting for an impulse to the upside.
Where do you think Bitcoin is headed next?
Share your thoughts in the comments section below.
Thanks a lot for reading.
Great Sunday.
This is Alan Masters.
Namaste.
[XRPM19][LONG][8X][177.28% ROE] Ripple on BitMEX @alanmastersTo all those great supporters who hit like in my previous Ripple (XRPM19) chart analysis , here is the full trade for BitMEX as promised.
But before we go there, let me share a few warnings as this is only for advanced traders:
All the information shared here is for learning, educational and entertainment purposes only. This is not financial advice.
Trading on BitMEX or any other leveraged platform is highly risky and not intended for beginners, rookies or people who can't take a loss.
Trades can do great, generate massive profits fast, just as they can generate a loss.
If we hit, we are happy, we take the profits, we are grateful, say thank you and move on.
If we take a loss, we continue being happy, we adapt, we learn and continue with the next call.
So it doesn't matter whatever happens, remember that you are a Divine Soul.
Ok, please follow me now... Let's trade! (Remember to hit like).
-----
Trade: LONG XRPM19 by Alan Masters
Leverage: 8X
Buy-in: 0.00005400 - 0.00005700
Time Frame: 4H
Targets:
(1) 0.00006090
(2) 0.00006250
(3) 0.00006490
(4) 0.00006780
Stop Loss: Close 4H 0.00005400.
Liq. price: 0.00004995
(Buy-in calculated at 0.00005550)
Profit Potential: 177.28% ROE
Capital Allocation: <6%.
-----
Feel free to hit like to show your support.
Thanks a lot for reading.
Namaste.

[AGIBTC](166%) SingularityNET Full PREMIUM TradeSingularityNET (AGI) Overview
SingularityNET lets anyone create, share, and monetize AI services at scale. The world’s decentralized AI network has arrived.
SingularityNET is a full-stack AI solution powered by a decentralized protocol.
We gathered the leading minds in machine learning and blockchain to democratize access to AI technology. Now anyone can take advantage of a global network of AI algorithms, services, and agents.
SingularityNET (AGIBTC) Chart Analysis
I’ve been looking at many of the Binance altcoins and they are showing some “support” buying, but I am not convinced since there isn’t enough volume. For instance, DENTBTC did show volume on its break and it moved accordingly while others retraced.
SingularityNET (AGIBTC) has gone through some “support” buying as well but this one does have the volume to support this move, which means that it can produce additional bullish action pretty soon. Let’s take a look at the chart signals:
You can see the huge falling wedge and all gains being removed.
The green area is the demand zone, this is where people buy.
The RSI has broken its downtrend after hitting oversold.
The last volume bar is the biggest since March’s bullish wave.
The chart is very self-explanatory.
Let’s trade!
SingularityNET (AGIBTC) PREMIUM by Alan Masters
Buy-in: 0.00000640 – 0.00000690
Next support: 0.00000550 – 0.00000600
Targets:
(1) 0.00000810
(2) 0.00000920
(3) 0.00001000
(4) 0.00001098
(5) 0.00001200
(6) 0.00001270
(7) 0.00001380
(8) 0.00001555
(9) 0.00001675
(0) 0.00001838
Profits potential: 166%
(Buy-in calculated at 0.00000690)
Stop-loss: Close weekly below 0.00000530
Capital allocation: <10%.
HOW TO OVERCOME THE LAST HURDLE
On the way to growth, to freedom, to success, we find many challenges at all times.
The closer we get to our goals, the more we experience these challenges in different ways.
Family and friends are great, but if you are in the path of growth, they can really get in your way.
If you understand this situation and have been facing it for long, here is a little strategy, for you to be able to fulfill your role.
How to overcome the last hurdle?
LEAVE, and only come back once you’ve achieved your goals.
It might sound harsh, but once you come back, they will love you even more.
Namaste.

[TRXM19][LONG][10X][156% ROE] Tron on BitMEX @alanmastersAs promised, to all those great Alan Masters followers who come here and read on a daily basis and show your support... I am deeply grateful.
Here is our full trade for Tron (TRXM19) on BitMEX.
Disclaimer:
This is not financial advice.
All information here is shared for learning and entertainment purposes only.
Leveraged trading is for advanced/ experienced cryptocurrency traders only. If you are a beginner trader, please check the normal trading as this is high-risk and can easily produce a loss. We share many, many trades that are basically risk-free.
If you can't take a loss skip this and all of my BitMEX trades completely as this is for smart, robust and experienced traders only.
Other than that... Enjoy the trade. I am really hoping that you like it and generate great profits with it, truly.
Make sure to always hit like, it only takes a second and it helps massively in continuing with this work.
Now...... LET'S TRADE!!!
----
Trade: LONG TRXM19
Leverage: 10X
Buy-in: 442 - 450
Time Frame: 4H
Targets:
(1) 470
(2) 498
(3) 518
Stop Loss: Close 1D below 423.
Liq. price: 415
(Buy-in calculated at 448)
Profit Potential: 156% ROE
Capital Allocation: <4%.
---
Thanks a lot for your continued support.
Namaste.

Hydro Starts To Print A Bottom Full Trade [HYDROBTC](135% PP)Hydro (HYDRO) Overview
Hydro – The Public Ledger for Financial Services
Hydro allows private systems to interface with a public blockchain. We propose a new hybrid private-public model that enables financial services platforms to leverage the dynamics of a distributed, transparent, and immutable public ledger. The project focuses on particular areas where this can add value, such as authentication, identity management, document security, transactions, and artificial intelligence.
Hydro (HYDROBTC) Chart Analysis
The chart for Hydro is starting to look bullish but these are really pretty early signals, let’s look at the chart:
The main signals here are the bullish divergence on the MACD and a low that HYDROBTC could not break sitting at 35 satoshis, this level was hit 6 times and could not be broken.
If HYDROBTC can bounce from here, break above EMA10, we can expect a strong move up.
So really low risk, 15-20%, with really high potential rewards (100%+).
Let’s move to trade this altcoin…
Hydro Full Trade by Alan Masters
Buy-in: 0.00000035 – 0.00000039
Next support: 0.00000032
HYDROBTC Targets by Alan Masters:
(1) 0.00000041
(2) 0.00000046
(3) 0.00000054
(4) 0.00000059
(5) 0.00000065
(6) 0.00000072
(7) 0.00000077
(8) 0.00000084
(9) 0.00000089
Stop-loss: Close weely below 0.00000030.
Capital allocation: <10%.
MOMENTS FOR INTROSPECTION
Take a moment to think within for yourself.
A moment of silence, a pause... Before any action.
A moment to consider the situation... The different options.
Investing in the moment to improve future results shows dedication and motivation.
Always dedicate yourself a moment for introspection.
It is good for your health, for your wealth and your imagination.
Introspection can improve the results of any situation.
Namaste.

BitFinex, CoinBase & BitStamp $240 USD Spread ($3020 or $7010?)We are in love with Bitcoin, altcoins and the cryptocurrency market in general, we believe this to be the best alternative available today to centralized fiat money.
If this isn't a substitute, it is still always great to have different options, different choices; alternatives.
So now we are looking at alternative money and it has its advantages and disadvantages just like everything else in this lifetime.
So yes, manipulation is real and does exist. Fraud is also possible and real, and there are all sorts of good, bad and neutral actors in all areas of business and life, but a simple accusation shouldn't be enough for us to call for the new to be transformed into the old... Anyways, let's get to the charts.
We are looking at the difference in price between BitFinex ($5400), CoinBase ($5170) and BitStamp ($5170). We are looking at almost $240 USD in price difference, and each time we have this huge gap, things tend to go sour for Bitcoin (BTCUSD).
Yes, it can go bullish for a few days, but this type of price difference almost always results in a strong drop.
The last time we saw a similar difference in price Bitcoin was really bearish, and as the gap closed and these exchanges reached a balance, Bitcoin (BTCUSD) had a strong bullish wave.
Now we are seeing another Tether (USDT) situation and we really don't know how this will end.
Since we can't predict what will happen next, we can take a look at these charts and the signals coming from it to get an idea of that.
Let's take a look at some really classic signals and take it for what they are worth:
Bitcoin (BTCUSD) Chart Signals
BTCUSD is now trading above EMA10 (BitFinex), but in other major exchanges (CoinBase & BitStamp), BTCUSD is trading below EMA10. So BitFinex is looking better but the problem remains that BitFinex is trading against Tether (USDT) and not USD, which can explain how it managed to break above EMA10 while this same resistance was rejected in all other exchanges.
Big volume to break below EMA10, and a subsequent rejection on the bounce (CoinBase and BitStamp). These are bearish signals.
The MACD is leaning towards the bears on all the exchanges above and shows room for more down. There is also bearish divergence showing up and the histogram moving in favor of the bears.
The RSI remains strong but is showing bearish divergence as well which is usually a strong signal on this time frame. Normally this signal is pretty accurate when it starts to show up on the 4H time frame, we are looking at BTCUSD daily now and this divergence is very pronunced.
We can also look at the phase at which this market is at as well as many other factors that support an upcoming drop. Yes we want Bitcoin to continue going up and higher, but based on these signals and past history (you've seen the hundreds of charts comparing BTCUSD to the past and expecting a drop) we are very likely to see a drop.
Where to next Bitcoin? Support & Resistance Levels
In order for Bitcoin to continue moving up, the first challenge is to break and close above EMA10, with the exception of BitFinex of course. The next challenge would be to break the last high at around $5650. If BTCUSD can break these two resistance levels, then we can consider further growth, for now we focus on EMA10 first, anything below it and Bitcoin remains bearish (Trading below EMA10 = bearish potential).
On the way down, the first support range is sitting at $4900 - $5000. If this level can be broken, you can expect BTCUSD to test EMA50 ($4750) next, followed by EMA100 which is the lowest for us right now. If this level hits we will need a new analysis depending on how the daily candle closes.
We all love Bitcoin and we are here for the long term.
We are super bullish long-term and we believe (we KNOW) that Bitcoin is the future.
Looking at it short-term Bitcoin is aiming for a drop, based on the signals coming from this chart... But, this is just our idea based on our experience and the information you see above, please let us know where you think that Bitcoin will go, and feel free to share your thoughts in the comments section below...
This is Alan Masters, thanks a lot for your continued support.
Namaste.
