[OMGBTC](117% PP) OmiseGO Trade SignalTrade: OmiseGO
Buy in: 0.000330 - 0.000350
Targets:
(1) 0.000430
(2) 0.000450
(3) 0.000470
(4) 0.000560
(5) 0.000630
(6) 0.000740
Stop loss: Close weekly candle below 0.000290.
----
Straight to the point.
This is a trade signal.
Consider supporting us by hitting LIKE before or after you collect the profits.
Namaste.
Kraken

TRON To Complete Its Retrace (Prepare 4 Bullish Action)Come and take a look at the TRON (TRXBTC) chart with me, there are signals that its retrace is almost over, so a breakout to the upside can happen soon.
Hit like to get started... if you want to, and allow me to entertain you for a few minutes. Sit back and relax now...
TRON (TRXBTC) 12H TF Chart Analysis
Looking at the chart above, the first signal that we can spot is the Falling Wedge pattern, which is a bullish formation, this means that when this pattern is complete it normally breaks to the upside.
As for the MACD, bullish divergence started to build up and we can see a young bullish crossover... This can lead to a strong breakout.
Price has been dropping and dropping on declining volume. There is no good volume. If this was a bearish move in the making rather than a small correction, we ought to see some more bear volume but there is none. The bulls are being favored according to the signals coming from this chart.
The RSI hit oversold and is going flat. These indicators tend to go flat, before curving, and finally breakout.
Price has retraced all the way back to 0.618 Fib. retracement support from the last bullish wave. If this support does not hold, we can expect support to be found around EMA200 (orange line) before the next move up.
Conditions for change: If TRON (TRXBTC) moves down and closes below 0.00000560 with strength and volume, the above signals become invalid and a new analysis is needed.
If TRXBTC closes below the above level without strength and volume, we remain bullish and expect a strong bounce and consider the break to had been a fake break down.
My view: TRON (TRXBTC) has the potential to break up soon, as there are many signals pointing to this retrace being almost complete.
Thanks a lot for reading.
Namaste.

ICON Passive Breakout (Before The Jump!)Here is a quick trade idea to remind you about ICON (ICXBTC). This one has broken passively above EMA10 and EMA50 and it is looking bullish and ready to make a jump.
You can notice the green arrow and our targets in red.
The stop loss is marked in black. We use manual stop loss for trading altcoins (cryptocurrency).
RSI and MACD on the bull side.
Here is an active trade for ICON (ICXBTC) if you are looking for detailed trade instructions:
Remember to hit like...
Thanks for the continued support.
Namaste.

[XRPH19][LONG][15X][94.2% ROE]Trade: LONG XRPH19 (BitMEX)
Leverage: 15X
Buy In: 0.00008100 – 0.00008210
Time Frame: 4H
Targets:
(1) 0.00008450
(2) 0.00008600
(3) 0.00008726
Stop loss: Close 4H candle below 0.00008000.
Liq. Price: 0.00007868
Potential Profits: 94.2% ROE
Capital allocation: <3%.
---
Enjoy the trade.
Namaste.

[TRXH19][LONG][15X][120% ROE]Here is our trade as promised for all those that showed support on the ADAH19, XRPH19, and BCHH19 trade ideas.
This trade has great potential, 120% ROE, and is above solid support. The 622 satoshis support has held strongly three times since late January.
Feel free to hit like for more trades like this...
---
Trade: LONG TRXH19 (BitMEX)
Leverage: 15X
Buy In: 622 – 637
Time Frame: 4H
Targets:
(1) 654
(2) 662
(3) 673
(4) 688
Stop loss: Close 4H candle below 620.
Liq. Price: 611
Potential Profits: 120% ROE
Capital allocation: <7%.
---
Remember that these trades are for advanced traders only and are also high risk.
Trade at your own risk.
When we win, we celebrate and collect big profits.
When we lose, we take our loss and move on.
We understand trading, it can go right or it can go wrong.
Namaste.

Lunyr Breaks Above Resistance [LUNBTC](87% PP)Lunyr (LUNBTC) is breaking above resistance. Let's take a look at the signals and follow up with a trade.
LUNBTC Chart Signals
Break above EMA10, EMA50, and EMA100.
Full retrace completed.
Bullish RSI.
MACD entering the bullish.
Early signals.
Trade: Lunyr (LUNBTC)
BUY: 0.000500 - 0.0005400
TARGETS:
(1) 0.000641
(2) 0.000768
(3) 0.000860
(4) 0.000972
STOP: Close daily below 0.000430.
A BEAUTIFUL CALM DAY
Wishing you a beautiful calm day.
Namaste.

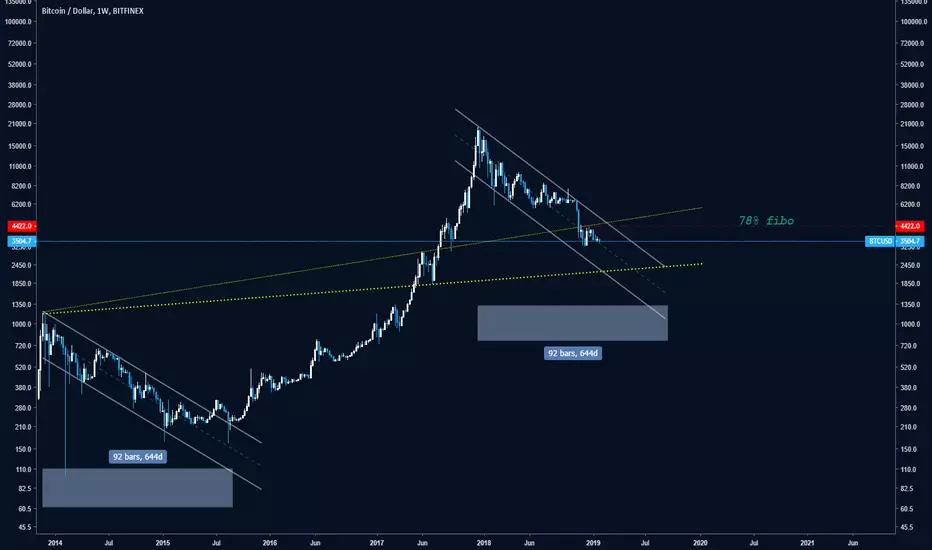
Bitcoin Breaking Out On Weekends (No Retrace + Altcoins)Many charts have been posted expecting a retrace for Bitcoin. Some are expecting a small retrace, like ourselves, while others are expecting a big retrace.
Looking at the chart above, so far there has been NO RETRACE when it comes to Bitcoin (XBTUSD). It just continues holding strong which is great news for the bulls.
Hit LIKE if you want to now... and let's get started.
Last year Bitcoin would retrace violently after any bullish action it produced was over.
It would make its move up and then be quickly be followed by a strong retrace, we are not seeing this anymore. From the last bullish wave, Bitcoin simply continues holding strong.
So let's look at some signals coming from the chart:
Bitcoin (XBTUSD) remains above EMA10, so it keeps its bullish potential.
1) Above EMA10 = bullish potential.
2) Below EMA10 = bearish potential.
Bitcoin remains fairly strong.
The RSI is solid and remains above 75, signaling that the bulls are in full control. Plus higher highs and higher low.
Judging at the action we have been seeing lately if Bitcoin drops it shouldn't be more than 100/150 points.
Lately Bitcoin has been breaking out on weekends, so let's keep an eye out this weekend to see if we can find a nice trade set up.
If enough of you hit like to show that you are interested, I will share a FULL trade for XBT with huge ROE (profits potential).
Our last XBT LONG trade generated over 103% ROE. You can see it here:
Bitcoin vs Altcoins (+Altcoins Market Behaviour)
The altcoins behavior has completely changed compared to past months. Altcoins are also holding really strong, consolidating, maintaining support and many are breaking above strong resistance primarily marked by EMA10 and EMA50 on the daily time frame. These are the strongest of the smaller market cap. alts which are preparing to move strongly when the next wave comes, so they need to take out the resistance now.
So we have Bitcoin holding its strongest in many months, and the alts doing exactly the same. We are seeing signals of strength all around and above average volume.
What will happen next marketwide?
My view: The alts will still do their crazy numbers, meaning, strong massive breakouts that can generate 30-50% profits in one single daily candle, but at the same time, it won't be the same as before.
I see, on the different charts, and feel, by studying them, that there will be lots and lots of sideways action and extended periods of long consolidation, so patience now will be more important than ever.
The cryptocurrency enthusiast is used to seeing great action, massive action and they don't like to buy when crypto is slow. So a slow market allows for more whale accumulation at the bottom, without alerting the masses. Remember that whales, advanced traders, smart money, and us, are the ones buying at the bottom, beginners are not.
So if the cryptocurrency market has found a bottom, even a temporary one, the masses won't know until everything is already moving strong.
So I advise patience, loading up on your favorite altcoins before the breakout, and waiting to collect profits on the way up.
Forget about big fast profits, it doesn't work. This should be about positioning yourself now, taking it easy and seeing how it all goes. Because once we are at the bottom, the only place left to go is up.
What's your take on what the market will do next? I believe a breakout is on its way, in many 3-5 days, where we can see a good move supported by momentum and strength.
Please share your charts and comments in the comments section below.
Hit like for more great content and very profitable trades for XBT, XRPH19 (this one is already in the works) and much more.
Thanks a lot for reading... I truly appreciate your support.
Namaste.


Litecoin Trade on BitMEX (Do I have Your Support?)You know the deal correct?
Take a look at the chart above, this is a clear trade set up that we have trade twice so far successfully.
You can see the direction and details marked on the chart. You can profit massively by doing a leveraged trade on BitMEX with this setup.
Enjoy it, this is for you.
Namaste.

[LTCH19][SHORT][10X][99.46% ROE]Trade: SHORT LTCH19
Leverage: 10X
Buy In: 0.01244 – 0.01210
Time Frame: 4H
Targets:
(1) 0.01170
(2) 0.01116
Stop Loss: Close 4H candle above 0.01265
Liq. Price: 0.01265
Profit Potential: 99.46% ROE
Capital Allocation: <4%.
---
Our Litecoin (LTCH19) trade as promised.
Please keep in mind that BitMEX trades are HIGH RISK.
High risk and fast high rewards.
Namaste.


Cardano Plays Several Different Scenarios (Possible +86.4%)We have an active trade for Cardano (ADABTC). So if you not into BitMEX, you can find that one here:
This one is now sitting within buy-in range.
Now, I am looking at the chart for Cardano (ADAH19), which is basically the BitMEX equivalent for ADABTC.
There are several scenarios that can play out here, you can see them drawn on the chart above.
But, with the last bullish wave from Bitcoin (BTCUSD) and several other marketwide indicators, there are big chances of profitable trade building up.
The basics are already written on the chart.
If you want to see a full trade for ADAH19, please let me know by hitting LIKE.
If enough Trading View readers, followers and supporters are interested, I'll be happy to share a full trade (buy-in range, targets, stop loss, capital allocation, profits potential and more) with you.
Your support is truly appreciated.
Namaste.

Cardano (ADAH19) Can We Trade Here? (64.1% ROE on 10X)Does it look like a good set up for you?
The retrace ended on a higher low with a reversal candlestick.
The volume isn't good enough but judging by other factors it can be a good call.
I am on 10X on this one.
Note: This is no trade advice. My trades contain buy in, target, stop loss, capital allocation, profits potential and more.
If you are interested in seeing a trade for Cardano (ADAH19), let me know in the comments section below.
Namaste.

Bitcoin (XBT) Trade (What You Asked For - 10X Leverage)I have a trade set up for Bitcoin (XBT) on 10X leverage ready for you.
The chart is self-explanatory.
Given enough support/attention/likes to this trade idea, and I will share the FULL trade details with you.
Note: This will be a full, safe and very profitable trade.
Namaste.

Bitcoin (XBT) About To Shoot Up (60%+ ROE on 25X)Bitcoin (XBT) is about to move up.
This is a friendly warning and not trading advice. Please trade at your own risk.
If you want to see my trades, please visit my profile. My trades contain buy in, stop loss, targets, capital allocation and more.
Thanks a lot for reading... Remember to hit LIKE.
Namaste.

Tron (TRXH19) Is About To DropI can see an upcoming drop happening for Tron (TRXH19), we can see a double top and the RSI is overbought.
TRXH19 is for BitMEX.
TRXBTC is the pair traded on most major exchanges.
TRXUSD for the dollar, etc.
This chart is for TRXH19 which is exclusive to BitMEX and BitMEX traders.
Same goes for BCHH19, EOSH19, ADAH19, etc.
When you see XBT. This is referring to Bitcoin on BitMEX.
When you see BTCUSD, this is referring to Bitcoin in general against USD.
So when you see these you can better decide for trading since the price are not equivalent... Meaning, you cannot always trade TRXBTC with a TRXH19 chart.
This is just a quick friendly reminder... What comes next is SHORT.
Namaste.


Bitcoin Cash Is BitMEX Ready - LONG Possible (155% ROE Possible)We've hit the .786 (0.0351) fib. retrace zone and received several signals that confirm a possible completion of this retrace.
A dragon fly doji with above average volume showed up, plus the RSI is coming out of oversold.
We see the same MA200 working as resistance here, as soon as this black line can be broken, expect our targets to be reached.
All details are on the chart. Targets and stop loss.
P.S. This is not a piece of trade advice. My trades contain all of the details needed to trade, buy-in, stop loss, targets, etc. So if you want to see a full trade for BCHH19, please show your support.
Thanks a lot for reading.
Namaste.

Litecoin Leveraged Trade -BitMEX [LTCH19][LONG][10X][80.89% ROE]Trade: LONG LTCH19
Buy in: 0.00849 - 0.00857
Leverage: 10X
Time Frame: 4H
Targets:
(1) 0.00880
(2) 0.00890
(3) 0.00922
Stop loss: Close 4H candle below 0.00831.
Capital allocation: <8%.
Profits Potential: 80.89% ROE
As promised... Low risk vs high reward.
Enjoy the trade.
Namaste.

BTC Sideways + Altcoins Update (BQX, WABI, UP, PAY, STEEM)Bitcoin hasn't been able to get out of the heavy waters, it is still just heavy for Bitcoin to move up. But the question is this, does Bitcoin wants to move up? What about the Altcoins?
Bitcoin is definitely not going up in the past few weeks but it also stopped going down. Lately, Bitcoin's volatility has been reduced to none, but not all is lost.
Hey Mr. Masters, but what about the altcoins?
The altcoins and Bitcoin are always correlated and in more than one way.
Right now we are seeing altcoins doing some really crazy numbers on some of the major cryptocurrency exchanges.
With Bitcoin in doubt and a bear market in full on mode, why would altcoins start breaking out all of a sudden this much?
This bullishness with the altcoins can be a signal that we are about to change trend or at least a very strong corrective wave up is coming... Whichever one it is, it is already happening... Let's take a look:
ETHOS (BQXBTC) . Does 200%+ Gains in a matter of days. The breakout was so strong that it took out EMA100 and reached all the way to EMA200.
BQXBTC also printed the highest volume bar ever. Dozens of times higher than January's bull run volume. Chart:
Then we have PAYBTC, WABIBTC, STEEMBTC and UPBTC generating huge gains as well in a very short period of time, just to name a few. The volume for these is also pretty high compared to average and earlier bullish action.
High volume on a weekend?
Super high volume on a weekend... Think about it.
The last time we had this type of bullish signals coming from the altcoins, we had almost two months of green action...
To me this looks just like a warm-up, things will become really crazy (positive) later this year. But it is good to see bullish action for the smaller alts with good momentum for a change, hopefully Bitcoin will follow.
You think the altcoins bullishness is a sign that market sentiment is changing?
You think Bitcoin is done going down or it needs some more?
Please share your comments in the comments section below.
Namaste.

Will Cardano (ADAH19) Move First? (34.5% ROE)
We've been waiting on our Bitcoin (XBT) trade to move this weekend, but it looks like Cardano (ADAH19) is taking the lead this time.
I wrote an article called "Cardano Retrace Complete", it seems to have become true:
Here is also one of our active Cardano (ADABTC) trades:
1) Getting back to the chart; looking at ADAH19 closer, short term, you can see that we received one of our "buy signals" based on candlestick reading. Which is marked yellow on the chart.
2) What I call the "confirmation", is the high volume breakout above resistance, in this case EMA10 (green line) and EMA50 (magenta).
3) MACD and RSI are bullish... Time for Cardano (ADA) to move.
4) I marked the direction, target, and support/stop loss zone on the main chart. If enough support is given to this trade idea, 100 LIKEs+, I will share with you a full, and very profitable trade, for ADAH19... Your support is truly appreciated.
Thanks a lot for reading, I am hoping you were entertained with this information and can profit from it.
Namaste.

Bitcoin (XBT) Trade @alanmasters - [XBT][LONG][10X][48.27% ROE]Trade: LONG XBT
Leverage: 10X
Buy In: $3615 - $3630
Time Frame: 4H
Targets:
(1) $3655
(2) $3705
(3) $3760
(4) $3800
Stop Loss: Close 4H candle below $3567.
Profit Potential: 48.27% ROE
Capital Allocation: <5%.
(Low risk, high reward).
---
Here is our Bitcoin (XBT) trade as promised.
I will be posting a Bitcoin (BTCUSD) update soon.
Your support is truly appreciated.
Make sure to hit LIKE to support your author and make sure you receive many more profitable and secure trades.
Namaste.
