#LEVER/USDT Potential liquidity sweep and pump#LEVER
The price is moving in a descending channel on the 1-hour timeframe. It has reached the lower boundary and is heading towards breaking above it, with a retest of the upper boundary expected.
We have a downtrend on the RSI indicator, which has reached near the lower boundary, and an upward rebound is expected.
There is a key support zone in green at 0.00001901. The price has bounced from this zone multiple times and is expected to bounce again.
We have a trend towards consolidation above the 100-period moving average, as we are moving close to it, which supports the upward movement.
Entry price: 0.00002022
First target: 0.00002089
Second target: 0.00002234
Third target: 0.00002437
Don't forget a simple principle: money management.
Place your stop-loss below the support zone in green.
For any questions, please leave a comment.
Thank you.
Leverage

#LEVER/USDT Potential liquidity sweep and pump#LEVER
The price is moving in a descending channel on the 1-hour timeframe. It has reached the lower boundary and is heading towards breaking above it, with a retest of the upper boundary expected.
We have a downtrend on the RSI indicator, which has reached near the lower boundary, and an upward rebound is expected.
There is a key support zone in green at 0.00001560. The price has bounced from this zone multiple times and is expected to bounce again.
We have a trend towards consolidation above the 100-period moving average, as we are moving close to it, which supports the upward movement.
Entry price: 0.00002021
First target: 0.00002080
Second target: 0.00002156
Third target: 0.00002252
Don't forget a simple principle: money management.
Place your stop-loss below the support zone in green.
For any questions, please leave a comment.
Thank you.

Leverage Is a Tool — Learn Risk, DCA & Capital EfficiencyIn trading, most failures don’t come from bad entries — they come from bad risk.
This post is a lesson in structured risk management , showing you how to use:
- Leverage as a tool for capital efficiency — not destruction
- DCA (Dollar-Cost Averaging) as a strategic method of entry
- Portfolio risk limits to define, control, and survive uncertainty
If you struggle with:
- Overexposure
- Emotional compounding
- Liquidation from small pullbacks
- No clear entry/exit framework...
… this lesson is for you.
🔐 Risk Management: The Non-Negotiable
Rule #1: Define how much you are willing to lose before entering a trade.
This is called your risk per trade , usually between 1–2% of your portfolio.
At 10%, you're being aggressive — and must have a plan to manage that exposure.
We don't control the outcome — we control the input:
- Entry
- Stop
- Size
- Risk
When you control those, drawdowns are survivable, and probability can do its job.
⚖️ Leverage: Use It Intelligently
Leverage is a tool , not a strategy.
Use it to reduce the amount of margin locked in a trade, not to increase your risk.
With defined stops and limited exposure, leverage lets you:
- Keep cash free for other trades
- Scale into high-conviction zones
- Stay efficient in the market
But uncapped leverage + undefined risk = guaranteed blowup over time.
📊 DCA: A Smarter Way to Scale
DCA (Dollar-Cost Averaging) isn't just for passive investing — it's powerful in trading too.
When the market moves into a reversal zone (support/resistance, divergence, order block, etc.), we don’t guess one perfect entry. Instead:
- Set an anchor entry
- Add 2–4 additional levels deeper into the zone
- Size each entry with increasing conviction (e.g. 1x, 2x, 4x)
This gives you a better average entry , avoids full fills on weak moves, and reduces emotional overreaction to early red positions.
📈 Best Practices (Save These)
✅ Always define risk in % of portfolio
✅ Use 1–3% risk max per trade unless fully planned
✅ Use higher timeframes (1D, 4H) for cleaner levels
✅ Pair DCA with reversal indicators — don’t DCA blindly
✅ Set SL below/above zone based on structure or ATR
✅ Only use leverage when risk is defined — never without a stop
✅ Never DCA into a loser without a stop — this isn't martingale
🛠️ Apply the Lesson — with the DCA Ladder + Risk Calculator
To make this practical, I’ve published a free tool here on TradingView:
👉 DCA Ladder Calculator by @RWCS_LTD
It lets you:
- Input portfolio value, risk %, and leverage
- See optimal entry prices and position sizes
- Understand stop loss placement
- Visualize how capital and risk are distributed
- Teach yourself capital-efficient execution
You can use it for both LONG and SHORT setups.
Pair this tool with your strategy, and your edge will stop bleeding from risk errors.
⚠️ Final Reminder
Risk is not something to react to — it’s something to define.
“It’s not about being right — it’s about not blowing up.”
🛡️ Disclaimer
This is not financial advice.
All content is for educational purposes only.
Trading with leverage involves risk of loss.
Always do your own research and consult a licensed financial advisor before acting on any ideas or tools.

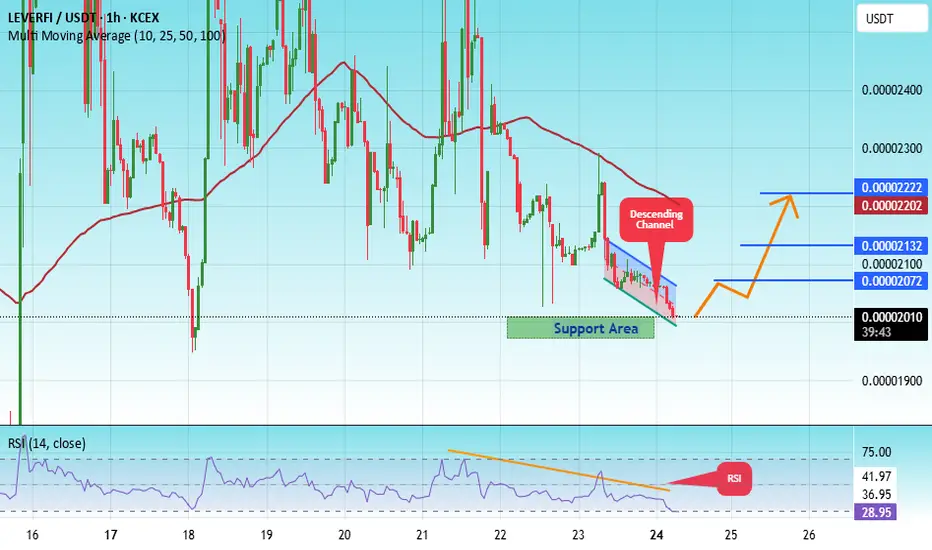
#LEVER/USDT Potential liquidity sweep and pump#LEVER
The price is moving within an ascending channel on the 1-hour timeframe and is adhering to it well. It is poised to break out strongly and retest the channel.
We have a downtrend line on the RSI indicator that is about to break and retest, which supports the upward move.
There is a key support zone in green at 0.00001992, representing a strong support point.
We have a trend of consolidation above the 100-period moving average.
Entry price: 0.00002009
First target: 0.00002072
Second target: 0.00002132
Third target: 0.00002222
Don't forget a simple money management rule.
Place your stop-loss order below the green support zone.
Once you reach the first target, save some money and then change your stop-loss order to an entry order.
For any questions, please leave a comment.
Thank you.
#LEVER/USDT Potential liquidity sweep and pump#LEVER
The price is moving within an ascending channel on the 1-hour timeframe and is holding well. It is poised to break out strongly and retest the channel.
We have a downtrend line on the RSI indicator that is about to break and retest, which supports the upward move.
There is a key support zone in green at 0.00002032, representing a strong support point.
We have a trend of consolidation above the 100-period moving average.
Entry price: 0.00002266
First target: 0.00002450
Second target: 0.00002610
Third target: 0.00002826
Don't forget a simple money management rule.
Place your stop-loss order below the green support zone.
Once you reach the first target, save some money and then change your stop-loss order to an entry order.
For any questions, please leave a comment.
Thank you.

#LEVER/USDT Potential liquidity sweep and pump#LEVER
The price is moving within an ascending channel on the 1-hour timeframe and is adhering to it well. It is poised to break out strongly and retest the channel.
We have a downtrend line on the RSI indicator that is about to break and retest, which supports the upward move.
There is a key support zone in green at 0.00002185, representing a strong support point.
We have a trend of consolidation above the 100-period moving average.
Entry price: 0.00002250
First target: 0.00002295
Second target: 0.00002350
Third target: 0.00002414
Don't forget a simple money management rule.
Place your stop-loss order below the green support zone.
Once you reach the first target, save some money and then change your stop-loss order to an entry order.
For any questions, please leave a comment.
Thank you.

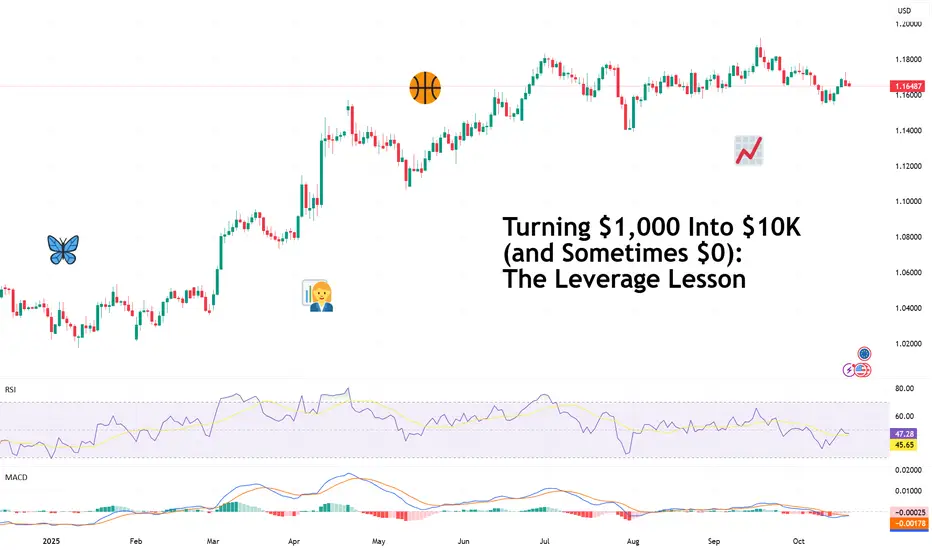
Turning $1,000 Into $10K (and Sometimes $0): The Leverage LessonEvery trader remembers their first brush with leverage — that magical moment when a modest account suddenly feels like a hedge fund.
You deposit $1,000, pop open TradingView, find your broker of choice , and boom — your buying power jumps to $30,000. You feel unstoppable as you imagine all the profits waiting for you out there.
And for a few moments, it works. A 1% move in your favor turns into a 30% gain. You start browsing for a new watch and a place in downtown Lisbon. But as every bruised and battered trader learns, leverage giveth and leverage obliterateth . That same 1% move against you? Game over.
Leverage is the financial equivalent of a sports car: thrilling, powerful, and incredibly dangerous in the wrong hands. Which, let’s be honest, most of us have been at some point.
If you take away anything from this piece, let it be this: if you wipe out 50% of your account, say, go from $1,000 to $500, it will take a 100% gain for you to get back even.
🧨 The Math That Makes (and Breaks) You
What exactly is leverage and what does it do? Leverage simply means you’re borrowing money to amplify your position size. A 1:10 ratio gives you control over $10,000 with just $1,000 of your own capital. The catch? You’re still responsible for all of it — the profits and the losses.
Here’s a general example:
• $1,000 with 1:10 leverage = $10,000 position.
• The market moves +1% = $100 profit. Nice.
• The market moves -1% = $100 loss. Manageable.
• The market moves -10%? That’s your entire $1,000 gone. Margin call city.
The higher your leverage, the narrower your margin for error. One bad candle, one unexpected news release , one mistimed coffee break when you’ve just loaded up ( during earnings , for example) and your performance can become a case study in volatility.
🧠 The Psychology of “More”
Here’s where it gets interesting: most traders don’t blow up their accounts because they misunderstand leverage — they blow up because they only think about the upside, how much they can make.
Leverage feeds every dangerous trading instinct: impatience, overconfidence, revenge trading, FOMO. “Next time we go bigger. Double down. We can make it back.” It makes rational risk management feel boring — and boredom, especially for a new trader, is unbearable.
Successful traders learn to see leverage for what it is: a tool, not a ticket. They understand that doubling down rarely doubles results, and that a steady pace — not speed — is the name of the game.
💡 The Smart Way to Use Leverage
So how do you wield this double-edged sword without losing a hand?
• Start small . New traders shouldn’t touch anything above 1:10 until they’ve mastered consistency.
Even pros rarely use their full leverage. And in the rare instances where they do, it usually ends up with a blowup. If you’d like to read up on the topic, Archegos Capital and LTCM are a good place to start.
• Use stop-losses religiously . A good stop-loss isn’t weakness; it’s insurance.
• Don’t equate margin with opportunity . Just because you can open a $50,000 position doesn’t mean you should.
• Think in percentages, not dollars . Most experienced traders aim to risk no more than 1–3% of their total equity per trade.
• Treat leverage like caffeine . A little sharpens focus. Too much and your hands start shaking and you lose sleep.
Leverage done right is a powerful tool that can help you get to your goals faster, smarter, and with fewer trades. But it can turn against you if you let it.
🪞 The Moral of the Margin Story
Leverage doesn’t make you a better trader. It makes your habits louder. If you trade emotionally, it amplifies your mistakes. If you trade methodically, it amplifies your discipline.
So yes, leverage can turn $1,000 into $10K — or into an expensive lesson in risk management. The deciding factor isn’t the multiplier on your screen; it’s the mindset behind your mouse.
In the end, trading is less about flexing your buying power and more about staying long enough to use it wisely.
Stay sharp, stay humble.
Off to you : What leverage do you usually use? Do you prefer to go 1:30 into forex or 1:10 into equities? Share your approach in the comments!
How to Short Gold as a Stock Trader and Profit on the DropGold is at historically high levels due to several key factors
Geopolitical Tensions: Trade disputes, regional conflicts, and global uncertainty are pushing investors toward safe-haven assets like gold
Monetary Policy Expectations: Anticipated interest rate cuts reduce the opportunity cost of holding gold, making it more attractive compared to bonds or cash
Weakening U.S. Dollar: A softer dollar makes gold cheaper for international buyers, boosting demand
Central Bank and Institutional Demand: Many central banks are increasing gold reserves, and institutional investors are allocating more to gold as a hedge against economic instability
Market Sentiment and Speculation: Bullish sentiment and speculative positioning are adding upward pressure on prices
If these factors start to ease, such as trade tensions reducing (highly likely with the next Trump Tweet), interest rates staying the same or even rising (less likely), or the dollar strengthening (likely), gold could start to pull back and given how aggressive its run has been, it could be a significant pull back.
For investors looking to profit from declines, inverse gold ETFs provide a way to benefit when prices fall, offering a strategic tool for hedging or directional trading.
They are a MUCH riskier type of trade - especially leverage ETFs so please do your research beforehand and definitely do not invest any money you can't do without if it all goes horribly wrong and Gold does indeed continue to head up past $5k.
Crazy times - hence probably why Gold is doing so well.
Buyer / bear - beware :)

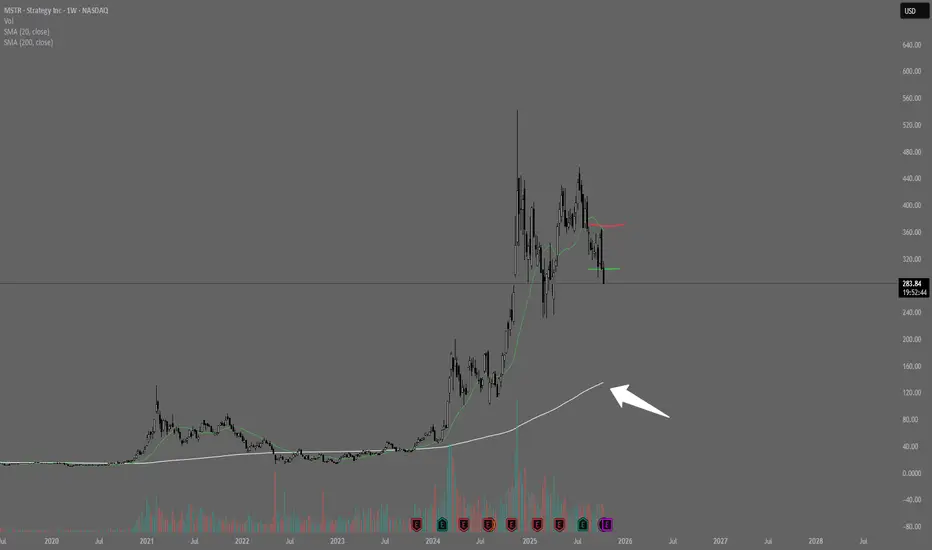
MSTR Hidden Leverage: What Happens When the Cycle Turns?When a company builds its balance sheet around Bitcoin, it becomes more than a software firm — it turns into a leveraged bet on BTC itself.
That’s exactly what MicroStrategy (MSTR) has done. And while this strategy paid off massively during Bitcoin’s uptrend, the same dynamic could become a serious liability when the cycle shifts.
1. The Amplified Correlation
MicroStrategy’s market cap is now deeply tied to the value of its Bitcoin holdings.
As BTC rallies, MSTR tends to outperform — sometimes doubling the percentage moves of Bitcoin itself.
But this also means that during downtrends, the drawdowns can be brutal.
In previous cycles, MSTR lost more than 80% of its value as BTC corrected.
2. The Nature of Hidden Leverage
Unlike traditional leverage through debt or derivatives, MSTR’s “leverage” comes from balance-sheet exposure.
The company has repeatedly issued convertible debt and used the proceeds to buy more Bitcoin.
In other words, the stock is effectively a leveraged vehicle on BTC — but with all the operational and financing risks of a public company layered on top.
3. When Sentiment Shifts
During bull markets, investors pile into MSTR as a regulated way to gain exposure to Bitcoin.
But when risk appetite fades, the same crowd exits just as fast.
That double pressure — falling BTC and capital rotation out of crypto — can trigger violent selloffs.
MSTR’s liquidity amplifies this volatility even further.
4. The Structural Risk
At current levels, MSTR’s valuation is heavily dependent on BTC maintaining or expanding its price range.
If Bitcoin consolidates or enters a deeper correction, the company’s debt-fueled exposure could start to weigh heavily.
This is where the “hidden leverage” shows its downside.
Leverage without leverage only works… until the market reminds you that it’s still leverage.
TRADING LEVERAGE | How to Manage RISK vs REWARDFor today's post, we're diving into the concept " Risk-Reward Ratio "
We'll take a look at practical examples and including other relevant scenarios of managing your risk. What is considered a good risk to reward ratio and where can you see it ? This applies to all markets, and during these volatile times it is an excellent idea to take a good look at your strategy and refine your risk management.
You've all noticed the really helpful tool " long setup " or " short setup " on the left-hand column. This clearly identifies the area of profit (in green), the area for a stop-loss (in red) and your entry (the borderline). It also shows the percentage of your increases or decreases at the top and bottom. It looks like this :
💭Something to remember; It is entirely up to you where you decided to take profit and where you decide to put your stop loss. The IDEAL anticipated targets are given, but the price may not necessarily reach these points. You have that entire zone to choose from and you can even have two or three take profits points in a position.
Now, what is the Risk Reward Ratio expressed in the center as a number.number ?
The risk to reward ration is exactly as the word says : The amount you risk for the amount you could potentially gain. NOTE that your risk is indefinite, but your gains are not guaranteed. The risk/reward ratio measures the difference between the entry point to a stop-loss and a sell or take-profit point. Comparing these two provides the ratio of profit to loss, or reward to risk.
For example, if you're a gambler and you've played roulette, you know that the only way to win 10 chips is to risk 5 chips. Your risk here is expressed as 5:10 or 5.10 .You can spread these 5 chips out any way you like, but the goal of the risk is for a reward that is bigger than your initial investment. However, you could also lose your 5 and this will mean that you need to risk double as much in your next play to make up for your loss. Trading is no different, (except there is method to the madness other than sheer luck...)
Most market strategists and speculators agree that the ideal risk/reward ratio for their investments should not be less than 1:3, or three units of expected return for every one unit of additional risk. Take a look at this example: Here, you're risking the same amount that you could potentially gain. The Risk Reward ratio is 1, assuming you follow the exact prices for entry, TP and SL.
Can you see why this is not an ideal setup? If your risk/reward ratio is 1, it means you might as well not participate in the trade since your reward is the same as your risk. This is not an ideal trade setup. An ideal trade setup is a scenario where you can AT LEAST win 3x as much as what you are risking. For example:
Note that here, my ratio is now the ideal 2.59 (rounded off to 2.6 and then simplified it becomes 1:3). If you're wondering how I got to 1:3, I just divided 2.6 by 2, giving me 1 and 3.
Another way to express this visually:
In the first chart example I have a really large increase for the long position and you can't easily simplify 7.21 so; here's a visual to break down what that looks like:
If you are setting up your own trade, you can decide at what point you feel comfortable to set your stop loss. For example, you may feel that if the price drops by more than 10%, that's where you'll exit and try another trade. Or, you could decide that you'll take the odds and set your stop loss so that it only triggers if the price drops by 15%. The latter will naturally mean you are trading at higher risk because your risk of losing is much more. Seasoned analysts agree that you shouldn't have a value smaller than 5% for your stop loss, because this type of price action occurs often during a day. For crypto, I would say 10% because we all know that crypto markets are much more volatile than stock markets and even more so than commodity markets like Gold and Silver, which are the most stable.
Remember that your Risk/Reward ratio forms an important part of your trading strategy, which is only one of the steps in your risk management program. Dollar cost averaging is another helpfull way to further manage your risk. There are many more things to consider when thinking about risk management, but we'll dive into those in another post.

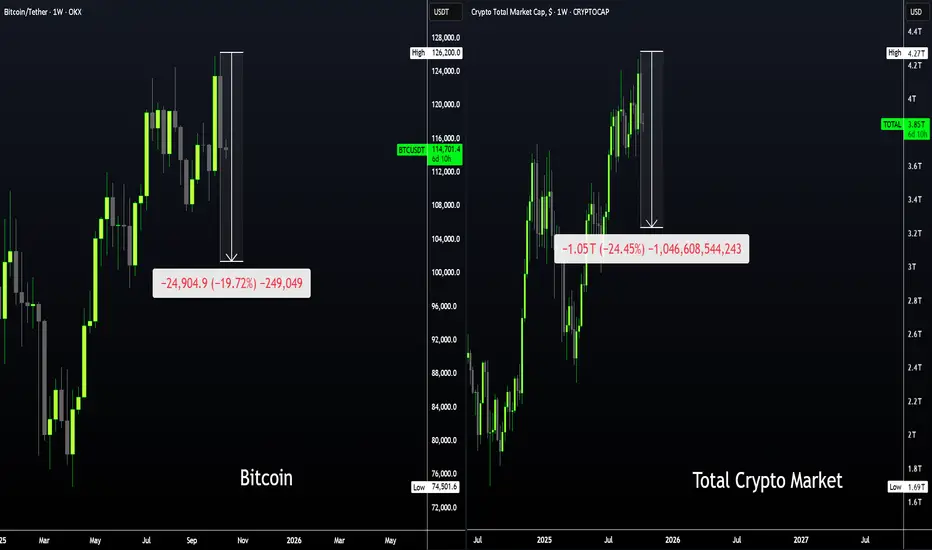
BIGGEST Crypto Liquidation TO DATE - Market CorrectsToday and yesterday over the past few hours, $19 billion dollars was wiped out in crypto. This is historic. And also a lesson in risk management, an eerie reminder of how risky speculation can be.
The market was over leveraged , and this is the result.
How can we monitor/ safeguard against this going ahead and be prepared for such an event in the future?
1) Always use a stop loss
2) Watch Bid/Ask spread and volatility
3) Use proper risk management
On the 10th of October, POTUS Donald Trump Tweeted about a new set of trade measures that include 100% tariff on certain Chinese exports, and new stricter export controls. The market immediately reacted; stocks and commodities dropped and crypto fell into chaos. What made this worse is that several exchanges were down, resulting in investors being unable to close or update their positions.
It seems like a fitting "reason" and also not, oddly. What we need to note here, is that the market was over leveraged. This is a self-correcting event that presents truer market reflections and better prices for investors - a blessing for those who were not affected/invested.
As an extra measure if you trade S&P500, you could watch the VIX - and set an indicator to any daily change greater than 15%-20%. This way, you'll be notified if there's action in the stock market.
You can also take a look at this idea on Risk vs Reward:
#LEVER/USDT Pump Anticipated#LEVER
The price is moving within a descending channel on the 1-hour frame, adhering well to it, and is heading for a strong breakout and retest.
We have a bearish trend on the RSI indicator that is about to be broken and retested, which supports the upward breakout.
There is a major support area in green at 0005705, representing a strong support point.
We are heading for consolidation above the 100 moving average.
Entry price: 0.0006015
First target: 0.0006441
Second target: 0.0006900
Third target: 0.0007600
Don't forget a simple matter: capital management.
When you reach the first target, save some money and then change your stop-loss order to an entry order.
For inquiries, please leave a comment.
Thank you.

GOLD => $4000 The MagnetGold has been pushing higher within its bullish log-chart structure, moving inside two rising channels (red short-term and blue long-term).
The interesting part? The $4000 level is acting like a magnet, and it happens to intersect with the upper bound of both channels. This rare confluence makes $4000 a key level to watch.
As long as the bullish momentum holds, Gold remains on track toward this magnet level. But once there, the reaction will be critical, a clean breakout could open the door for fresh highs, while a rejection may trigger a correction before continuation.
⚠️ Disclaimer: This is not financial advice. Always do your own research and manage risk properly.
📚 Stick to your trading plan regarding entries, risk, and management.
Good luck! 🍀
All Strategies Are Good; If Managed Properly!
~Richard Nasr

The Options Mirage: The Jackpot That’s Rigged Against YouMost retail traders fall in love with options because they seem to offer the impossible: with just a few hundred dollars you can dream of outsized returns. Fast money, easy money—at least that’s the story. With the right broker account and a handful of trades, the dream of becoming rich feels just around the corner.
What you’re not told—and what few truly understand given the complexity of the product—is that the “explosive payout” is not an opportunity. It’s a price. A very high one. And often inflated by the industry itself, knowing that the average investor (or rather, gambler) has no real way to calculate what they’re actually paying for. What you’re really buying is access to an extremely low probability of success, dressed up as a sophisticated strategy.
Yes, it’s the same psychology that drives lotteries and sports betting. And in finance, the odds aren’t any kinder.
The Baseline: the Where
At its simplest, speculation is about anticipating an up or down move in price.
Think it’s going up? Buy and aim to sell higher.
Think it’s going down? Sell and aim to buy back lower.
It sounds simple, but anyone with more than a month of trading experience can tell you it’s anything but. No one can predict the future with certainty. Still, this is at least a binary game: two mutually exclusive outcomes, like flipping a coin.
In technical terms, the market starts as a 50/50 distribution. With skill, analysis, and discipline, you might bias those odds slightly—say, 60/40 in your favor. That bias, repeated consistently, is what we call an edge. And with an edge, the path to long-term success is paved.
The Illusion of Acceleration
But let’s be honest: who wants to grind out a 60/40 edge slowly? We’re here for the Lamborghini, right? And the sooner the better.
That’s where the industry steps in with its “solution”: options. The promise is seductive—leverage the process, accelerate the outcome. With little money down, you can aim for massive returns. What’s not to like?
The problem is that the acceleration doesn’t come for free. To deliver those explosive payouts, the game adds layers of complexity.
From Where… to How and When
In options, you don’t just need to be right about where price is going.
You also need to be right about how it moves. That’s volatility—the speed and amplitude of the move. Even if you guess the direction correctly, if the move isn’t strong enough to beat strike + premium, you lose.
And then comes the when. Options expire. Time works against you. With the rise of 0DTE options, this window has shrunk to a single day. You might be perfectly right on direction and volatility—but if it happens tomorrow instead of today, your trade is worthless.
Now here’s the key point: this isn’t additive complexity. It’s multiplicative. Each layer collapses your probability of success exponentially. Even though the mathematical proof could be enlightening, I have promised not to use heavy math in this blog. All you need to know is this: in the majority of cases, that collapse in probability is not evenly compensated by the outsized payout. And this is exactly what most retail traders fail to perceive.
It’s not just that you’re playing a harder game—it’s that you’re playing a biased one, where the odds are stacked even further against you.
The Lottery Bias: The Cognitive Trap
Here’s where psychology plays its cruelest trick. The lower the probability of success, the higher the payout offered. In fact, it’s not even the full payout you deserve—it’s a discounted, haircut payout, cleverly packaged so you don’t notice because the potential number is so large. And that number lights up the brain like a jackpot.
The industry knows this. It builds its business on the fact that humans systematically overestimate tiny probabilities and underestimate the certainty of losing. Retail traders convince themselves they’re being clever: risking little for the chance at something huge. But the math is merciless—the expected value is brutally negative.
The market is not handing you an edge. It’s dismantling any possibility you had of one. That giant payout you see? It’s not a gift—it’s a warning label.
And yes, I know you can point to stories about the guy who hit the jackpot, who “proved the math wrong.” But let me ask you this: do you know what survivorship bias is? If you don’t, and you’re trading options, here’s some professional advice for free—go and read about it before you place your next trade.
The Real Path to the Lambo
What gets sold as “smart leverage” is, in truth, just a lottery ticket wearing a suit. The Lambo doesn’t come from hitting jackpots. It comes from consistency—from repeating disciplined decisions with positive expectancy until compounding does its quiet but powerful work.
And yes, I know most traders are in a hurry. The good news? The process can be accelerated—but not by gambling on options with negative expectancy. It can be accelerated using technical, rational tools. Once an edge is established, leverage makes sense. That’s where concepts like the Kelly criterion come in: scaling growth aggressively, but without walking straight into ruin. (I’ve already written about Kelly earlier in this blog: here.)
Conclusion
We’ve stripped the illusion bare: more conditions don’t make you smarter, they make you less likely to succeed. What feels like a shortcut is nothing more than a statistical mirage—the financial equivalent of a lottery ticket, marketed to you as a “highway to riches,” exploiting your belief that complexity equals intelligence.
Unfortunately, the narrative is powerful, because it preys directly on cognitive bias. I know I’m swimming against the tide here. I know this post won’t go viral. I don’t expect many to believe what the math has to say about options trading.
But maybe, just maybe, a small number of traders reading this will see beneath the surface and save their time, energy, and money for better pursuits. If that’s you, then this post has already done its job.
If you can resist the mirage and stick to building real edges, you’ve already won a key battle—and most likely saved yourself a costly trading lesson.

From Mystery to Mastery: Futures ExplainedIntroduction: The World of Futures
Few markets capture the essence of trading like futures. They are instruments that link commodities, currencies, interest rates, and equity indexes into one unified marketplace. For traders, this means access to global opportunities and true diversification in a single product class.
At first, futures may appear intimidating: leverage, margin requirements, expiration dates, and contract rolls all add layers of complexity. Yet these same features are what make futures powerful. They allow traders to express views on global markets with efficiency and precision.
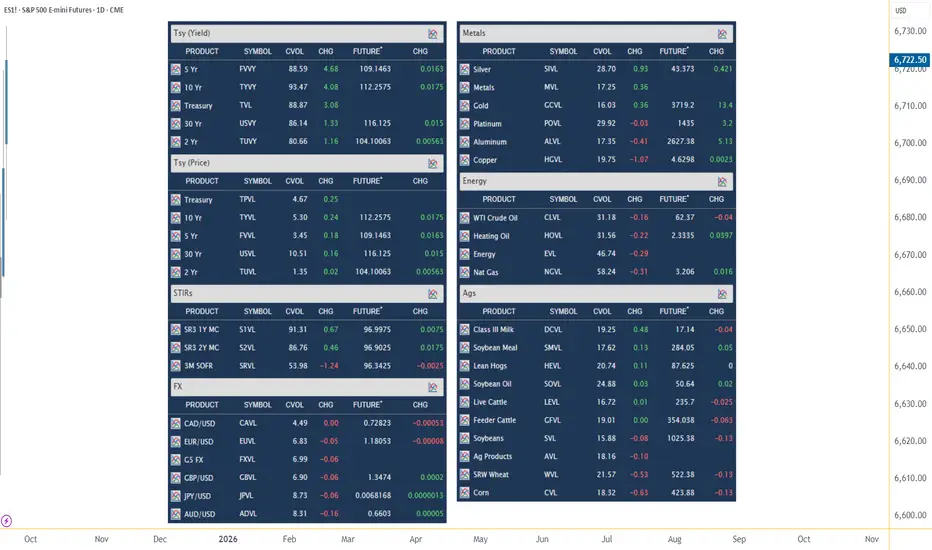
The main chart above — a table of major futures contracts across asset classes — makes one thing immediately clear: futures aren’t about trading just one market. They’re about trading them all. Whether you want exposure to equities (S&P 500, Nasdaq), commodities (crude oil, gold, corn), currencies (euro, yen, bitcoin), or interest rates (Treasuries, Eurodollars), futures provide a standardized, transparent, and centralized way to do so.
This breadth is why professionals rely on futures: they allow traders to balance risk across multiple sectors, hedge portfolios, and capture opportunities wherever they appear. For those looking to go beyond single-market thinking, futures open the door to true diversification.
What Are Futures?
At their core, futures are standardized agreements to buy or sell an asset at a specified price on a future date. While the concept sounds simple, the structure behind these contracts makes them unique among trading instruments.
Key Characteristics
Standardization: Each futures contract is standardized in terms of size, tick value, and expiration cycle. This standardization ensures transparency and liquidity.
Centralized Trading: Futures are traded on regulated exchanges, which reduces counterparty risk. Clearing houses guarantee that both sides of the trade meet their obligations.
Settlement: Some futures are physically settled (e.g., certain commodities), while others are cash-settled (e.g., equity index futures).
Standard vs. Micro Futures
Not all traders operate with the same account size. Recognizing this, exchanges introduced micro contracts.
Standard Contracts: Designed for institutional or larger retail traders, these carry higher notional values and margin requirements.
Micro Contracts: Smaller in size — often 1/10th of the standard — they allow traders to participate in the same markets with reduced exposure.
This tiered structure means that futures are accessible to traders of all levels. Whether someone wants to hedge a portfolio worth millions or test strategies with smaller risk, futures provide an efficient and scalable solution.
Futures are not just speculative instruments — they are risk-transfer mechanisms. Farmers, corporations, and investors all rely on them, which is why they remain at the heart of global finance.
The Mechanics of Futures Trading
Futures stand apart from other instruments because of how they embed leverage and daily settlement into every trade. These mechanics create both opportunity and responsibility for traders.
Leverage
Futures require only a fraction of the contract’s value — the margin — to open a position. This allows traders to control large notional values with relatively small capital. For example, a trader might only need a few thousand dollars in margin to manage exposure worth hundreds of thousands.
Advantage: Small price movements can translate into significant gains.
Risk: The same leverage can magnify losses just as quickly.
Margin and Daily Settlement
Unlike buying stocks outright, futures accounts are marked-to-market daily. This means:
Gains are credited to your account at the end of each session.
Losses are debited immediately.
If losses exceed available funds, a margin call requires the trader to deposit more capital or close the position.
Ticks and Point Values
Each futures contract has a minimum price movement called a tick, and each tick has a specific dollar value. Understanding tick value is essential for risk management — it tells you exactly how much you gain or lose with each price move.
Liquidity and Execution
Because contracts are standardized and exchange-traded, liquidity is often concentrated in a few active expirations (called “front months”). This ensures tight bid-ask spreads, but also means traders must roll positions forward as contracts near expiration.
Takeaway
The mechanics of futures amplify both efficiency and risk. Traders who respect leverage, understand margining, and monitor tick exposure can harness futures effectively. Those who overlook these mechanics, however, quickly discover how unforgiving futures can be.
Market Structure & Term Dynamics
One of the most fascinating — and misunderstood — aspects of futures trading is how contracts across different expirations reveal the market’s expectations. Unlike stocks, which represent a single price, futures unfold into a forward curve that tells a story about supply, demand, and sentiment.
Contango and Backwardation
Contango occurs when longer-dated contracts trade at higher prices than near-term ones. This often reflects storage costs, financing, or expectations of rising prices.
Backwardation happens when near-term contracts are more expensive than those further out, usually signaling scarcity or short-term demand pressure.
These structures aren’t static — they shift with economic conditions, inventory levels, and seasonal trends.
Seasonality
Many futures contracts display recurring patterns tied to the calendar. Agricultural futures respond to planting and harvest cycles, while energy markets often reflect seasonal consumption (e.g., heating oil demand in winter). Recognizing these cycles helps traders anticipate periods of heightened volatility.
Visualizing Structure and Seasonality
The below chart shows both a forward curve and seasonality patterns for a futures contract. Together, they highlight how futures pricing extends beyond the present moment:
• The forward curve reflects the market’s consensus outlook.
• Seasonality overlays historical tendencies, offering context for recurring patterns.
Why It Matters
Understanding term structure is vital for anyone holding positions across different expirations or engaging in spread trading. Futures aren’t just about today’s price — they’re about how markets evolve over time.
Applications of Futures
Futures are not just trading instruments; they are multipurpose tools that serve a wide spectrum of market participants. Their versatility explains why they sit at the center of global finance.
Directional Trading
Speculators use futures to express bullish or bearish views with efficiency. Leverage allows for significant exposure to price moves, making futures attractive for active traders seeking short-term opportunities.
Hedging Portfolios
Institutions, corporations, and even individual investors use futures to offset risks in other holdings.
An equity investor can hedge downside risk with stock index futures.
An airline can hedge rising fuel costs using energy futures.
A farmer can lock in prices for crops months before harvest.
Hedging is one of the foundational purposes of futures markets: transferring risk from those who wish to avoid it to those willing to accept it.
Spread Trading
Some traders don’t speculate on outright direction but instead on relationships between contracts. Examples include:
Calendar spreads: buying one expiration and selling another to trade the forward curve.
Intermarket spreads: trading related products, such as heating oil vs. crude oil, to capture relative value.
Diversification
The table shown earlier — featuring futures contracts across asset classes — demonstrates another application: diversification. Futures allow traders to move seamlessly between equities, commodities, currencies, and interest rates, building portfolios that respond to multiple market drivers instead of just one.
Takeaway
Whether for speculation, hedging, spreads, or diversification, futures adapt to the needs of a wide range of traders. Their applications extend well beyond simple directional bets, offering structured ways to manage both risk and opportunity.
Risk Management with Futures
The power of futures lies in their leverage and efficiency — but that same power can work against traders who fail to respect risk. Effective risk management is not optional; it is the foundation of survival in futures markets.
Position Sizing with Leverage
Every tick has a dollar value, and with leverage, even small moves can produce large swings in account equity. Proper position sizing ensures that a single move doesn’t exceed acceptable risk tolerance. A common approach is to size positions so that a stop-loss hit represents no more than 1–2% of account capital.
Margin Calls and Volatility Exposure
Because accounts are marked-to-market daily, losses are settled immediately. If losses exceed available funds, the trader faces a margin call — forcing them to either deposit additional capital or close positions. This mechanism protects the system but punishes overleveraged traders quickly.
Diversification as a Risk Tool
The futures contracts table highlighted at the top illustrates how diversification itself can be a form of risk management. A trader holding positions across equity, energy, and agricultural futures is likely less vulnerable to a single market shock than someone concentrated in one asset class.
Stop-Losses and Technical Reference Points
Using support, resistance, or UFO zones to anchor stop-loss levels ensures that exits are based on market structure rather than arbitrary distances. This provides logic to risk management instead of guesswork.
The Core Principle
Risk in futures is never eliminated — it is managed. By combining proper position sizing, diversification, and disciplined use of stops, traders can survive volatility long enough to let their edge play out.
Case Study: Applying Structure in Futures
To see how futures amplify both opportunity and risk, let’s walk through a structured trade in the 6E (Euro FX Futures) market.
Setup
Entry: 1.1468
Stop-Loss: 1.1376
Target: 1.17455
Confirmed by UFO support zone, SMA ribbon trend alignment, and candlestick reaction.
Risk and Reward in Price Terms
Risk per contract = Entry – Stop = 1.1468 – 1.1376 = 0.0092 (92 pips).
Reward per contract = Target – Entry = 1.17455 – 1.1468 = 0.02775 (277.5 pips).
Reward-to-Risk Ratio (R:R) = 277.5 ÷ 92 ≈ 3.0
This trade carries roughly a 3:1 reward-to-risk ratio, a structure many traders aim for.
P&L in Dollar Terms (6E Futures)
Each tick in 6E = 0.00005 = $6.25.
Risk (0.0092 ÷ 0.00005 = 184 ticks): Dollar risk = 184 × $6.25 = $1,150 per contract.
Reward (0.02775 ÷ 0.00005 = 555 ticks): Dollar reward = 555 × $6.25 = $3,468 per contract.
Margin and Return on Margin
Initial margin for 6E is typically in the range of a few thousand dollars (varies by broker and volatility).
Assuming margin is $2,500 per contract, this trade structure would imply a potential loss of $1,150 ≈ 46% of margin or a potential gain of $3,468 ≈ 139% of margin.
It’s critical to highlight that return on margin is not the same as return on account balance. A trader may have $50,000 in their account but only post $2,500 margin per contract. While the trade may show a 139% return on margin, the return on the entire account would be far smaller.
Takeaway
This example shows how futures transform price movements into significant dollar impacts. With leverage, a well-structured trade can deliver powerful gains, but the same leverage means poor risk control can erode capital quickly. Mastery comes from respecting this scale, not chasing it.
Practical Considerations
Even with a solid framework and strong risk management, futures trading has nuances that shape how trades play out in real life.
Trading Sessions and Liquidity
Futures trade nearly 24 hours a day, but liquidity isn’t evenly distributed. The most active periods typically align with the opening hours of major financial centers:
European session: Currency and interest rate futures see heavier flow.
U.S. session: Stock index and commodity futures dominate.
Asian session: Liquidity thins, often leading to sharper moves on lighter volume.
Knowing when your product is most active helps improve order execution and reduce slippage.
Volatility Cycles
Markets expand and contract in volatility. Equity index futures often see bursts of activity at the cash open and close, while energy and agricultural contracts may spike around scheduled reports. Adjusting stop distances and position sizes for these cycles is essential.
Event-Driven Moves
Futures are highly sensitive to macroeconomic and geopolitical events. Examples include:
Nonfarm payrolls shaking currency and index futures.
FOMC decisions moving rates and equity products.
Crop reports swinging agricultural markets.
OPEC meetings shifting energy futures.
For short-term traders, being aware of the calendar is as important as reading a chart. A well-structured trade can still fail if caught on the wrong side of an event-driven move.
Rolls and Expirations
Because futures expire, traders holding positions beyond front-month liquidity must roll contracts into later expirations. This roll process can impact pricing, particularly when term structure (contango or backwardation) is steep.
Bottom Line
Practical mastery comes from understanding not just the trade setup, but also the context in which it plays out. Futures reward preparation and punish oversight — especially around sessions, events, and expiration cycles.
Conclusion: Futures as a Path to Mastery
Futures can seem overwhelming at first glance — with leverage, margining, expiration dates, and shifting forward curves, they feel far more complex than simply buying or selling shares. But behind the layers of complexity lies a simple truth: futures are among the most versatile tools in finance.
In this guide, we’ve seen how futures:
Provide access to multiple asset classes, enabling true diversification.
Embed leverage that magnifies both opportunity and risk.
Reveal market expectations through forward curves and seasonality.
Support applications ranging from speculation to hedging and spread trading.
Demand structured risk management, since dollar impacts are amplified.
The case study showed how even one structured trade can transform when executed through futures. Defined entries, stops, and targets remain the same, but leverage changes the scale of both outcomes and responsibilities.
Futures trading is not about eliminating uncertainty. It is about engaging with markets in a disciplined way — using diversification, structure, and risk control to transform potential chaos into calculated opportunity.
This article is the second step in the From Mystery to Mastery series. Having laid the foundation in Trading Essentials and expanded into futures here, the journey continues next into the world of options, where versatility and complexity reach an even higher level.
From Mystery to Mastery trilogy:
When analyzing futures markets, keep in mind that some chart data may be delayed. The examples in this article highlight how futures can be applied across asset classes, from equities and currencies to commodities and interest rates — many of which are listed on CME Group exchanges. For traders who require real-time access to these products on TradingView, a dedicated CME Group real-time data plan is available here: www.tradingview.com . This is especially useful for shorter-term futures traders who rely on intraday precision, while longer-term participants may not find the same urgency in upgrading.
General Disclaimer:
The trade ideas presented herein are solely for illustrative purposes forming a part of a case study intended to demonstrate key principles in risk management within the context of the specific market scenarios discussed. These ideas are not to be interpreted as investment recommendations or financial advice. They do not endorse or promote any specific trading strategies, financial products, or services. The information provided is based on data believed to be reliable; however, its accuracy or completeness cannot be guaranteed. Trading in financial markets involves risks, including the potential loss of principal. Each individual should conduct their own research and consult with professional financial advisors before making any investment decisions. The author or publisher of this content bears no responsibility for any actions taken based on the information provided or for any resultant financial or other losses.
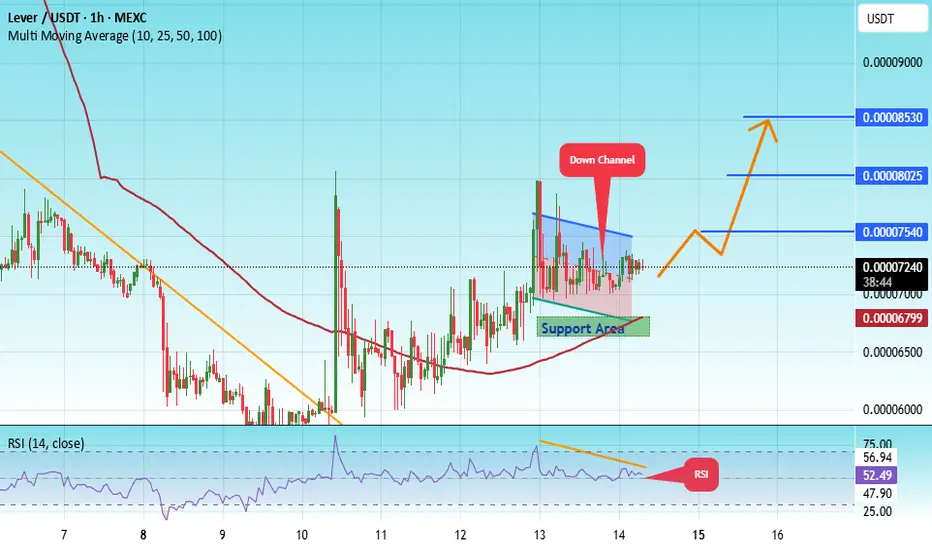
#LEVER/USDT Forming Strong Falling Wedge#LEVER
The price is moving within a descending channel on the 1-hour frame, adhering well to it, and is heading for a strong breakout and retest.
We have a bearish trend on the RSI indicator that is about to be broken and retested, which supports the upward breakout.
There is a major support area in green at 00006680, which represents a strong support point.
For inquiries, please leave a comment.
We are in a consolidation trend above the 100 moving average.
Entry price: 0.00007260
First target: 0.00007540
Second target: 0.00008000
Third target: 0.00008530
Don't forget a simple matter: capital management.
When you reach the first target, save some money and then change your stop-loss order to an entry order.
For inquiries, please leave a comment.
Thank you.
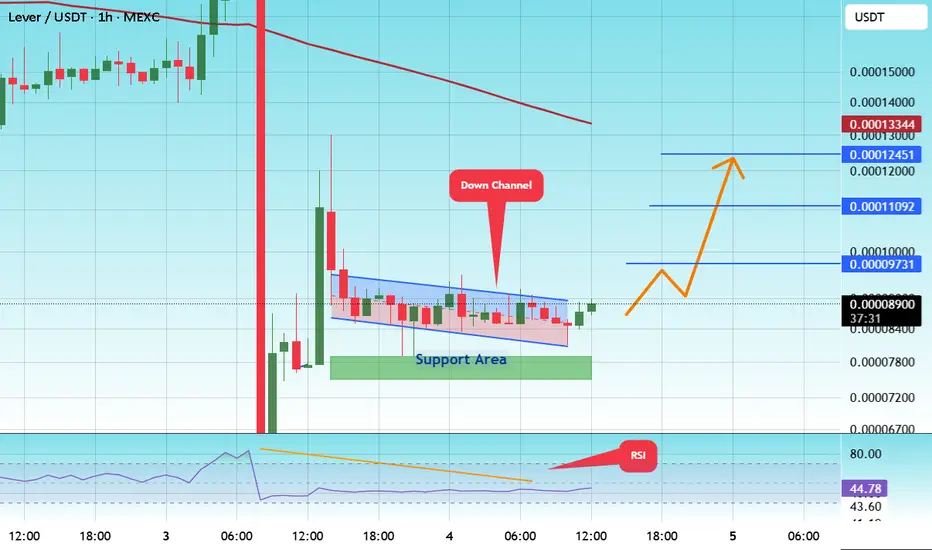
#LEVER/USDT Forming Strong Falling Wedge#LEVER
The price is moving within a descending channel on the 1-hour frame and is expected to break and continue upward.
We have a trend to stabilize above the 100 moving average once again.
We have a downtrend on the RSI indicator that supports the upward break.
We have a support area at the lower boundary of the channel at 0.00008220, acting as strong support from which the price can rebound.
We have a major support area in green that pushed the price upward at 0.00007700.
Entry price: 0.0008760.
First target: 0.00009730.
Second target: 0.00011092.
Third target: 0.00012450.
To manage risk, don't forget stop loss and capital management.
When you reach the first target, save some profits and then change the stop order to an entry order.
For inquiries, please comment.
Thank you.
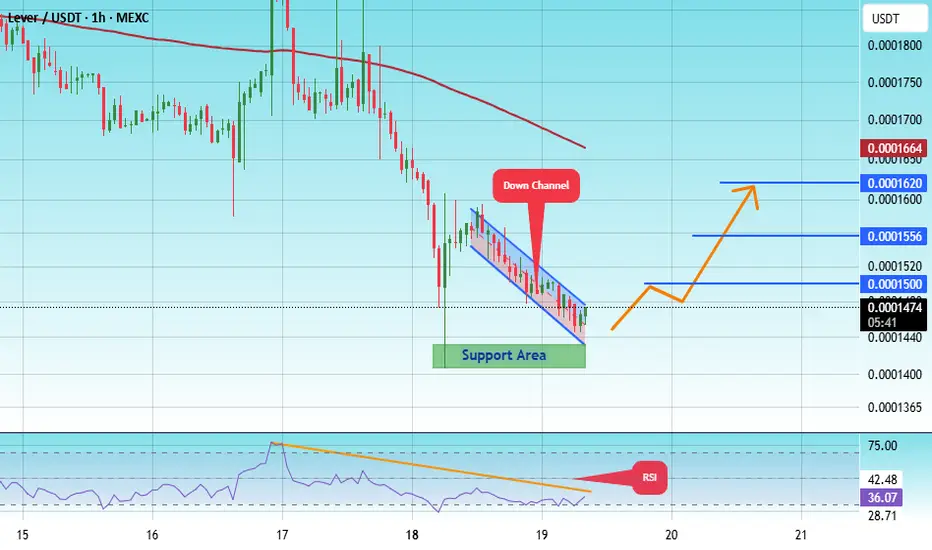
#LEVER/USDT Forming Strong Falling Wedge#LEVER
The price is moving within a descending channel on the 1-hour frame, adhering well to it, and heading for a strong breakout and retest.
We have a bearish trend on the RSI indicator that is about to be broken and retested, which supports the upward breakout.
There is a major support area in green at 0.0001388, which represents a strong support point.
For inquiries, please leave a comment.
We are in a consolidation trend above the 100 moving average.
Entry price: 0.0001476
First target: 0.0001537
Second target: 0.0001656
Third target: 0.0001800
Don't forget a simple matter: capital management.
When you reach the first target, save some money and then change your stop-loss order to an entry order.
For inquiries, please leave a comment.
Thank you.

#LEVER/USDT Forming Strong Falling Wedge#LEVER
The price is moving within an ascending channel on the 1-hour frame, adhering well to it, and is poised to break it strongly upwards and retest it.
We have support from the lower boundary of the ascending channel, at 0.0001435.
We have a downtrend on the RSI indicator that is about to break and retest, supporting the upward trend.
There is a key support area in green at 0.0001412, which represents a strong basis for the upward trend.
Don't forget one simple thing: ease and capital.
When you reach the first target, save some money and then change your stop-loss order to an entry order.
For inquiries, please leave a comment.
We have a trend of stability above the Moving Average 100.
Entry price: 0.0001459
First target: 0.0001500
Second target: 0.0001556
Third target: 0.0001620
Don't forget one simple thing: ease and capital.
When you reach the first target, save some money and then change your stop-loss order to an entry order.
For inquiries, please leave a comment.
Thank you.
Leverage in Crypto: The Sexy Lie vs. The Boring TruthLet’s be honest: the vast majority of crypto traders don’t come with a trading background. Not in stocks, not in futures, and definitely not in leveraged Forex.
Most enter crypto because of hype, the dream of fast money, and stories of overnight millionaires.
That’s why leverage in crypto is so dangerous. It’s not just a tool — it’s a trap for the unprepared.
________________________________________
What leverage really means
To keep it simple: with 100× leverage, every 1% move in your favor doubles your account, but every 1% move against you wipes it out completely.
👉 No matter the asset — Forex, Gold, Bitcoin, or meme coins — at 100× leverage you only have 1% room to be wrong.
________________________________________
Yesterday’s market moves – a perfect example
Yesterday, markets exploded across all asset classes:
• EURUSD → +1%
• Gold (XAUUSD) → +1.5%
• Bitcoin (BTC) → +4%
• Ethereum (ETH) → +8%
• PEPE, other coins and meme coins → +10%+
Now imagine trading them with 100× leverage, catching the bottom and selling at the top:
• EURUSD → +100% (account doubled)
• Gold → +150%
• BTC → +400%
• ETH → +800%
• PEPE → +1000%
Sounds incredible, right?
But here’s the other side: with 100× leverage, a –1% move against you = instant liquidation.
________________________________________
Effective Leverage – The Hidden Concept
Effective leverage — you rarely see it explained. Why?
Because it’s not sexy, not marketable, and most of all… exchanges and brokers don’t want this to be very clear.
Nominal leverage (the 50×, 100×, 200× banners you see everywhere) sells dreams. Effective leverage, on the other hand, shows the brutal reality: how much exposure you actually control compared to your account size.
Formula:
Effective Leverage=Position Size/Account Equity
• Example 1 (Forex): $1,000 account, $5,000 EURUSD position = 5× effective leverage.
• Example 2 (Crypto): $100,000 account, BTC at $100k, controlling 5 BTC ($500,000 position) = 5× effective leverage.
👉 Nominal leverage is the ad. Effective leverage is the invoice.
And once you understand it, the marketing magic disappears.
________________________________________
A concrete example – Solana trade
Let’s take a real setup I shared recently on Solana:
• Entry: buy at $200
• Stop Loss: $185 → risk on the asset = -7.5%
Case 1 – 100× leverage
From 200 → 198 (–1%), you’re liquidated. You never reach your stop at 185.
Case 2 – 10× effective leverage
Every 1% move = 10% account swing. You could survive down to 180, but you’d be under constant stress.
Case 3 – 2× effective leverage (my choice)
Let’s say you control $2,000 worth of SOL, effectively $4,000 exposure.
• If Solana falls to 185 (–7.5%), that’s a –15% hit to your account. Painful, but survivable.
• If Solana rises to 250 (+25%), with 2× leverage you make +50% on allocated capital.
• Risk–reward ratio: ~1:3.3 — sustainable, worth taking.
________________________________________
The psychological factor
This is where leverage breaks most traders.
• With 100× leverage, every 0.2% fluctuation moves your account by 20% (≈ $400 on a $2,000 account). Every 1% move = liquidation. How do you stay calm? You don’t.
• With 2× effective leverage, a 1% fluctuation only moves your account 2% (≈ $40). Boring? Maybe. Survivable? Absolutely.
Now imagine: you enter SOL at 200 with 100× leverage.
• At 202, you’ve doubled your account.
• At 210, you’ve made 5×.
But will you hold? No. Because:
1. If you’re awake, the stress of watching wild swings (in money, not in price) forces you to close early.
2. If you do hold, it’s usually because you were asleep — or the move happened in a single violent candle.
Markets never move in a straight line. They go 200 → 202 → 201 → 203 → 201 → 205…
At 100× leverage, every retracement feels like life or death. At 2× leverage, it’s just noise.
________________________________________
Conclusion
Leverage isn’t evil. It’s just a tool. But in crypto, with insane volatility and inexperienced traders, it becomes a weapon of mass destruction.
• At 100×, you’re gambling on the next 1% very small move.
• At 10×, you’re constantly stressed and one bad move away from ruin.
• At 2×–5× effective leverage, you can actually follow your plan, respect your stop, and let your targets play out.
Trading isn’t about adrenaline. It’s about survival.
High leverage destroys accounts — and discipline. Small, controlled leverage gives you the one thing you need most in trading: time.
P.S.
Of course, the choice is yours — what leverage you decide to use, whether you take into consideration the concept of effective leverage, or how you handle the psychological impact of high leverage.
But at least now, you know. 🙂

#LEVER/USDT#LEVER
The price is moving within an ascending channel on the 1-hour frame, adhering well to it, and is poised to break it strongly upwards and retest it.
We have support from the lower boundary of the ascending channel, at 0.0001800.
We have a downtrend on the RSI indicator that is about to break and retest, supporting the upward trend.
There is a key support area in green at 0.0001780, which represents a strong basis for the upward trend.
Don't forget one simple thing: ease and capital.
When you reach the first target, save some money and then change your stop-loss order to an entry order.
For inquiries, please leave a comment.
We have a trend of stability above the Moving Average 100.
Entry price: 0.0001877
First target: 0.0001938
Second target: 0.0002026
Third target: 0.0002110
Don't forget one simple thing: ease and capital.
When you reach the first target, save some money and then change your stop-loss order to an entry order.
For inquiries, please leave a comment.
Thank you.

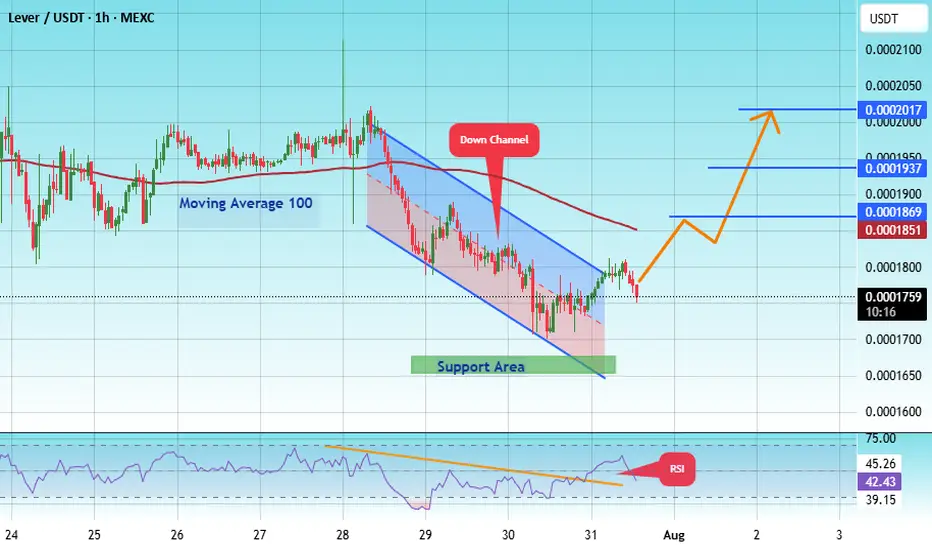
#LEVER/USDT#LEVER
The price is moving within an ascending channel on the 1-hour frame, adhering well to it, and is poised to break it strongly upwards and retest it.
We have support from the lower boundary of the ascending channel, at 0.0001664.
We have a downtrend on the RSI indicator that is about to break and retest, supporting the upward trend.
There is a key support area (in green) at 0.0001673, which represents a strong basis for the upward trend.
Don't forget one simple thing: ease and capital.
When you reach the first target, save some money and then change your stop-loss order to an entry order.
For inquiries, please leave a comment.
We have a trend of stability above the Moving Average 100.
Entry price: 0.0001757
First target: 0.0001870
Second target: 0.0001937
Third target: 0.0002017
Don't forget one simple thing: ease and capital.
When you reach the first target, save some money and then change your stop-loss order to an entry order.
For inquiries, please leave a comment.
Thank you.
Dogecoin Turns Bullish · Leveraged Trade · 3320% Potential @8XThe support zone is the 0.618 - 0.786 Fib. retracement levels marked blue and purple on the chart. We can clearly see two hammers (candlestick patterns), last week and this week. We can see the higher lows but also the broader rising channel structure. We can also see the even bigger structure coming from the low in 2024. In short, a long-term bullish cycle unfolding right in front of our eyes... Dogecoin is going up.
I am approaching this pair for my people with high leverage. High leverage means high risk. At the same time, we also have a very high potential for reward. The last target goes beyond 3,000%.
You don't have to go for all the targets nor all the lev. You can use lower leverage for less risk, more stability and peace of mind. You can do 2-3X and this would be a safe trade setup. You can do 4-5X for mild risk but still a strong potential for reward. And finally, you can do 6-8X as an expert knowing that you can get liquidated in a flash. All money can be gone. But, if my timing is right, you can end up with a position so strong that regardless of what happens after the breakout, sell early or late, you will be happy with the results.
It is always tricky, but we continue to learn and improve. Here we can see what is possible. Knowing what is possible, planning, preparing and taking action in the right way, we can achieve our goals and quit our day-job.
Trading is no different to any other profession/work, it takes time, practice, patience and dedication. The only difference is that here when you get it right you are rewarded for the long haul. Once you learn how to trade, that is, learn to play the market at its own rhythm, you can collect as much money as you want. It is true, but it takes years of hard work.
Here we have Dogecoin again. Will it grow? Will it crash?
Time will tell, but my money is on prices going up.
My money, my rep, my trust.
Let's see... Let's wait and see.
Not all trades are meant to be won.
If you follow capital allocation and a good strategy, you are able to take in the losses that are inevitable and still win big at the end of the game.
Remember, it is not about winning the all; it is about winning big, it is about winning over and over; it is about creating the habit of winning and this habit will make all the time and effort we invest in this venture worth it. It is not about being right, it is about getting paid.
With the right mindset and a little bit of patience... We can do this!
Namaste.
