How to use "Auto Trendline and Breakout Alert" IndicatorIn this tutorial, we will learn how to use the "Auto Trendline & Breakout Alert (Linear / Log)" indicator.
Note: You can find it in the scripts section of my profile
Auto Trendline & Breakout Alert(Linear / Log) Full-Version by BobRivera990
Overall Introduction
This indicator is the best tool for breakout traders.
Drawing and evaluating the trend lines of multiple charts in different time frames is a very time-consuming and tedious task. In addition, being aware of breakouts in the shortest possible time requires constant monitoring.
With this tool, you can draw and classify trend lines in a fraction of a second and by placing an alert on any chart, you can receive notifications about breakouts, wherever you are.
The classification of trend lines is done based on the reaction of the price chart to the trend lines and the analysis of the trading volume .
This indicator is designed to reclassify trend lines with each reaction of the price chart. These lines are classified into 6 levels and these levels are distinguished by different colors. Thus, any touching or crossing of the price chart can make a difference.
Features
This indicator is designed for use on both linear and logarithmic scales. It works linearly by default. If you are using a logarithmic chart, enter the settings menu and set the chart scale parameter to “Log”.
The indicator is equipped with the volume status tool to identify and avoid false breakouts. Note that you can't completely avoid false breakouts, but you can minimize risk and loss. I have already published volume status as a separate script.
Several filters are provided to customize alerts. You can limit alerts based on the level and strength of broken trend lines , volume status, and type of breakout (Cross-Over, Cross-Under, or both).
The last breakouts panel gives an overview of the current market situation. You can activate it in the settings menu. the figure below shows the panel:
How to setup
There are many parameters in the settings menu, but two are more important. One is “Chart Scale” and the other is the “Max Operational Range Length".
Set the “chart scale” parameter according to the chart, otherwise the trend lines drawn by the indicator do not match the price chart.
If you are using a linear chart, select the "Linear" option or if you are using a logarithmic chart, select the "Log" option.
Max Operational Range Length Limits the range of the price chart that is processed by the indicator.
By increasing this parameter:
The strength and durability of the trend lines increases.
The number of breakout signals decreases.
The importance of breakout signals increases.
The indicator processing load increases.
The best range for "Max Operational Range" is from 300 to 1200,Change it until you get the best view possible.
Also by changing the "Filter" parameter from 1X to 5X, you can reduce the clutter in the chart.
The following figure shows the results of correct and incorrect settings:
Use it well...
LOGARITHMIC

Bitcoin's Descending Triangle Target: $24K (Mind The Gap)Bitcoin's imperfect descending triangle currently targeting a measured move to $24K volume support zone. The $20K level of VPVR strong support also lines up with the logarithmic growth support trend-line. Short term looks bearish, long-term looks like a buy the dip opportunity before 6 figures.
Never underestimate the accuracy of Bitcoin's descending triangle measured move targets, if the breakdown is confirmed:
For alternative broadening wedge theory and bullish buy the dip scenario, see here:

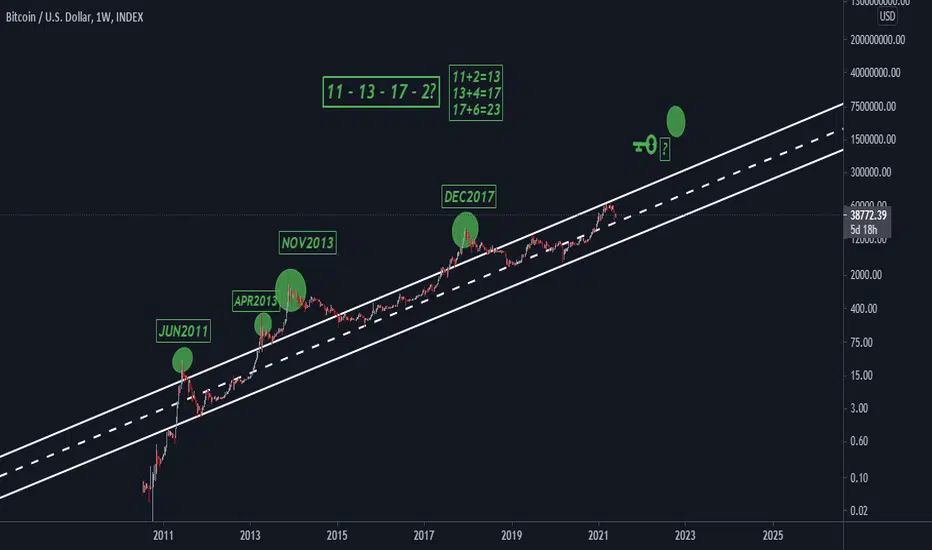
BTCUSD: Over-extended beyond mid-level of logarithmic curveAfter passing the mid-level by February 2021 of the current cycle, with an anticipated top around December 2021, are we over-extended in the current bull market cycle? Notably each cycle from lower band of the logarithmic curve to the upper band has increased in velocity in each movement. I still believe in $100K+ by the end of 2021, but $50K already?
Logirthmic Curve & Network Growth : $100K in 2021?

ETH log(1w) Bouncing off of trend lines/MA testI have been following these trend lines on the ETH chart (LOG ONLY) and they seem to be following very well, similarly to how BTC is to the wyckoff accumulation. I drew two arrows, for two different scenarios I believe are equally as likely. I do not believe we are headed to break-down of the channel, let alone test the Moving Average (orange line) in the near future. Ether is used by enterprises and institutions are adopting it like no other. Smart contracts and Blockchain dApps are the future and will be ran on ETH2.0, FLR network, and maybe some others. NFA.

Bitcoin - logarithmic - divergence - monthlyEverybody tell me. You have to use logchart to see the real worth of Bitcoin.
There is so much air up to 1 million…
Ok, I try logchart

BTC HTF Log View + Fib Time for Jan 4th 2022Appear to have found a potentially epic Fib time, starting from the very beginning of BTCs recorded upward thrust. Thought some might be interested, so am deciding to publish this chart. Note it catches the last cycle high almost perfectly, as well as the most recent high at the 4.618. Fib time 5 shows up on Jan 4th 2022. This is closely aligned with many analysts prediction of near the end of this Bull cycle.
There is a simple fan drawn of the tops. The top of the last 2 major bull cycles trend line is in the middle, and intersects with Fib time 5 showing in the area of $344K. Which is also closely aligned with many predictions of BTC hitting in the 6 digit range this cycle.
Note the Fib retracement is from the absolute bottom to the absolute top of BTCs recorded history. This current retracement is hitting very strong resistance right now. The Fib retracement "Golden Pocket" of the entire chart is roughly between $24.7K and $22K, with the last cycle high being just under $20K hanging out below.
I'm not sure BTC can rally $300K+ in 6 months, but... what do you think?
If nothing else, looks to be an interesting next couple of months.

Don't Panic! Zoom out and the BTC log chart looks great!This is an all-time log chart for Bitcoin, showing the percentage it has changed over time. Of course in trading and investment, percentage change is the only metric that matters: You invest an amount into an asset, and hope for a certain percentage return. The actual asset price doesn't matter a hoot.
As you can see, the recent "massive" dump actually looks rather insignificant as a percentage, when compared to BTC's history. Just a bit of a blip. And the long-term outlook still appears to be nice and bullish.
You can also see the trend curve shows that Bitcoin is getting less volatile over time (mainly due to increase in market cap), which is a good thing for the whole crypto market.

SIDEWAYS now (upsetting) - LONG in 2022 to $500k! For real.Ugh.
So, I'm biased bullish on BTC. Short and Long-Term. So charting this out has been a bit upsetting.
Apologies for the spider web, but I've tried to include major trendlines on this chart that I saw as pertinent as well as highlight clearly the latest RSI trend and support and resistance there. And then I was curious and threw in some Fibonacci Time Zones ... they lined up crazily, so they stayed too.
I've captured most my notes in the chart, but last comment: I've found that the price seems magnetically drawn to points where multiple macro trendlines converge. So that thought seems to bolster further the fib time zones callouts of the potential bottom and top coming in our futures.
Again. I hated what this analysis resulted in. My bias is strong. However, the chart is the chart. We'll see how well it holds. Thanks.

What do you call and exponential increase on a logarithmic scaleSeriously, what do you call it?
Normally, exponential increases (x^2) on a standard scale have a constant linear (x) slope on a logarithmic scale.
This chart shows an exponential growth in price ... on a logarithmic scaled price axis.

BTC Log Fractal - With Macro channelBTC Log Fractal - Nobody expects us to make a run the same size as last time, law of diminishing returns etc. Posting this for the kicks to see at what point is decouples from the fractal and under performs. Also as a rough guideline so I don't get lost in the bull run. Added channel too.

Bitcoin and log 618 + 382 retracements 618 log drawn from previous all time high (PATH) to peak often catches a very good bounce area to the linear 0.5/8618 area which for bitcoin would be the 47-50k area currently. Whether or not this then leads to the log 382 retracement at 20k after is debatable. Looking at this chart a break of 70k in the next 6 months would be very bullish IMO. Prob look for 250k lol

BTC Log Cycles - Based on HalvingsExperimenting with Bitcoin high time frame log charts, I began to notice some patterns.
Please note: This is a work in progress and by no means financial advice.
Highlighted in yellow are two box areas, the rest is built around them. The similarity appears striking, imo. Does this mean the chart will continue to produce and follow these patterns?
Log charts are generally meant for and used with curved lines. However, when one finds a straight forward geometric pattern between the last 2 major cycles and this one, based on halvings... couldn't help but continue to explore, and hope this is interesting for you too.
I will continue to monitor and update, if this chart and pattern continues to make sense as it unfolds, and will attempt to simplify so it is easier to read. But wanted to post this before going to sleep, and again, this is only a work in progress. Any feedback, questions or suggestions are welcome. Best.

BTC Triangle in LogLooking at the current BTC downward market structure in log, here are some observations.
Purple fan lines extend from last year March low. The white channel fits perfectly between the two most outreached tops, and 4 bottom major wicks down since April. Most recent local wick down landed on the bottom of the triangle (log) and local structure .618. Major trend lines were bisected forming several potential triangle phases. Local fib time seems to hit on or near major moves, 8 looks to line up with the next potential triangle phase end.
When will it break, and which direction?
Imo, it will have to go down below $29K, before it continues back into a bull market structure. If it breaks upward, this may be a fakeout, acting as a UT or UTAD. Watch for another crash down, acting as a redistribution phase.
Some levels to look for on a break up, before another major turn down redistribution scenario:
CME gap needs closing around 49100.
Any of the major top yellow triangle phases trendlines as resistance.
$50K (psychological)
If it breaks downward below $29K first, this would look like an overall bullish move imo, taking out some lower levels, before springing upwards acting as an accumulation phase.

Logarithmic chart of Bitcoin, Time interval monthly.Hello everyone, I sketched an approximate price movement on a logarithmic chart.

Is the logarithmic scale of the Tradingview really logarithmic?I've been looking for the correct equation for a straight line on Semi-logarithmic scale for some time. The base equation is as follows:
log y = mx + log k
m = slope of line = (log y1 - log y0) / (x1 - x0)
k = y-intercept: value of y where line crosses the x = 0 axis
While this equation is absolutely correct, the result of plotting it on logarithmic scale was a curve.
Then I realized that apparently in the price < 0.001 range, the logarithmic chart of Tradingview is not working logarithmically!
I am so confused.
Does anyone know the cause?
What is the equation corresponding to the chart scale?
Please help if you can.

Bitcoin top only in 2023? or has Bitcoin top at $65k?I think the bull run isn't over, however there is a small probability that the $65K was the top and we are all on the denial phase now.
Remember market act as its own and in most cases acts the opposite of the herd,
- Most is expecting the bull market not to be over
- Most was expecting a blow off top
If $65k was not the top here is my outlook for bitcoin moving forward.
This bull run is fueled buy Institution and we know they move slower then retail investor so that's one reason why the top will take longer then the previous cycles maybe in 2023.


ATOMUSDT(Update)With in Log scale Measured Move we have 2 different perspective which bulls and bears are in balance level so with shadow has hunted in Weekly TF chances for bull could be more better but if bears try to take control we might have correction in demand zone or resistance area it leads to Rally base drop Or Rally base Rally .
Note : Please DO NOT LIKE ideas , Give different idea which is opposite side to understand better in market .

BTC waiting for the most important monthly candle of the year?One week of patience. If the monthly candle closes with dragonfly doji - type candle with body close above dotted line (NFA!) selling flat and buying block of flats in 5 months. If below, diamond hands will be tested.


BTC down, but not out!A rather drastic drop just occurred for BTC with potential (probable) drops to continue (after possible short-term retracement). The long-term linear trend just took a rather harsh hit as the price dipped below the support around 58K and subsequently plummeted to around 51.5K USD. However, this doesn't look like the bull market is done just yet.
Whenever I see a dip without a flash crash from the beginning uptrend, I tend to look to the logarithmic chart for what trends to observe (NOTE: the current crash was to the 61.8% Fibonacci for the dip since 43K and around 23.6% Fibonacci of the dip since 29K). Additionally, the current logarithmic trend looks to have started fairly earlier and more conclusively than the linear trend, so I feel it can be better trusted for longer-term trend expectations.
From the daily logarithmic chart, the uptrend definitely looks to be continuing (as indicated by the yellow trend line which I drew quite some time ago which some may have seen sneak into some of my previous charts), but one can definitely see there is a bit more possible dip to occur (to near around 47K, which is around the 38.2% Fibonacci level since the 29K dip). I anticipate this level is likely to occur with the current downtrend, but not necessarily after some retracement occurs (and potentially propelling a few alts back upward slightly in the short term).
Hence I am currently keeping an eye on the long-term daily upward support to see if it continues to hold. If it does, a retracement like that which is currently occurring definitely has the potential to be a healthy retreat before a longer uptrend within the next year. However, if support falters, it can definitely lead to a year(s) long reversal. Either way, the aforementioned levels seem to be some key points for which to watch out in the short-term to determine the rest of the long-term trend.
Please like if you agree or leave a comment if you see some different trends/concerns that I am missing as I would love to hear your thoughts!

Weekly ONT on a logarithmic scale, with a lot of potentialTechnical analysis regarding the price of ONTOLOGY in relation of dollar Tether for the next scenarios, based on weekly movement.
On a logarithmic scale, the asset reduces the representation to a scale that is easier to view and analyze. The distance between one point and another is% of the total. That is, the distance between 1 and 2 is 100%, which will be the same distance between 10 and 20, between 100 and 200 and so on.
disclaimer
*** In accordance with CVM Instruction No. 598, of May 3, 2018, Art. 21, I declare that the recommendations of this analysis reflect solely and exclusively my personal opinions and perceptions and that they were prepared independently and autonomously. Not being considered a purchase and/or sale recommendation. ***
Any questions do not hesitate to contact me. I'm happy to be able to help you in the best way I can. 🙏
