Surprise! How to use fib correctly. Log fib!In a previous idea I said if it got 50 likes I would post a surprise.
I think they don't want you to know...
Some people might already know this but I know for a fact the vast majority does not.
I hope this does not stop working now that I share it. I have plenty of other strats and if markets evolve and 1 strat stops working I know I'll be the first to evolve so I do not even mind.
Now how to draw the log fib? You simply use "Fib channel" and voila. I think it is supposed to be a fib that gets drawn diagonally, but unlike the regular fib it scales with log. So it can be diverted from its main purpose and used this way.
Some examples:
It looks like the stock market retraces have been more shallow since investors have been telling people to buy & hold.
Didn't stop billionaires from being made.
On something that went up 10 years, +600%, like gold I am not sure which one is best.
On really big moves it has to be the log one obviously. You can only see the top 10% on the linear chart and most of it is too smal because of the exponential rise.
Amazon is a good example.
I am not saying this works 100% of the time & don't go all in.
There are not a whole lot of really large moves so not a huge sample size to work with.
Since crypto has no intrisic value and most importantly is highly manipulated I expect this to keep working perfectly until the crypto cow is entirely milked and there is nothing left in.
Crypto is still at a 150 billion market cap, at under 25 billion they might think it's not worth their time anymore.
Since miners might bail out (I heard they were doing it little by little) and wash trading / ponzi exchanges are going to exit scam, it could only work once more and then suddenly end.
Crypto was nice and all when it was only made up of noobs, but in 2017 the sophisticated crowd joined and they are interested in cold hard cash, not imaginary money they won't ever be able to cash out of and transform into real concrete money (since it has negative sum rate & no value).
I wish I knew about it earlier and had money to spare. But we almost all have to deal with getting so close to making huge returns and just miss it by a hair.
Those that accepted it have been able to move forward, and we can grow (as fast as our mightly lords the regulators that control our lives will allow).
Those that are still in denial and cannot accept they missed their chance to buy early / cash out at the top, are stuck and will get milked to the last drop (until crypto is small enough the whales ignore it & they'll keep coming any time it grows).
As a conclusion; when you look at really big timeframes / or moves of maybe 1000% in a short time, use the log fib ==> This is how you do it on tradingview.
Until next bubble ;)
Logscale

This pattern is looking familiar...Looking back at my all time BTC chart we see a clear channel support established where BTC has historically seen a reversal. For several weeks we have been riding right up that line. While we might expect to continue predominantly sideways movement for a several more weeks, a potential bottom appear to be establishing and as long as support continues to hold we can expect a breakout eventually, but more importantly an end to the year+ bloodbath. This is how it played out in 2015 and I will be watching for some of the same this year.

ARK/BTC - ready to pumpARK/BTC is looking like a great buy opportunity from this range.
Target: 0.0001920
Blue triangle indicates the current range.
Green box is buy.
Red box is sell.
Blue line indicates major resistance.
This is a log chart.

Bitcoin Long Term Projection on the Log Scale TrendlineThis is the most likely long term BTC scenario that I see on the Log Scale.
The Yellow Trendline (all the way back from the 2015 bear market) will most likely need to be retested prior to the next Bull Run.
Until then, we move mostly sideways for almost a year.
Not financial advice: Trade less, accumulate more, HODL at peace.

DON`T BUY: WARNING. Logarithmic scale. BTC DROP TO 220$Logarithmic scale. BTC DROP TO 220$
In this graphic it is possible to see the 3 ascending triangles more and more closed.
You are disconnected first descending triangle, my predictions is that more 2 will come on the way.
You can also see that at $ 4200 there is a fib. I sincerely think that btc will no longer pass in the near future.

Breakthrough Towards Long-Term Log Resistance Trendline? (130B)We broke through the down trendline within the channel, which could mean we will be visiting the resistance at ~130B, that's an important one as it's the upper limit of the channel of the long term log downtrend we find outselves into
Zoom out to the Daily for more context
I'm no pro, just an amateur observing... I hope you find this useful. I've been in crypto since 2011 but I'm not a technical analyst.

Long Term Log Scale Trendline Being Tested on the Total Crypto. We're touching a long term up trendline on the log scale - a bounce here could signify we have found a bottom.


What it Would take to Defeat the Big Grizzly BearThe total crypto market cap would have to cross the 120+ billion level. That number lowers with time, as the log down trendline advances into lower numbers (so, for instance, if it were to happen now, it would have to be 130 billion; if it happened in April, 120 billion would suffice to break that line): this is why time is so important. Time is as important as price. We often underestimate the importance of time.
A bunch of things are happening (Lightning Network ecosystem booming, Bakkt coming in 2019, etc.) - it's impossible to predict when that will happen. Remember also we don't need 10 billion fresh fiat into crypto to go above that, that's now how market cap works. It's not about fiat pouring into BTC/crypto, rather, it's about the PERCEPTION of value. (For instance, if by tomorrow nobody wanted to sell their crypto anymore, the supply would be reduced and the price would rise instantly without having new fiat pour into crypto).
Let's see how this develops. Have fun.

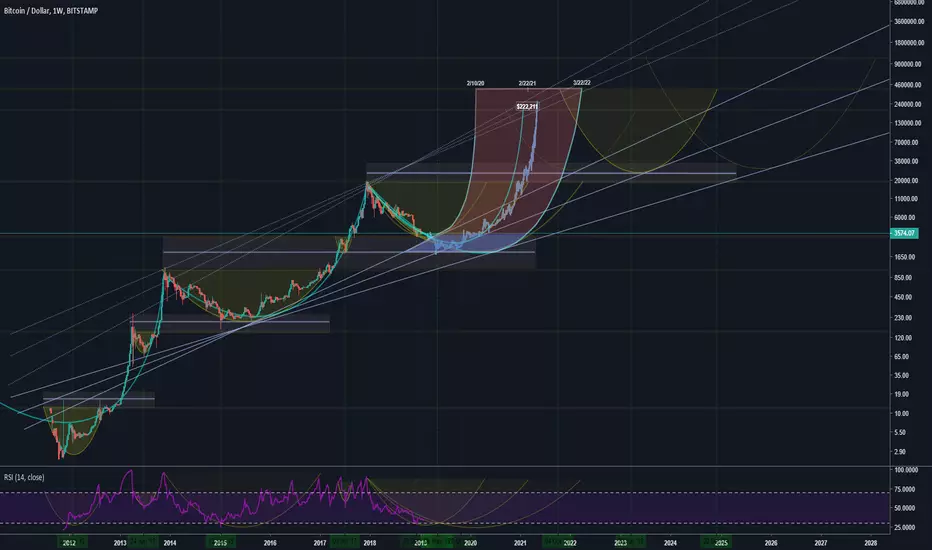
BTC to $222,211 by 2/22/21I made a probability distribution of COINBASE:BTCUSD over the next few years.
The "ghost" price action is the most likely scenario, and the red area are the other possibilities.
The Blue area seems to be a great accumulation zone.

Logarithmic fractal view with monthly Ichi This is a view of the logarithmic price time view of btc with the fractal from previous ATH bull run.

$BTC LOG SCALE ON COINBASE FAT BEARIf you look at the daily Coinbase chart and switch it to a log scale chart. Then you will see that the uptrend is stronger than you thought but you will also see that we have been in a Bear market since price closed below the 200 EMA back in January of this year. I have been told that many long term institutional investors use Log Scale charts -vs- standard Linear Scale charts when they are making TA decisions. Either way I feel that it is in my best interest to try and swim in the direction of the current. With that being said institutional money has been short since last December when the $BTC Futures contracts launched. Who do you think ran the price way up to $20K just so they could short it at the tipsy top? Every week since they have been short, balance heavy in the futures market so until we see them swing their positions to the long side then I feel that we are looking at more downward pressure. Not only do we have problems with several adult man children fighting over their toys ($BCH Drama) but their is no one with a vested interest to defend $BTC at this level. What I mean by this is, when the CME and the CBOT decided to launch $BTC futures contracts then on that day they started buying physical $BTC and how many years did it take them to stand up their products? How many years ago was that? The institutions are into $BTC much lower than many would think so don't be surprised to see $BTC slide to $1,500 or lower. Just my 2 nickles. DCA + HODL = Success. Viva La Crypto!!!

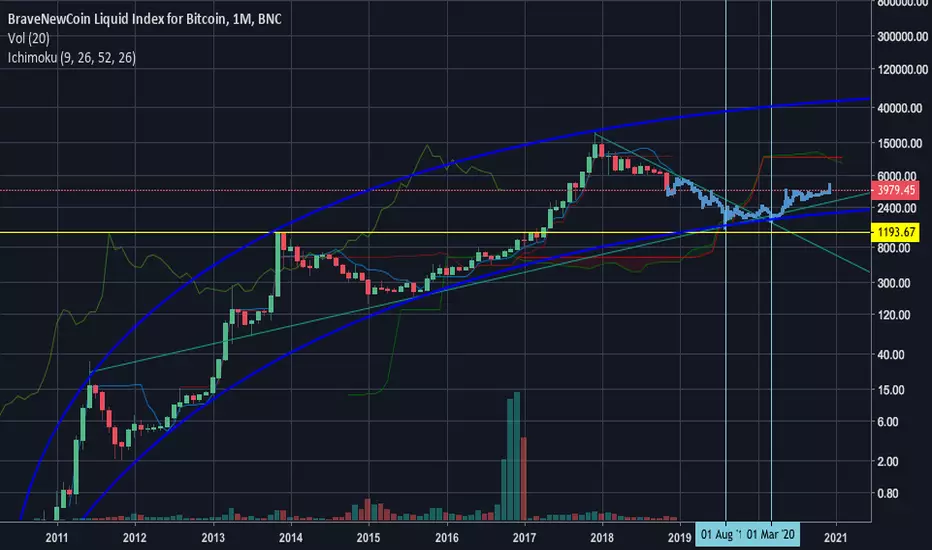
MIGHT JOHN MCAFEE BE RIGHT? The log scale proves it !The one scale pro's use for longterm predictions is still the log scale. It might sound crazy, but it could predict what is coming.
Truth is:
Bitcoin has traded in a logarithmic channel since the beginning, and it would near/touch the bottom of the largest, blue channel for a 3th time.
This is a big probability as it is seasonally around the same period of the year atm, which is 'October'.
In october 2011 we had a start of a bullmarket, a stop around the end of the year of 2013 = 2 years.
In october 2013 we had a midterm break and continuation of a bullrun again until end of 2013 as said previously.
In october 2015 we had a bottom and BTC marked a trendline very clearly and was in a bullmarket till end of 2017 = 2 years
Now we're october 2018, and there's a potential to break up and go to insane levels, if we get rejected from the bottom of the blue parallel again.
Levels of 50,000 and even levels of 1000,000 usd are in this case really possible, and John Mcafee might have a point.
If it would hit 1M, BTC will definitely be saturated as we would be entering a trillion dollar market, but... that would be just a glimpse of the total stock market ... so who knows?
On the regular scale it looks much out of proportion, but on the log scale it makes sense.
On the other hand, there could be a hold up for about a year, if bitcoin breaks down from the blue parallel (which never happened)
and swap to the pink parallel to go to levels of about 4000 usd, but I believe certainly not more than that, eventually it should go up around October 2019 then !
Let's hope we don't have to wait a year longer, but in this case the highest probability is that bitcoin will go up right around this time... or at least end of this year,
which it then would follow the green parallel.
All this means that a rise to 50 K is certainly possible !
We could have a bullrun until end of this year, or until mid next year, as 4 years ago, BTC went into a mid-phase until april 2013.
So, even if I personally cannot believe this myself, it is a very high probability !
So far the TA explained what John Mcafee, and... some hedge fund managers projected as well.
The run from OCT. 2011 until NOV. 2013 went from 2 usd to 1100 usd in 2 years ! That's 550 X,
with a break from APRIL 2013 til OCTOBER 2013 !
On the regular scale it would look like this in my older projection:
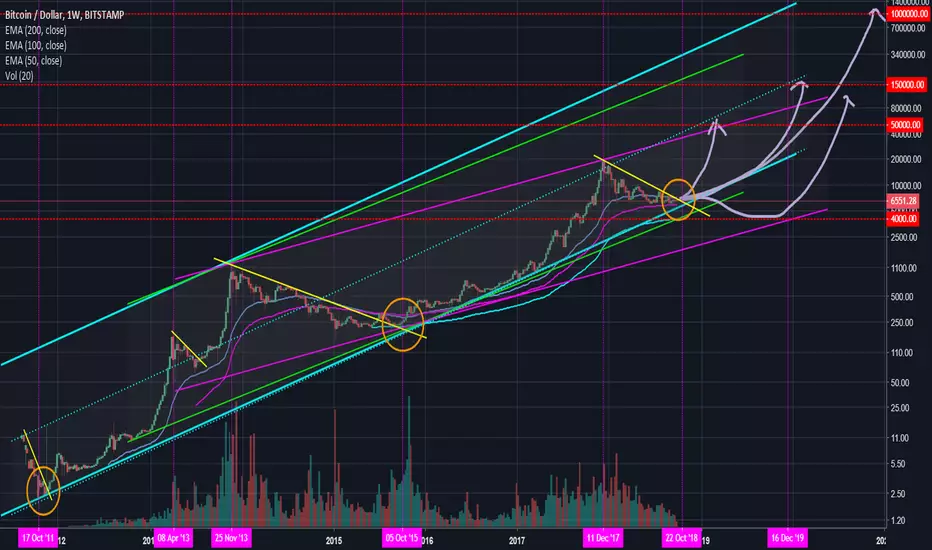
Bitcoin gets massive support from converging trendlinesLets zoom out on a weekly chart and plot some obvious trend lines on the log scale. We can clearly see that there are 3 major trendlines converging that should stop the rot and provide a base to move upward from. If we use the 2014/2015 movement I have predicted what could follow in the coming months . . . .

August 2015 - November 2018 Bull Run - Is this the end?A trendline from the August 2015 low on the log chart has just been touch for the first time since January 2017. A breach of the trendline will see the August 2015 VWAP as the next target. Lets see how it plays out.

Still bullish on $btc, but stay away from the red box!Using log chart this doesn't look so bearish yet, but we need to bounce at the trendline... if we go that low!

My Crazy Idea About The Dow JonesThis is mostly for fun, but also an illustration of a worst case scenario. Saw this crazy fractal and thought....what if? I love the fact that this chart has so much price history.
In all seriousness though, if the DJI fails to consolidate in this range and make a higher high soon, we can assume it will drop. We have a nice double top formation so far. Buying here is risky, but could have a high reward if you can time the next top (if there is one), because after that, it could get very ugly.
If we drop hard now, we have immediate support in the 15000 area, and then around 10000. Based on this log graph, we have A LOT of room to fall in the event of a crisis. If those supports mentioned above and outlined on my chart fail to hold, we could fall straight down to the support created by the 2008 recession (my yellow line). That happens to coincide nicely with the long term uptrend line that dates all the way back to the Great Depression. If we fall below that, all bets are off.
If we move higher from here, I expect a final blow off top (this is also what happened right before the Great Depression). The Great Depression fractal (circled in red) looks very ominous. You may have to scroll to the left to see it.
This is not financial advice, nor am I a qualified financial advisor. This is just my perspective on how things COULD play out from here, and I'm mostly just curious to see how it plays out. I do not have any open positions here at this time.

Bitcoin Log Channel ForecastThis is not a chart to be traded off of, extrapolating trends from such early, low volume, price action has many issues. I consider these lines to be an interesting observation. More trustworthy technical analysis techniques are to be used for any tradeable analysis.


Simple weekly long term BTC log chartShort term (3-4 months) it's possible to experience lower prices as we test the bottom range. Long term, though, BTC 2.94% is still very bullish.
note: you may have to manipulate the scale a bit to get a better long term picture.

Eth USD entire history points to LOG support at $250 rock bottomWhole market got obliterated, and Eth looks like it will find support at 250 and reverse from here. Next time it reaches the top of it's hype cycle it will be several thousands of dollars.
