XAUUSD: Buyers Aiming for a Rebound Toward $4,170 ResistanceHello everyone, here is my breakdown of the current Gold setup.
Market Analysis
XAUUSD continues to trade within a corrective structure, forming a broad Triangle Pattern defined by the Triangle Resistance Line above and the Triangle Support Line below. After a strong impulsive rally earlier, gold entered a prolonged consolidation phase, highlighted by a clear Range Zone where price repeatedly tested both the upper and lower boundaries without establishing a directional breakout. Several Breakouts occurred during this period, but each bullish attempt failed to secure continuation, leading to pullbacks that kept the market inside the broader consolidation. This showed clear indecision and a balanced battle between buyers and sellers.
Currently, gold retested the Support Zone around $4,040–$4,060, which coincides with the Triangle Support Line. A fake breakdown occurred below this level, but the market quickly bounced back, confirming strong demand and rejecting the bearish attempt. This rebound signals that buyers are actively defending the structure. Price is now stabilizing above support and showing early signs of bullish pressure. If buyers maintain control, the next logical target becomes the major Resistance Level at $4,170, which has acted as a key cap on previous bullish attempts. As long as XAUUSD stays above the Support Zone and trades within the rising trendline structure, the overall market bias remains moderately bullish.
Scenario & Strategy
I expect gold to gradually move upward from the current support area and retest the $4,170 Resistance Level. Minor corrections may occur along the way, but as long as price holds above $4,040, the bullish scenario remains valid. A clean breakout above $4,170 could trigger a stronger bullish continuation toward the next supply zone.
However, a breakdown below the Support Zone and Triangle Support Line would invalidate the bullish scenario and open the way for deeper correction. For now, buying the dips remains the more favorable approach as long as gold respects demand and stays within the triangle structure.
That's the setup I'm tracking. Thank you for your attention, and always manage your risk.
Long!!!!

EURUSD Is Bullish! Buy!
Please, check our technical outlook for EURUSD.
Time Frame: 2h
Current Trend: Bullish
Sentiment: Oversold (based on 7-period RSI)
Forecast: Bullish
The market is trading around a solid horizontal structure 1.152.
The above observations make me that the market will inevitably achieve 1.155 level.
P.S
The term oversold refers to a condition where an asset has traded lower in price and has the potential for a price bounce.
Overbought refers to market scenarios where the instrument is traded considerably higher than its fair value. Overvaluation is caused by market sentiments when there is positive news.
Like and subscribe and comment my ideas if you enjoy them!

TLT - A long-term outlookIf price is moving up, we look for support structure, which in this case is a Real Swing Low (RSL).
An RSL is confirmed when the most recent Real Swing High (RSH) is broken.
What we’re seeing here is the beginning of a stair-step move to the upside, including short-term support.
Even the CIB has been broken, which suggests that a shift in market behavior is underway.
Our statistical probability of hitting the centerline is roughly 80%. That implies we can look for a longer-term play in TLT.
However, keep a close eye on the 1/4 line. It isn’t exactly friendly, as the rejections we’ve seen so far make clear.
I probably go with ITM LEAP options with a
Delta of around 70–80 and a over 120 DTE.
Happy profits, and for those in the U.S., wishing you a happy Thanksgiving.

EURUSD Buyers Defend Support — Targets 1.1600 Resistance RetestHello traders! Let’s break down the current EURUSD structure. EURUSD is trading within a broad ascending structure, finding strong support at the Buyer Zone (1.1500–1.1510), which aligns with both the Support Level and the lower boundary of the rising channel. This area has acted as a key reaction point multiple times, confirming the presence of strong buyers and forming the base for several upward impulses. Earlier, the pair broke out of the descending triangle structure, retesting the former Seller Zone before continuing lower. After reaching the channel support, EURUSD formed a local bottom and started to grow, respecting the trendline and creating higher lows. A fake breakout occurred near the mid-channel resistance, where buyers quickly returned, signaling continued demand. Currently, EURUSD is approaching the Resistance Level at 1.1600, which also serves as the first major take-profit area (TP1). This zone has previously caused corrective moves and remains the main barrier for buyers. If the pair maintains momentum and stays above the Buyer Zone, I expect a bullish push toward TP1 → 1.1600, where sellers may again attempt to hold resistance. A confirmed breakout above 1.1600 would unlock a path toward higher levels within the ascending structure. However, if EURUSD breaks below 1.1500 and fails to hold the Buyer Zone, the bullish scenario becomes invalid. In that case, the price may revisit deeper support levels and potentially exit the rising channel. For now, the structure remains moderately bullish, with buyers dominating as long as the pair trades above demand and respects the ascending support line. Please share this idea with your friends and click "Boost" 🚀

Market Hunter’s AUDUSD Roadmap: Patiently Awaited Buy LevelsMy friends, greetings
I have prepared an AUDUSD analysis for you.📊
If AUDUSD falls to the 0.64528 – 0.64363 levels, I will open a BUY position there.
Once AUDUSD reaches my BUY entry point, I will share the targets with you here.⚡
You will be informed when I update this analysis.🔔
My friends, I share these analyses thanks to every single like I receive from you.
Your likes increase my motivation and make me want to support you in this way.🙏
I sincerely thank all my friends who support me with their likes.❤️

XAU/USD – Entry Analysis (H4)📈 XAU/USD – Entry Analysis (H4)
Our previous analysis didn’t quite reach the entry point, but the market structure is still developing nicely, and now we have a clean, rule-based long setup on the H4 timeframe.
After the CHoCH, price broke to the upside and is now expected to pull back into the FVG + Order Block zone. These two POIs align perfectly, increasing the probability that the market will collect liquidity here before continuing higher.
🎯 Entry Setup
Buy limit: 4086
Stop loss: 4062
Take profit: 4160
RRR: excellent, close to 1:3
🧠 Position Management
Once price reaches the 50% RR level (around 4123):
➡️ close 50% of the position
➡️ move the remaining stop loss to break even (4086)
This removes all risk from the trade while allowing the rest to run toward the main target at 4160.

GBPUSD Breakout and Potential RetraceHey Traders, in today's trading session we are monitoring GBPUSD for a buying opportunity around 1.30900 zone, GBPUSD was trading in a downtrend and successfully managed to break it out. Currently is in a correction phase in which it is approaching the retrace area at 1.30900 support and resistance area.
Trade safe, Joe.

Gold Breakout and Potential RetraceHey Traders, in today's trading session we are monitoring XAUUSD for a buying opportunity around 4,080 zone, Gold was trading in a downtrend and successfully managed to break it out. Currently is in a correction phase in which it is approaching the retrace area at 4,080 support and resistance area.
Trade safe, Joe.

EURUSD Long: Buyers Eye a Push Toward 1.15700 Supply ZoneHello traders! EURUSD continues to trade within a broader bearish market structure, remaining below the long-term Supply Line, which acts as dynamic resistance and keeps the pair under selling pressure. The chart shows several pivot points forming along both the supply trendline and the rising demand trendline, confirming the current wedge-like structure. Earlier, the pair created a Rounding Top Pattern near the upper boundary of the structure, which signaled weakening bullish momentum and triggered a sharp decline toward the Demand Line. After touching the demand trendline around 1.1500, EURUSD formed a strong bullish reaction at the pivot point, showing buyers stepping in to maintain support. However, the recent breakout and retest of minor structure levels still leave the pair below the key 1.15700 Supply Zone, where price has reacted multiple times in the past. This zone aligns with horizontal supply and the descending Supply Line — forming a high-confluence resistance area.
Currently, the pair is attempting to recover toward 1.15700, which is the nearest upside target. If price reaches this level, it may face strong selling pressure once again, as previous breakouts from this zone turned into bearish rejection candles. As long as EURUSD remains trapped between the Demand Line and Supply Line, the overall structure stays corrective and heavily dependent on reactions at these key zones.
My scenario as long as EURUSD holds above the Demand Zone at 1.1500–1.1510, buyers may attempt a short-term recovery toward 1.15700, which acts as the nearest structural resistance. A clean breakout above 1.15700 would confirm bullish strength and could open the way for a deeper correction toward the descending Supply Line. However, if the pair gets rejected at the Supply Zone again, sellers may regain control and push price back toward 1.1510–1.1500, where demand is expected to react. A confirmed break below 1.1500 would invalidate the bullish recovery potential and could signal continuation of the broader bearish trend. For now, EURUSD supports a short-term bullish retracement, but the larger trend remains bearish while price stays below the descending Supply Line. Manage your risk!

BTCUSD: Bulls Aim for Recovery Toward $92,000 Resistance ZoneHello everyone, here is my breakdown of the current Bitcoin setup.
Market Analysis
BTCUSD continues to move within a clearly defined Downward Channel, respecting both the descending resistance line and the lower support boundary. After a prolonged bearish continuation from the major Range structure seen earlier, Bitcoin broke several intermediate support levels before reaching the Support Zone around $84,000, where strong buyers stepped in. A Fake Breakout below the channel support triggered aggressive buying activity, sending the price back above the Support Zone and forming a short-term recovery structure. From this point, BTCUSD made a corrective bounce and even managed to break above a minor descending resistance, confirming a temporary shift in momentum.
Currently, price is approaching the Resistance Zone near $88,000–$90,000, which aligns with the upper boundary of the Downward Channel. This area has previously generated strong sell-offs and remains the key obstacle for buyers. A clean breakout above $90,000 would signal bullish continuation and may lead to a deeper recovery toward the next liquidity cluster near $92,000–$94,000. As long as BTCUSD holds above the $84,000 Support Zone, the short-term structure supports a bullish correction. However, if price gets rejected from the $90,000 resistance and fails to stay above support, sellers may regain control and push the market back toward the lower channel boundary.
My Scenario & Strategy
From my perspective, BTCUSD maintains a bullish corrective outlook while respecting the Support Zone around $84,000. The first target remains the $90,000 Resistance Zone, which matches both horizontal resistance and the channel’s upper boundary. A confirmed breakout above $90,000 would open the path toward $92,000–$94,000, where the next reaction levels are located. I will look for long opportunities during pullbacks toward the Support Zone or along the rising minor trendline that formed after the fake breakout.
If BTCUSD breaks back below $84,000, the bullish scenario becomes invalid, and a continuation of the major downward trend may follow. For now, price action supports a bullish recovery setup as long as buyers defend the Support Zone.
That's the setup I'm tracking. Thank you for your attention, and always manage your risk.

NZDJPY: Will Keep Growing! Here is Why:
The recent price action on the NZDJPY pair was keeping me on the fence, however, my bias is slowly but surely changing into the bullish one and I think we will see the price go up.
Disclosure: I am part of Trade Nation's Influencer program and receive a monthly fee for using their TradingView charts in my analysis.
❤️ Please, support our work with like & comment! ❤️

EURGBP Potential UpsidesHey Traders, in today's trading session we are monitoring EURGBP for a buying opportunity around 0.87800 zone, EURGBP is trading in an uptrend and currently is in a correction phase in which it is approaching the trend at 0.87800 support and resistance area.
Trade safe, Joe.

XAUUSD Ascending Channel Strengthens: Bulls Target $4,130 TP1Hello traders! I want to share my view on the current XAUUSD setup. After a deep corrective move, gold has formed a local bottom around the Support Level at $4,000–$4,030, where strong buying pressure has re-entered the market. As shown on the chart, price is gradually climbing within a well-defined ascending channel, supported by the rising trendline and a parallel upper boundary. Inside this structure, the Buyer Zone has played a crucial role, providing the base for previous impulsive breakouts. Several fake breakdowns below the channel support confirmed the presence of significant demand. After these rebounds, XAUUSD twice reached the Seller Zone and the Resistance Level near $4,130, where it faced clear rejection and rotated back toward the Buyer Zone. Currently, gold is holding above the ascending channel support. If buyers continue to defend the $4,030 level and price remains stable within the Buyer Zone, I expect a move toward TP1 → $4,130, which is the nearest resistance. A clean breakout above this level would open the door for further bullish continuation toward the upper supply area around $4,200–$4,230. However, if the price breaks below the Buyer Zone and drops out of the channel, the bullish scenario becomes invalid, and the market may revisit the $4,000 support area. For now, the structure remains moderately bullish as long as price holds above demand and stays inside the ascending channel. Please share this idea with your friends and click Boost 🚀

EURGBP On The Rise! BUY!
My dear friends,
My technical analysis for EURGBP is below:
The market is trading on 0.8785 pivot level.
Bias - Bullish
Technical Indicators: Both Super Trend & Pivot HL indicate a highly probable Bullish continuation.
Target - 0.8807
About Used Indicators:
A pivot point is a technical analysis indicator, or calculations, used to determine the overall trend of the market over different time frames.
Disclosure: I am part of Trade Nation's Influencer program and receive a monthly fee for using their TradingView charts in my analysis.
———————————
WISH YOU ALL LUCK

EUR/JPY BULLS ARE STRONG HERE|LONG
Hello, Friends!
It makes sense for us to go long on EUR/JPY right now from the support line below with the target of 180.945 because of the confluence of the two strong factors which are the general uptrend on the previous 1W candle and the oversold situation on the lower TF determined by it’s proximity to the lower BB band.
Disclosure: I am part of Trade Nation's Influencer program and receive a monthly fee for using their TradingView charts in my analysis.
✅LIKE AND COMMENT MY IDEAS✅

Bitcoin Market Truth: Whales, Corrections, and the BraveHello my friends,
I have carefully analyzed Bitcoin for you.
Markets never move straight up; they progress with corrections. Whales often take profit along the way. Think of it like running a supermarket: you buy apples at the cheapest price so that when customers purchase from you, you make a profit. Whales use the same logic. They trick people into thinking prices are falling, but in reality, their goal is to balance supply and demand. They feed on the losses of others.
For me, the most suitable buying zone is between 85,000 and 74,000 dollars. From this range I will enter the trade, with my first target at 107,000 and my second target at 120,000 dollars.
This business belongs to the fearless and the brave. If you act out of fear of losing money, this is not for you. Those who cannot manage risk should look for other paths.
My dear friends, every single like you give is my greatest motivation to continue sharing these analyses. Thank you to all who support me—you are the reason I keep going.
Each of my followers is like family to me, never forget that.
⚠️ And remember this: In trading, don’t trust everyone who calls themselves a “trader.” Most of the people you follow don’t earn a cent in their real accounts. This is not an easy business. Around 90% of people lose consistently, while only about 10% make money regularly. Many YouTubers or influencers you see online don’t actually profit with their real money. In fact, some of the celebrities you follow come to me asking for analysis. I won’t expose names, but these are the facts.
Respect and love

#042: Long Investment Opportunity on AUD/CAD
The Australian dollar/Canadian dollar pair is moving within a broad compression phase that has been developing for several sessions. Hello, I'm Forex Trader Andrea Russo, author of the book "The Institutional Code of Forex, 14 Steps to Read the Markets Like a Bank," available on Amazon. I'm an independent trader and money manager, and I thank you in advance for your time.
This structure has created a clear area of inefficiency just below the current market, while liquidity remains relatively flat and concentrated around the most recent lows.
From a technical perspective, the pair is reacting after a prolonged period of downside pressure, forming a sequence of higher rejection wicks near a key support region. This behavior suggests that short-side exhaustion is beginning to emerge. The market is no longer making momentum-driven lows and is instead moving toward a classic accumulation pattern, often observed before a corrective upside expansion.
Intermarket flows also support this interpretation. The Australian dollar is beginning to stabilize after a period of weakness triggered by commodity repricing and the reprioritization of macroeconomic priorities. Meanwhile, the Canadian dollar is showing signs of deceleration, partly influenced by the weaker tone of energy markets. The combination of a stabilizing AUD and a slower CAD creates a favorable environment for a bullish retracement on this cross.
Volatility conditions remain moderate, and the recovery in short-term momentum indicators is consistent with the idea that the pair may attempt a rotation toward the middle range of the broader structure. The pair is currently near the lower limit of this range, making the risk-reward profile more attractive for a controlled long position, especially for traders seeking to anticipate institutional accumulation rather than chasing breakout moves.
Price action offers an initial reversal signal, supported by a sharper rejection from discounted levels. If the market maintains this behavior and continues to respect the support zone it has repeatedly defended, a bullish continuation toward upper liquidity pockets becomes the most consistent scenario.
In summary, AUDCAD represents a strategic opportunity for bullish exposure within a controlled and well-defined structure. The pair is showing the first signs of accumulation, improving sentiment dynamics, and an intermarket environment favoring an upward correction. This configuration is consistent with an institutional approach that favors discounted entries, asymmetric risk, and positioning relative to the retail sentiment curve.

Bitcoin Price Approaches Key Support: Rebound Toward 98,700?BITSTAMP:BTCUSD is approaching a key support zone, an area where buyers have repeatedly stepped in before and triggered notable reversals. That price history alone makes this level worth watching very closely. Price is pressing into this zone again, and the current structure suggests bullish potential if we see clear signs of rejection, such as a strong bullish engulfing candle, long lower wicks that show absorption of selling, or a visible increase in buying volume.
If this support holds, I expect price to push up toward the 98,700 area, which fits well with a short-term rebound scenario. If, on the other hand, price breaks below this zone and starts to hold underneath it, the bullish idea is invalidated and the door opens for a deeper downside move.
In my view, the best approach here is to let the chart confirm the story at this level. Watch how candles close, how volume reacts, and only consider long setups if the market clearly defends this zone. Solid risk management is essential: position size, stop loss placement and invalidation levels all need to respect the potential volatility around such an important area.
This is simply my personal view on the current support and resistance structure, not financial advice. Always confirm your own setup and trade with disciplined risk management. Good luck out there.

24/11/25 Weekly OutlookLast weeks high: $96,057.33
Last weeks low: $93,034.53
Midpoint: $80,642.73
Has Bitcoin found its low, or is there more downside to come?
After yet another brutal week of downtrend BTC tags $80,000 before bouncing back towards the weekly range midpoint at $88,000, a +10% bounce. It's important to note that back in April during the Tariff War sell-off, the $80,000 area was the origin of the subsequent move up to $110,000. So historically this area should provide support when retested as it has initially.
What this does mean to me, the high time frame trend has shifted from bullish with areas of choppy rangebound consolidation before the next leg up, to now a new lower high ($108,000 rejection) which confirmed the 1d 200 EMA as resistance, and much lower low ($80,000 last weeks low) which confirms a bearish flip.
For me this week it's about finding out if the bottom is already in or if not, where will it be? In terms of bullish target should the bottom already be in, it's the $98,000-$100,000 area. This key s/r level has been an important battleground since December '24, it's a big even level too so psychologically important, and the origin of this 20% sell-off. Fear & Greed Index currently sits at 19 but hit as low as 11 over the weekend, the lowest so far this bull run. These factors have me leaning towards the local bottom is in.
However, if the bottom is not in then $74,000 comes into play, the Tariff war low. That would complete a full retrace of this years move up to $126,000 (-40% from high). The current weekly low sits at -36% move which is the largest of the bull run so far but not uncommon in previous cycles.
Good luck this week everybody!

CADJPY Will Go Up! Long!
Please, check our technical outlook for CADJPY.
Time Frame: 3h
Current Trend: Bullish
Sentiment: Oversold (based on 7-period RSI)
Forecast: Bullish
The market is trading around a solid horizontal structure 111.244.
The above observations make me that the market will inevitably achieve 112.283 level.
P.S
Overbought describes a period of time where there has been a significant and consistent upward move in price over a period of time without much pullback.
Like and subscribe and comment my ideas if you enjoy them!

GOLD What Next? BUY!
My dear subscribers,
This is my opinion on the GOLD next move:
The instrument tests an important psychological level 4066.7
Bias - Bullish
Technical Indicators: Supper Trend gives a precise Bullish signal, while Pivot Point HL predicts price changes and potential reversals in the market.
Target - 4082.3
My Stop Loss - 4057.6
About Used Indicators:
On the subsequent day, trading above the pivot point is thought to indicate ongoing bullish sentiment, while trading below the pivot point indicates bearish sentiment.
Disclosure: I am part of Trade Nation's Influencer program and receive a monthly fee for using their TradingView charts in my analysis.
———————————
WISH YOU ALL LUCK

USD/CHF BULLS ARE GAINING STRENGTH|LONG
Hello, Friends!
USD/CHF is trending up which is clear from the green colour of the previous weekly candle. However, the price has locally plunged into the oversold territory. Which can be told from its proximity to the BB lower band. Which presents a classical trend following opportunity for a long trade from the support line below towards the supply level of 0.806.
Disclosure: I am part of Trade Nation's Influencer program and receive a monthly fee for using their TradingView charts in my analysis.
✅LIKE AND COMMENT MY IDEAS✅

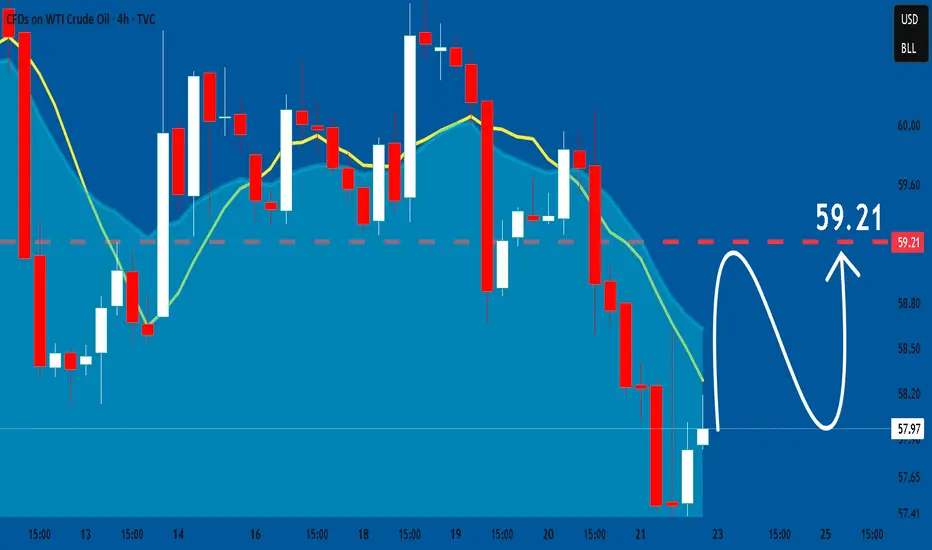
USOIL: Bullish Continuation
It is essential that we apply multitimeframe technical analysis and there is no better example of why that is the case than the current USOIL chart which, if analyzed properly, clearly points in the upward direction.
Disclosure: I am part of Trade Nation's Influencer program and receive a monthly fee for using their TradingView charts in my analysis.
❤️ Please, support our work with like & comment! ❤️