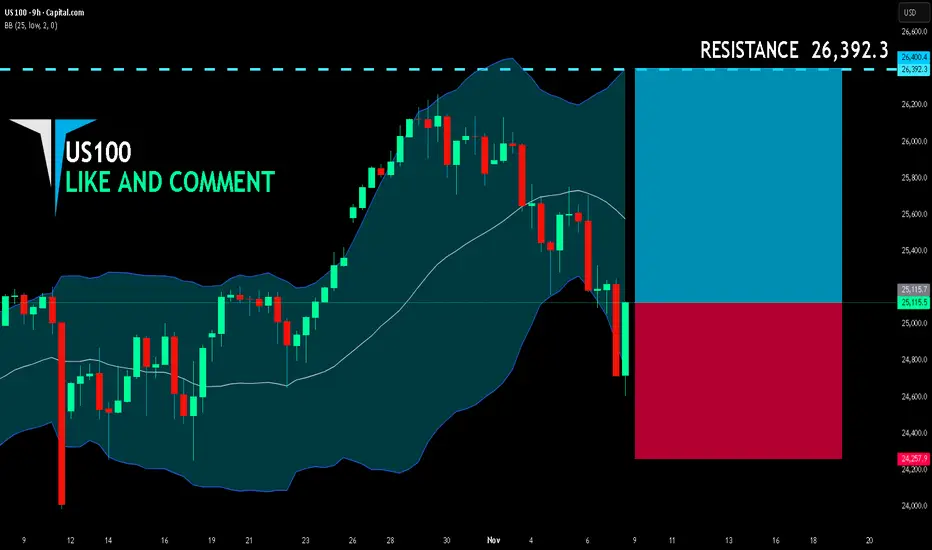
US100 LONG FROM SUPPORT
US100 SIGNAL
Trade Direction: long
Entry Level: 25,115.7
Target Level: 26,392.3
Stop Loss: 24,257.9
RISK PROFILE
Risk level: medium
Suggested risk: 1%
Timeframe: 9h
Disclosure: I am part of Trade Nation's Influencer program and receive a monthly fee for using their TradingView charts in my analysis.
✅LIKE AND COMMENT MY IDEAS✅
Long!!
GBPUSD Is Bullish! Long!
Please, check our technical outlook for GBPUSD.
Time Frame: 9h
Current Trend: Bullish
Sentiment: Oversold (based on 7-period RSI)
Forecast: Bullish
The market is trading around a solid horizontal structure 1.316.
The above observations make me that the market will inevitably achieve 1.329 level.
P.S
The term oversold refers to a condition where an asset has traded lower in price and has the potential for a price bounce.
Overbought refers to market scenarios where the instrument is traded considerably higher than its fair value. Overvaluation is caused by market sentiments when there is positive news.
Like and subscribe and comment my ideas if you enjoy them!

USDCAD Is Very Bullish! Buy!
Here is our detailed technical review for USDCAD.
Time Frame: 1h
Current Trend: Bullish
Sentiment: Oversold (based on 7-period RSI)
Forecast: Bullish
The market is testing a major horizontal structure 1.404.
Taking into consideration the structure & trend analysis, I believe that the market will reach 1.407 level soon.
P.S
We determine oversold/overbought condition with RSI indicator.
When it drops below 30 - the market is considered to be oversold.
When it bounces above 70 - the market is considered to be overbought.
Like and subscribe and comment my ideas if you enjoy them!

USDJPY Eyes 153.000 Support as Hawkish Fed Keeps Dollar Bid!Hey Traders,
In the coming week, we’re monitoring USDJPY for a buying opportunity around the 153.000 zone. The pair remains in a clear uptrend and is currently in a correction phase, approaching a key support and resistance area at 153.000.
Fundamentally, the Fed’s recent hawkish tone emphasizing stronger than expected labor data and pushing back against December rate cut bets continues to support USD strength, keeping upward pressure on the pair.
A sustained reaction at 153.000 could signal the next leg higher.
Trade safe,
Joe.

NZDCHF: Bulls Will Push
Remember that we can not, and should not impose our will on the market but rather listen to its whims and make profit by following it. And thus shall be done today on the NZDCHF pair which is likely to be pushed up by the bulls so we will buy!
Disclosure: I am part of Trade Nation's Influencer program and receive a monthly fee for using their TradingView charts in my analysis.
❤️ Please, support our work with like & comment! ❤️

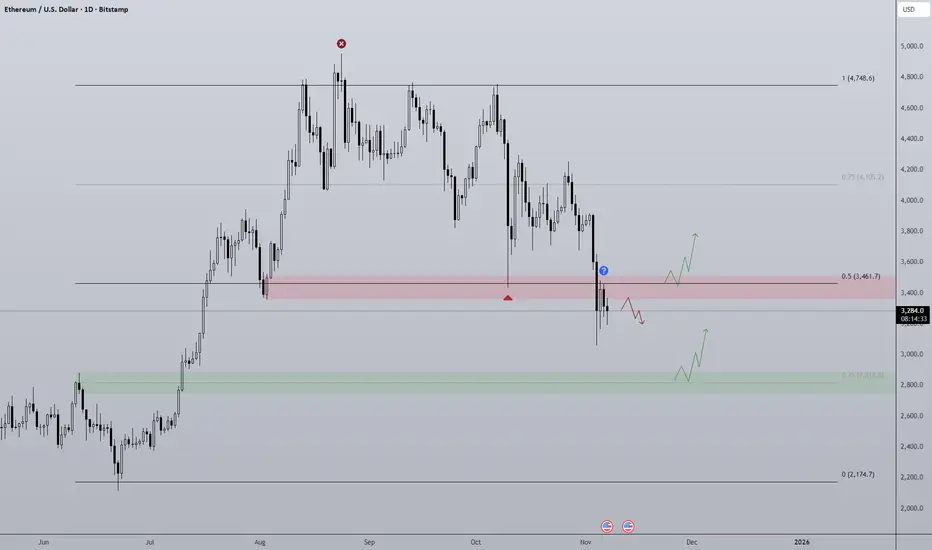
ETH Losing Range Midpoint? Similarly to Bitcoin, Ethereum finds itself around the midpoint of the high time frame range, only ETH has already lost the level and has rejected when retesting. Such a lack of strength is concerning for the project as well as the broader altcoin market.
So there are a few actionable moves I'm looking out for:
Bullish scenario is we maybe chop for a while around/under the midpoint then with high volume the midpoint gets flipped with conviction. That would open the door for the top half of the range to be accessible again. I think this scenario relies on the US Government shutdown coming to an end and QT also ending. Right now there just isn't the liquidity needed to prop up prices hence the slow bleed.
Bearish scenario is a simple continuation of the local bearish trend where 0.25 ($2,800) is the target. This area signaled the break in structure responsible for the previous rally and so I believe it will provide support but is also the target for the bears to reach.
USDCAD Technical Analysis! BUY!
My dear friends,
Please, find my technical outlook for USDCAD below:
The instrument tests an important psychological level 1.4071
Bias - Bullish
Technical Indicators: Supper Trend gives a precise Bullish signal, while Pivot Point HL predicts price changes and potential reversals in the market.
Target - 1.4090
Recommended Stop Loss - 1.4054
About Used Indicators:
Super-trend indicator is more useful in trending markets where there are clear uptrends and downtrends in price.
Disclosure: I am part of Trade Nation's Influencer program and receive a monthly fee for using their TradingView charts in my analysis.
———————————
WISH YOU ALL LUCK

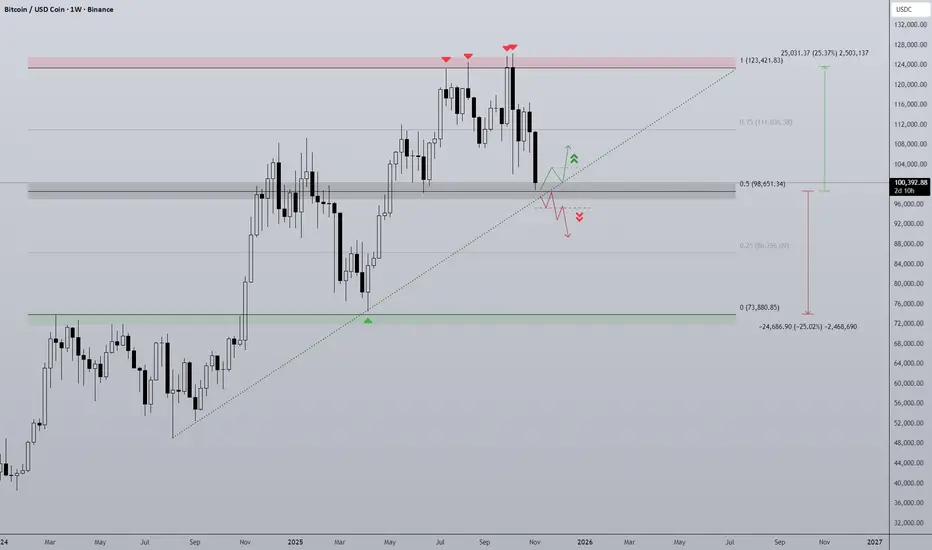
BTC Line In The Sand Bitcoin has had a turbulent Q4 so far and finds itself at ~$100,000 at the start of November.
The chart clearly defines the structure of the move since the beginning of 2024. Once breaking above last cycles ATH of ~$69,000 BTC's price has moved in relatively typical fashion for a bullrun uptrend. The tariff war marking the range low back in April and the highs have been capped at ~$125,000, on 4 separate weeks this area has rejected and remains major resistance.
As of now BTC is retesting the midpoint as support as it did back in June. Where this time is different is the momentum difference, since the first test of range highs the trend has gone into a choppy phase with lower lows being printed. This distribution pattern is vastly different and quite bearish. Another element to this is the diagonal support trendline that intersects the midpoint at roughly current price, losing this trendline would be added confluence that the bullish trend is over.
Should midpoint and diagonal support be lost the bottom half of the range comes into play, a 25% range that would open the door to a full retrace of this cycles progress back to 2021's ATH.
A strong bounce at midpoint keeps the uptrend alive at least in the short term but BTC would need to finally break range high.
NZDJPY: Market of Buyers
Balance of buyers and sellers on the NZDJPY pair, that is best felt when all the timeframes are analyzed properly is shifting in favor of the buyers, therefore is it only natural that we go long on the pair.
Disclosure: I am part of Trade Nation's Influencer program and receive a monthly fee for using their TradingView charts in my analysis.
❤️ Please, support our work with like & comment! ❤️

EUR/GBP BULLISH BIAS RIGHT NOW| LONG
Hello, Friends!
It makes sense for us to go long on EUR/GBP right now from the support line below with the target of 0.880 because of the confluence of the two strong factors which are the general uptrend on the previous 1W candle and the oversold situation on the lower TF determined by it’s proximity to the lower BB band.
Disclosure: I am part of Trade Nation's Influencer program and receive a monthly fee for using their TradingView charts in my analysis.
✅LIKE AND COMMENT MY IDEAS✅

EURCHF Will Go Up From Support! Buy!
Take a look at our analysis for EURCHF.
Time Frame: 6h
Current Trend: Bullish
Sentiment: Oversold (based on 7-period RSI)
Forecast: Bullish
The price is testing a key support 0.932.
Current market trend & oversold RSI makes me think that buyers will push the price. I will anticipate a bullish movement at least to 0.935 level.
P.S
We determine oversold/overbought condition with RSI indicator.
When it drops below 30 - the market is considered to be oversold.
When it bounces above 70 - the market is considered to be overbought.
Like and subscribe and comment my ideas if you enjoy them!

EURUSD On The Rise! BUY!
My dear subscribers,
EURUSD looks like it will make a good move, and here are the details:
The market is trading on 1.1482 pivot level.
Bias - Bullish
Technical Indicators: Both Super Trend & Pivot HL indicate a highly probable Bullish continuation.
Target - 1.1530
About Used Indicators:
The average true range (ATR) plays an important role in 'Supertrend' as the indicator uses ATR to calculate its value. The ATR indicator signals the degree of price volatility.
Disclosure: I am part of Trade Nation's Influencer program and receive a monthly fee for using their TradingView charts in my analysis.
———————————
WISH YOU ALL LUCK

EURUSD Long: Rebound Setup Targeting 1.1560 Pivot ResistanceHello traders! EURUSD continues to trade within a clearly defined descending channel, maintaining a consistent bearish structure characterized by lower highs and lower lows. The recent rejection from the 1.1660 Supply Zone once again confirmed strong seller presence at that level. Additionally, the fake breakout above the channel resistance further highlighted the inability of buyers to shift the market structure.
Currently, price continued moving lower and is now testing the 1.1475–1.1500 Demand Zone, which aligns with the lower boundary of the descending channel. This area has previously acted as a reaction zone, meaning buyers have shown interest here before. The recent candle structure suggests that bears are slowing down near the demand area, indicating potential for a corrective pullback rather than immediate continuation downward.
In my opinion, If buyers manage to defend the 1.1475 Demand Zone, we could see a short-term bullish rebound toward the 1.1560 Pivot Resistance. This creates a favorable area for short-term long positions aiming for corrective upside movement. However, if sellers break below 1.1475 and price closes beneath the demand line, this would signal continuation of the primary bearish trend, opening the path toward lower levels around 1.1420–1.1380. For now, as long as price holds above the demand zone, a corrective rebound remains the more probable scenario. Manage your risk!

BTCUSD: Falling Wedge Reversal in Play Toward 106KHello everyone, here is my breakdown of the current Bitcoin setup.
Market Analysis
Bitcoin (BTCUSD) has recently shown signs of recovering bullish momentum after rebounding from the 100,600–101,000 Support Zone, which has acted as a key demand region during previous tests. The market experienced a fake breakout below the wedge support line, but buyers quickly stepped back in, pushing the price back inside the structure — a classic indication of seller exhaustion and accumulation interest.
Currently, BTC is trading inside a falling wedge pattern, which is typically considered a bullish reversal formation. The recent bounce from the lower boundary suggests that buyers are attempting to regain control, especially after the sharp decline from the 113,700 Resistance Zone. The price is now gradually approaching the mid-range of the wedge, signaling a potential continuation toward the upper resistance line.
My Scenario & Strategy
If Bitcoin holds above the 100,600–101,000 support, the bullish scenario remains valid. I expect the price to gradually move toward the 104,000–106,000 area as the next short-term target, aligned with the wedge resistance line. A breakout and confirmed hold above the wedge resistance would likely signal a trend reversal, opening the door for a larger continuation toward the 113,700 resistance zone, and possibly beyond.
However, if BTC loses the 100,600 support again and closes below the wedge, this would invalidate the bullish setup and could trigger a deeper move toward 98,000 before a new structure forms.
That's the setup I'm tracking. Thank you for your attention, and always manage your risk.

EURUSD Holds Key Support — Potential Recovery Toward 1.1540Hello traders, I’d like to share my view on EURUSD. The market has been trading in a consistent downtrend, respecting the descending Resistance Line, which has acted as a strong dynamic barrier for price throughout the recent move. Each attempt to break above this trendline resulted in either a turnaround or a fake breakout, confirming continued bearish pressure. However, recently price has reached an important Buyer Zone near 1.1480, where strong reaction has been seen several times in the past. This area aligns with horizontal support, increasing its significance. After touching the buyer zone again, EURUSD has shown initial signs of accumulation and early bullish momentum. Currently, the price is attempting to recover from this demand area, forming a breakout above the short-term Support Line — which now potentially flips into bullish structure. From here, I expect EURUSD to attempt a move toward the next resistance area around 1.1540, which represents the nearest Resistance Level. A confirmed breakout above this zone would open the path toward the higher Seller Zone around 1.1660, where previous fake breakouts occurred. But for now, the key confirmation will be whether the price holds above 1.1480 Buyer Zone. A breakdown below the zone would invalidate the bullish setup and likely continue the downtrend. Please share this idea with your friends and click Boost 🚀

Gold Forms Higher Low — Potential Upside Toward Resistance LineHello traders, here’s my current outlook on Gold (XAUUSD). Gold has recently transitioned out of a strong bearish phase, where the price moved inside a descending channel and found significant support near the $3,930–$3,950 Buyer Zone. This support zone has proven to be a key reaction level multiple times, with several fake breakouts followed by strong bullish recoveries — confirming the presence of active buyers. After breaking out of the descending channel, the price began forming a higher-low structure, aligning along the Support Line, suggesting that bullish momentum is gradually returning. However, the market remains capped by the Resistance Line, where several strong rejections occurred, indicating that sellers are still defending higher levels. At the moment, Gold is trading between the Buyer Zone and the $4,020–$4,140 Resistance Zone (Seller Zone). If buyers manage to hold support and form another bullish push from the current levels, we could see an upward move targeting the $4,020 area first, and if momentum continues — a potential retest of the key resistance at $4,140. For now, the structure shows accumulation above strong support, suggesting that buyers still have the advantage. Please share this idea with your friends and click Boost 🚀

USD/JPY(20251107)Today's AnalysisMarket News:
Revelo Labs, a US private data provider, reported that US non-farm payrolls decreased by 9,100 in October; Challenger job cuts in the US surged 175% year-over-year in October, and year-to-date layoffs increased by 65%; Chicago Fed data showed the October unemployment rate was approximately 4.36%, a four-year high. Federal Reserve officials remain cautious. Chicago Fed President Goolsby believes a lack of reliable inflation data and remains hesitant about interest rate cuts; Cleveland Fed President Hammarck emphasized inflation risks and opposed further rate cuts; however, Governor Milan continues to expect a Fed rate cut in December; New York Fed President Williams believes the model-based estimate of the US neutral interest rate is around 1%. Governor Barr pointed out that the impact of artificial intelligence may be affecting hiring in some industries.
Technical Analysis:
Today's Buy/Sell Threshold:
153.33
Support and Resistance Levels:
154.63
154.15
153.83
152.83
152.52
152.03
Trading Strategy:
If the price breaks above 153.33, consider buying with a first target price of 153.83.
If the price breaks below 152.83, consider selling with a first target price of 152.52.

$T with a bullish outlook following its earnings #StocksThe PEAD projected a bullish outlook for $T after a negative over reaction following its earnings release placing the stock in drift D with an expected accuracy of 84.62%.

$GOOGL with a bullish outlook following its earnings #StocksThe PEAD projected a bullish outlook for NASDAQ:GOOGL after a positive over reaction following its earnings release placing the stock in drift A with an expected accuracy of 78.95%.

$AMZN with a bullish outlook following its earnings #StocksThe PEAD projected a bullish outlook for NASDAQ:AMZN after a positive over reaction following its earnings release, with an expected accuracy of 75%.

USDJPY: Expecting Bullish Continuation! Here is Why:
The charts are full of distraction, disturbance and are a graveyard of fear and greed which shall not cloud our judgement on the current state of affairs in the USDJPY pair price action which suggests a high likelihood of a coming move up.
Disclosure: I am part of Trade Nation's Influencer program and receive a monthly fee for using their TradingView charts in my analysis.
❤️ Please, support our work with like & comment! ❤️

AUDCAD: Long Trade with Entry/SL/TP
AUDCAD
- Classic bullish formation
- Our team expects pullback
SUGGESTED TRADE:
Swing Trade
Long AUDCAD
Entry - 0.9144
Sl - 0.9133
Tp - 0.9167
Our Risk - 1%
Start protection of your profits from lower levels
Disclosure: I am part of Trade Nation's Influencer program and receive a monthly fee for using their TradingView charts in my analysis.
❤️ Please, support our work with like & comment! ❤️

NZDJPY Expected Growth! BUY!
My dear followers,
I analysed this chart on NZDJPY and concluded the following:
The market is trading on 86.179 pivot level.
Bias - Bullish
Technical Indicators: Both Super Trend & Pivot HL indicate a highly probable Bullish continuation.
Target - 86.570
Safe Stop Loss - 85.959
About Used Indicators:
A super-trend indicator is plotted on either above or below the closing price to signal a buy or sell. The indicator changes color, based on whether or not you should be buying. If the super-trend indicator moves below the closing price, the indicator turns green, and it signals an entry point or points to buy.
Disclosure: I am part of Trade Nation's Influencer program and receive a monthly fee for using their TradingView charts in my analysis.
———————————
WISH YOU ALL LUCK
