BTCUSD Holds Buyer Zone - Bulls Target 91,500 ResistanceHello traders! Here’s my technical outlook of BTCUSD (2H) based on the current chart structure. BTC previously traded inside a well-defined range, where price moved sideways for an extended period, showing balance between buyers and sellers. This consolidation acted as an accumulation phase. A strong breakout to the upside from the range confirmed renewed bullish interest and initiated an impulsive move higher. Following the breakout, price respected a rising Support Line, forming a sequence of higher highs and higher lows, which confirms a bullish market structure. As BTC pushed higher, it reached the Seller Zone / Resistance Level around 91,500, where selling pressure emerged. Price reacted from this level and pulled back, indicating that sellers are actively defending this resistance. The pullback, however, remained controlled and corrective, with price returning toward the Buyer Zone, which aligns with a key Support Level around 89,200–90,000 and the rising support trend line. Currently, BTC is holding above the Buyer Zone and the ascending support line, showing that buyers are still defending structure. The recent price action suggests consolidation rather than a breakdown, keeping the bullish scenario valid as long as support holds. My scenario: as long as BTCUSD remains above the Buyer Zone and respects the rising Support Line, the bullish bias remains intact. I expect buyers to defend this area and attempt another push toward the 91,500 Resistance Level (TP1). A clean breakout and acceptance above resistance would confirm bullish continuation and open the door for further upside. However, a decisive breakdown below the Buyer Zone would weaken the structure and increase the probability of a deeper corrective move. For now, price is at a key decision area, and patience with proper risk management is essential. Please share this idea with your friends and click Boost 🚀
LONG

XAUUSD Rising Support Holds - Next Target 4,500 ResistanceHello traders! Here’s a clear technical breakdown of XAUUSD (4H) based on the current chart structure. After a prolonged consolidation phase, Gold was trading inside a well-defined range, indicating balance between buyers and sellers. This range acted as an accumulation zone before price initiated a bullish expansion. Following the breakout from the range, XAUUSD entered an ascending channel, confirming a shift toward buyer control with a sequence of higher highs and higher lows. During this phase, price respected both the channel support and resistance lines, using them as dynamic structure levels. As price approached the upper boundary of the channel and the Resistance / Seller Zone around 4,500–4,510, bullish momentum started to weaken. Multiple fake breakouts above resistance signaled strong selling pressure at the highs. This led to a sharp corrective move lower, where price broke below short-term structure before finding support. Currently, XAUUSD is holding above the Buyer Zone around 4,400, which aligns with a key Support Level and a prior breakout area. Price has already shown a reaction from this zone and is now forming higher lows along a newly respected rising support line, suggesting buyers are attempting to regain control. The recent breakout back above local resistance reinforces the idea of a corrective pullback rather than a full trend reversal. My scenario: as long as XAUUSD holds above the 4,400 Buyer Zone and respects the rising support line, the bullish bias remains valid. I expect buyers to defend this area and attempt another push toward the 4,500 Resistance / Seller Zone (TP1). A clean breakout and acceptance above this level would confirm bullish continuation and open the path for further upside. However, a decisive breakdown below the buyer zone would weaken the structure and increase the risk of a deeper correction back toward lower support levels. Please share this idea with your friends and click Boost 🚀

Commodities vs SP500Comparing commodities index vs SP500, it's at its lowest level since 1980.
It's time for a strong rebound ?

BTCUSD: Long Trade Explained
BTCUSD
- Classic bullish formation
- Our team expects growth
SUGGESTED TRADE:
Swing Trade
Buy BTCUSD
Entry Level - 90230
Sl - 89927
Tp - 90908
Our Risk - 1%
Start protection of your profits from lower levels
Disclosure: I am part of Trade Nation's Influencer program and receive a monthly fee for using their TradingView charts in my analysis.
❤️ Please, support our work with like & comment! ❤️

NATGAS The Target Is UP! BUY!
My dear subscribers,
NATGAS looks like it will make a good move, and here are the details:
The market is trading on 3.141 pivot level.
Bias - Bullish
Technical Indicators: Both Super Trend & Pivot HL indicate a highly probable Bullish continuation.
Target - 3.304
About Used Indicators:
The average true range (ATR) plays an important role in 'Supertrend' as the indicator uses ATR to calculate its value. The ATR indicator signals the degree of price volatility.
Disclosure: I am part of Trade Nation's Influencer program and receive a monthly fee for using their TradingView charts in my analysis.
———————————
WISH YOU ALL LUCK

EUR/JPY SENDS CLEAR BULLISH SIGNALS|LONG
Hello, Friends!
EUR/JPY pair is in the downtrend because previous week’s candle is red, while the price is clearly falling on the 4H timeframe. And after the retest of the support line below I believe we will see a move up towards the target above at 183.402 because the pair oversold due to its proximity to the lower BB band and a bullish correction is likely.
Disclosure: I am part of Trade Nation's Influencer program and receive a monthly fee for using their TradingView charts in my analysis.
✅LIKE AND COMMENT MY IDEAS✅

Ethereum Stuck Below Trendline — Bearish Pressure Price is continuing to respect the descending trendline and trading below the EMA, confirming a sustained bearish market structure. Recent bullish attempts have failed near the trendline, showing clear seller defense and lack of upside follow-through.
As long as price remains capped below 3,140–3,160, any bounce is likely corrective and vulnerable to renewed selling pressure.
A bearish continuation below 3,100 keeps downside targets active toward 3,050 → 3,000, with a deeper liquidity objective near 2,970–2,960. Only a decisive breakout and close above the descending trendline would invalidate the bearish scenario and signal a potential trend shift.

Ethereum Breaks Trendline — Bears Take Control Below Key SupportPrice has confirmed a bearish break of the rising structure, failing to hold above the EMA and respecting the descending trendline as new resistance. Recent pullbacks into the trendline are being sold, signaling strong seller control.
As long as price remains below 3,150–3,170, any bounce is likely corrective rather than a reversal. A brief push toward the trendline may occur but is expected to attract fresh selling pressure.
Sustained weakness below 3,100 exposes downside liquidity toward 3,060, with a deeper target near 3,000–2,980. Only a decisive breakout and close above 3,240 would invalidate the bearish scenario and signal a shift back to bullish momentum.

Bitcoin Trapped Between Supply and Demand — Range Resolution Bitcoin (BTCUSD) on the H1 timeframe is currently trading inside a clearly defined range structure, following the previous impulsive rally and subsequent corrective decline. The market has transitioned from trending conditions into balance, with price oscillating between strong resistance and support zones.
On the upside, BTC continues to face heavy supply around the 91,600–92,000 resistance zone. Multiple rejection wicks and failed attempts to reclaim this area confirm that sellers are actively defending this level, preventing bullish continuation for now.
On the downside, price is repeatedly finding bids near the 89,200–89,600 support zone, which aligns with prior demand and acts as a liquidity buffer. This zone has absorbed selling pressure several times, keeping the market from breaking down impulsively.
Currently, price is trading near the mid-range around 90,700–90,900, close to the EMA 50. This is a high-risk area for entries, as price can rotate aggressively toward either boundary of the range without warning.
Bearish scenario: Rejection from the 91,200–91,600 resistance zone, followed by continuation lower, opens downside targets toward 89,200, with extension risk toward 88,400–87,600 if support fails.
Bullish scenario: A clean break and acceptance above 92,000, followed by a successful pullback, would invalidate the range and open upside toward 93,900–94,500.
For now, Bitcoin remains in range-trading conditions. Patience is essential — the highest-probability opportunities will come from confirmed breakouts or breakdowns, not from trading the middle of the range.

Bitcoin Hits High-Timeframe Demand — Bounce or Breakdown?Price is reacting from a well-defined high-timeframe demand zone around 89,400–89,700, where sell-side momentum has slowed after a sharp bearish impulse. This area is a key liquidity pool that previously fueled strong upside expansion.
A bullish reaction from this demand zone could trigger a corrective recovery toward 90,800–91,600, with further upside extension possible toward 92,300 and 93,200 if buyers regain control.
However, a decisive break and close below 89,400 would invalidate the demand, exposing deeper downside toward 88,800–88,400. Price behavior at this zone will be critical in determining whether this move is accumulation or the start of a larger bearish continuation.

Ethereum Slips: Distribution Phase or Setup for a Higher Low?Ethereum on the H1 timeframe has transitioned from a clean bullish expansion into a corrective bearish structure after failing to sustain momentum near the recent highs. The prior series of consolidation boxes highlights a clear stair-step advance, but the loss of bullish follow-through at the top marked the beginning of distribution, followed by a decisive break into a descending channel.
Price is currently trading within this downward-sloping channel, respecting both the upper and lower boundaries with consistent lower highs and lower lows. The recent bearish impulse pushed ETH back toward the 3,100 area, a level that previously acted as a reaction zone during the earlier consolidation phase. This suggests the market is revisiting prior liquidity rather than entering an immediate trend reversal.
As long as price remains capped below the upper boundary of the descending channel, the corrective structure stays intact. Any short-term rebound from current levels is likely to be corrective in nature, potentially rotating back toward the mid-channel region where selling pressure may re-emerge. Failure to reclaim and hold above the channel resistance keeps downside risk active.
If selling pressure resumes, ETH could extend lower toward the 3,000 psychological level and potentially deeper into the 2,900 region, where the lower channel boundary aligns with a larger liquidity pool. Such a move would represent a deeper correction within the broader structure rather than confirmation of a full bearish trend shift, provided higher-timeframe support remains intact.
Alternatively, a strong bullish reaction from current levels followed by a clean break and acceptance above the descending channel would invalidate the bearish corrective scenario. In that case, Ethereum could transition back into expansion mode, targeting higher resistance zones and resuming its broader bullish trajectory.

Bitcoin Breakdown Confirmed — Liquidity Below Is CallingPrice is firmly respecting the descending trendline, confirming a clear bearish market structure after the breakdown from the prior high. Selling pressure remains dominant, with each recovery failing to reclaim structure.
A corrective pullback toward the 90,400–90,600 area may occur, but this zone is expected to act as sell-side resistance as long as price remains below the downtrend line.
Failure to reclaim the trendline keeps the bearish bias intact, opening the path toward the liquidity range at 89,200–88,200. A decisive break below this range would expose the major support zone around 87,000–86,800, where a stronger reaction may finally emerge. Only a strong close above the trendline would invalidate the short-term bearish scenario.

A Familiar Scenario — Downtrend Remains the Dominant BiasBitcoin is now firmly trading in a clear downtrend, which is the main narrative on the H1 timeframe. After failing to hold above the prior highs, price has transitioned from a bullish expansion into a sequence of lower highs and lower lows, confirming that sellers have taken control of market structure.
Recent price action shows repeated rejection from former support levels, which are now acting as resistance. Each recovery attempt is corrective and short-lived, reinforcing the idea that the broader bias remains bearish rather than range-bound or bullish.
The structure clearly favors continuation to the downside. Pullbacks lack momentum, while bearish legs are impulsive and decisive a classic sign of trend strength. Price is currently consolidating below a key resistance area, suggesting distribution before continuation, not accumulation.
The highlighted range between $80,000 – $91,000 reflects temporary consolidation within a downtrend, not a stable trading range. As long as price remains capped below the upper boundary, downside pressure is expected to persist.
Resistance:
91,000 – 91,500 (key structural resistance)
94,800 (major trend invalidation level)
Support:
87,500 – 88,000 (next downside target)
Below this zone opens room for further bearish extension
➡️ Primary Scenario (Downtrend Continuation):
Price remains below the 91k resistance and continues to form lower highs. A breakdown from the current consolidation would likely trigger the next bearish leg, extending toward the 87.5k area and potentially lower.
⚠️ Risk Scenario:
Only a strong bullish breakout and acceptance back above 91.5k would invalidate the downtrend narrative. Until that happens, upside moves should be treated as corrective rallies within a bearish trend.

Bitcoin Is Holding Demand — Bulls May Be Setting Up the Next Price is reacting positively from a well-defined demand zone around 89,700–90,000, where selling pressure has been absorbed after the recent pullback. Despite the prior correction, the broader structure remains constructive as buyers defend this key area.
A sustained hold above the demand zone opens the door for a bullish recovery toward 91,400–92,300, where price may pause near the EMA and prior intraday resistance.
If bullish momentum strengthens and price breaks and closes above 92,300, the upside continuation scenario comes into play, targeting 93,200–93,700 as the next expansion zone. As long as price holds above 89,700, the upside scenario remains the primary focus.

EMA Rejection in Play — Is BTC Setting Up for the Next Bearish Market Context & Structure
Bitcoin is currently trading in a clear bearish market structure on the H1 timeframe. After completing a bullish expansion, price has transitioned into a sustained downtrend, marked by a sequence of lower highs and lower lows. The recent recovery attempts are corrective in nature and have failed to reclaim prior structural levels.
At this stage, price is not showing signs of accumulation. Instead, it is consolidating below key dynamic resistance, indicating that sellers remain in control.
EMA Behavior & Price Action
Price is now reacting directly into the EMA resistance cluster, with EMA 34 acting as short-term resistance and EMA 89 as the higher dynamic ceiling. This EMA alignment is bearish:
- EMA 34 is below EMA 89
- Both EMAs are sloping downward
- Price is trading below both averages
This configuration typically supports a sell-the-rally framework, not a dip-buying environment. The current consolidation near EMA 34 reflects weak bullish momentum, often seen before continuation to the downside rather than a trend reversal.
Repeated failures to close above EMA 34, combined with rejection wicks near EMA 89, strongly suggest that buyers lack strength and that upside moves are being absorbed.
Key Levels
Dynamic Resistance:
- EMA 34 ~ 90,900
- EMA 89 ~ 91,300 (major dynamic resistance zone)
Static Support:
- 89,200 (minor reaction level)
- 87,200 – 87,400 (major downside support / liquidity target)
➡️ Primary Scenario (Bearish Continuation):
Price fails to break and accept above EMA 34–EMA 89 resistance. A rejection from this EMA zone would confirm continuation of the bearish structure, opening the path toward the 89.2k level first, followed by a deeper move into the 87.2k support zone.
This scenario aligns with classic EMA pullback continuation behavior in a downtrend.
⚠️ Risk Scenario:
If price manages a strong bullish close above EMA 89 with follow-through and acceptance, the bearish continuation thesis would be invalidated. In that case, BTC could transition into a broader consolidation or corrective recovery rather than immediate downside continuation.

EURUSD Sellers In Panic! BUY!
My dear followers,
This is my opinion on the EURUSD next move:
The asset is approaching an important pivot point 1.1632
Bias - Bullish
Technical Indicators: Supper Trend generates a clear long signal while Pivot Point HL is currently determining the overall Bullish trend of the market.
Goal - 1.1680
About Used Indicators:
For more efficient signals, super-trend is used in combination with other indicators like Pivot Points.
Disclosure: I am part of Trade Nation's Influencer program and receive a monthly fee for using their TradingView charts in my analysis.
———————————
WISH YOU ALL LUCK

GOLD BULLISH BIAS RIGHT NOW| LONG
GOLD SIGNAL
Trade Direction: long
Entry Level: 4,427.50
Target Level: 4,459.93
Stop Loss: 4,405.83
RISK PROFILE
Risk level: medium
Suggested risk: 1%
Timeframe: 1h
Disclosure: I am part of Trade Nation's Influencer program and receive a monthly fee for using their TradingView charts in my analysis.
✅LIKE AND COMMENT MY IDEAS✅

NG1! BULLS WILL DOMINATE THE MARKET|LONG
NG1! SIGNAL
Trade Direction: short
Entry Level: 3.344
Target Level: 3.469
Stop Loss: 3.260
RISK PROFILE
Risk level: medium
Suggested risk: 1%
Timeframe: 1h
Disclosure: I am part of Trade Nation's Influencer program and receive a monthly fee for using their TradingView charts in my analysis.
✅LIKE AND COMMENT MY IDEAS✅

AUDUSD Massive Long! BUY!
My dear friends,
Please, find my technical outlook for AUDUSD below:
The instrument tests an important psychological level 0.6675
Bias - Bullish
Technical Indicators: Supper Trend gives a precise Bullish signal, while Pivot Point HL predicts price changes and potential reversals in the market.
Target - 0.6699
About Used Indicators:
Super-trend indicator is more useful in trending markets where there are clear uptrends and downtrends in price.
Disclosure: I am part of Trade Nation's Influencer program and receive a monthly fee for using their TradingView charts in my analysis.
———————————
WISH YOU ALL LUCK

AUDJPY LONGS UPTREND CONTINUATION 1:1It looks like AUDJPY wants make a next leg up and has found support. Aiming for last highs for a clean 1:1 trade

BTCUSDT Long: Holding Above Demand, Eyes on 91,800 RetestHello traders! Here’s a clear technical breakdown of BTCUSDT (3H) based on the current chart structure. BTCUSDT initially traded within a well-defined descending channel, where price consistently respected the lower highs and lower lows, confirming strong bearish pressure. This bearish structure eventually reached a key pivot point, from which price reversed and broke out of the descending channel to the upside. This breakout marked a structural shift and initiated a new ascending channel, signaling a transition from bearish to bullish control. Following this rejection, BTCUSDT moved into a range, highlighting temporary equilibrium between buyers and sellers. From this range, price attempted another push higher, once again testing the supply zone. The most recent price action shows rejection from the same area, reinforcing the importance of this resistance.
Currently, BTCUSDT is consolidating between clearly defined Demand (~89,600) and Supply (~91,800) zones after transitioning from a descending channel into an ascending structure. Despite the recent rejection from the supply zone, the overall market structure remains bullish as long as price holds above the key demand area.
My primary scenario: long bias remains valid as long as BTCUSDT holds above the 89,600 Demand Zone and no strong bearish acceptance occurs below this level. I expect buyers to continue defending the demand area, forming a higher low or showing a clear bullish reaction (long lower wicks, impulsive bounce, or an internal break of structure). Once buyer strength is confirmed, a move toward: TP1: a retest of the 91,800 Supply Zone. TP2: in case of a clean breakout and acceptance above 91,800, continuation toward new local highs. Manage your risk!

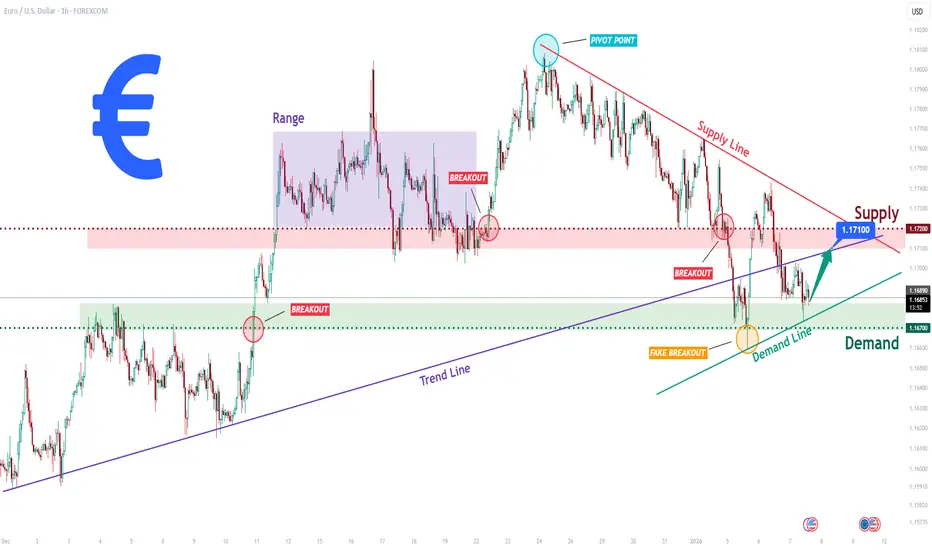
EURUSD Long: Compression Near Key Zones Signals Upcoming MoveHello traders! Here’s a clear technical breakdown of EURUSD (1H) based on the current chart structure. EURUSD previously traded within a well-defined ascending structure, respecting a rising trend line that acted as dynamic support during multiple pullbacks. This bullish phase showed consistent higher lows, confirming buyer control. After the impulsive upside move, price entered a consolidation range, highlighted on the chart, where buyers and sellers temporarily reached equilibrium. From this range, EURUSD executed a bullish breakout, confirming continuation and pushing price toward the upper structure. However, as price approached the Supply Zone around 1.1720–1.1750, bullish momentum started to fade. Multiple reactions, including fake breakouts and rejections near the pivot point, clearly signal strong selling pressure in this area. A descending Supply Line now caps price, reinforcing bearish pressure from above.
Currently, on the downside, price recently swept below short-term support, forming a fake breakout into the Demand Zone around 1.1670, which aligns with an ascending Demand Line. The quick recovery from this area suggests active buyers defending demand and preventing deeper downside for now. Currently, EURUSD is compressing between demand support and descending supply resistance, indicating a tightening structure and an upcoming directional move.
My scenario: as long as EURUSD holds above the 1.1670 Demand Zone and respects the rising demand line, a corrective bounce toward the 1.1710–1.1720 Supply Zone is possible. This area remains a key decision point. A strong rejection there would favor renewed bearish continuation, while a clean breakout and acceptance above supply would invalidate the bearish pressure and open the door for bullish continuation. Manage your risk!
BTCUSDT: Bullish Structure Intact - Targeting 93K ResistanceHello everyone, here is my breakdown of the current BTCUSDT setup.
Market Analysis
BTCUSDT previously traded inside a well-defined consolidation range, where price moved sideways and volatility was compressed, showing balance between buyers and sellers. During this phase, multiple internal swings failed to establish a clear trend direction. Before the range, price experienced several fake breakouts near the upper highs, highlighting strong selling pressure inside the 93,000 Resistance Zone, where buyers repeatedly failed to gain acceptance.
Currently, price is trading above the support zone and consolidating below the key 93,000 Resistance, where selling pressure previously emerged. The structure remains constructive, with higher highs and higher lows still intact, suggesting the move is corrective rather than a full reversal.
My Scenario & Strategy
My primary scenario: as long as BTCUSDT holds above the 90,800 Support Zone and respects the rising trend line, the bullish bias remains valid. I expect price to consolidate and potentially push higher toward the 93,000 Resistance, which acts as the next major upside objective (TP1). A clean breakout and acceptance above the resistance zone would confirm bullish continuation and open the door for further upside expansion.
However, a decisive breakdown below support and the trend line would invalidate the long setup and signal a return to range behavior or deeper correction. For now, buyers remain in control while support holds.
That's the setup I'm tracking. Thank you for your attention, and always manage your risk.
