NZDCHF Set To Grow! BUY!
My dear friends,
Please, find my technical outlook for NZDCHF below:
The instrument tests an important psychological level 0.4642
Bias - Bullish
Technical Indicators: Supper Trend gives a precise Bullish signal, while Pivot Point HL predicts price changes and potential reversals in the market.
Target - 0.4655
Recommended Stop Loss - 0.4633
About Used Indicators:
Super-trend indicator is more useful in trending markets where there are clear uptrends and downtrends in price.
Disclosure: I am part of Trade Nation's Influencer program and receive a monthly fee for using their TradingView charts in my analysis.
———————————
WISH YOU ALL LUCK
LONG

GBPCAD Will Explode! BUY!
My dear subscribers,
My technical analysis for GBPCAD is below:
The price is coiling around a solid key level - 1.8534
Bias - Bullish
Technical Indicators: Pivot Points Low anticipates a potential price reversal.
Super trend shows a clear buy, giving a perfect indicators' convergence.
Goal - 1.8561
My Stop Loss - 1.8518
About Used Indicators:
By the very nature of the supertrend indicator, it offers firm support and resistance levels for traders to enter and exit trades. Additionally, it also provides signals for setting stop losses
Disclosure: I am part of Trade Nation's Influencer program and receive a monthly fee for using their TradingView charts in my analysis.
———————————
WISH YOU ALL LUCK

EURUSD Long: Demand Support Fuels Potential Upside Move Hello traders! Here’s a clear technical breakdown of EURUSD (3H) based on the current chart structure. EURUSD previously traded within a well-defined consolidation range, where price moved sideways for a prolonged period, signaling temporary equilibrium between buyers and sellers and gradual liquidity buildup. This ranging phase eventually resolved to the downside, leading to a sustained bearish move that developed into a clean descending channel, characterized by consistent lower highs and lower lows. Price respected the channel structure well, confirming controlled bearish pressure rather than panic selling. The decline culminated at a clear pivot low, where selling momentum weakened and buyers began to step in, triggering a structural shift. Following this pivot point, EURUSD broke out above the descending channel resistance, initiating a sharp bullish impulsive move. This rally reclaimed key levels and pushed price into the former Supply Zone around 1.1860–1.1870, where bullish momentum stalled.
Currently, EURUSD is consolidating above the Demand Zone and along the rising Demand Line, suggesting that the pullback is corrective rather than the start of a new bearish trend. Multiple reactions from this demand area indicate active buyer interest and defense of the level. As long as price continues to hold above the Demand Zone and respects the rising demand structure, the broader bias remains cautiously bullish.
My primary scenario favors upside continuation after consolidation. A successful hold above demand opens the door for a push back toward the 1.1870 Supply Zone (TP1), which represents the first major upside objective and a logical area for partial profit-taking. A clean breakout and acceptance above this supply level would confirm bullish continuation and signal potential expansion toward higher highs. On the other hand, a decisive breakdown and acceptance below the Demand Zone and the rising demand line would invalidate the bullish recovery scenario and signal a deeper corrective move. Until such confirmation appears, current market structure suggests balance with a bullish continuation bias from demand. Manage your risk!

EURNZD Will Go Higher! Buy!
Here is our detailed technical review for EURNZD.
Time Frame: 4h
Current Trend: Bullish
Sentiment: Oversold (based on 7-period RSI)
Forecast: Bullish
The market is approaching a significant support area 1.958.
The underlined horizontal cluster clearly indicates a highly probable bullish movement with target 1.975 level.
P.S
Please, note that an oversold/overbought condition can last for a long time, and therefore being oversold/overbought doesn't mean a price rally will come soon, or at all.
Like and subscribe and comment my ideas if you enjoy them!

EURUSD Bullish Recovery After Healthy Correction, Target 1.1870Hello traders! Here’s my technical outlook on EURUSD (4H) based on the current chart structure. EURUSD previously traded within a mixed structure that transitioned from a broader corrective phase into a clear bullish recovery. After forming a base near the rising higher-timeframe trend line, price began to print higher lows, signaling the gradual return of buyer control. This recovery phase was supported by a breakout above the descending triangle resistance line, which marked an important structural shift and confirmed the end of the prior bearish pressure. However, after reaching the upper Resistance / Seller Zone around 1.1870, bullish momentum slowed, and the market faced rejection from this key level. This rejection initiated a corrective pullback, which brought price back toward the former breakout area and the Support Level / Buyer Zone near 1.1780–1.1800. This zone is significant, as it represents previous resistance turned support and aligns with the rising triangle support line, making it a critical area for buyers to defend. Currently, EURUSD is stabilizing above this support zone, suggesting that the pullback is corrective rather than the start of a new bearish leg. As long as price holds above the Buyer Zone and continues to respect the rising support structure, the overall bias remains bullish. My primary scenario favors continuation to the upside after consolidation or a shallow pullback, with a potential move back toward the 1.1870 Resistance Level (TP1). This area stands as the first major upside target and a logical zone for partial profit-taking. If EURUSD manages to break above the 1.1870 resistance with strong acceptance, this would confirm bullish continuation and open the door for further upside expansion. On the other hand, a decisive breakdown and acceptance below the Buyer Zone and rising support line would invalidate the bullish scenario and signal a deeper correction. Until such confirmation appears, EURUSD remains positioned for a bullish continuation within the current market structure. Always manage your risk and trade with confirmation. Please share this idea with your friends and click Boost 🚀

AUD/NZD BUYERS WILL DOMINATE THE MARKET|LONG
AUD/NZD SIGNAL
Trade Direction: short
Entry Level: 1.162
Target Level: 1.166
Stop Loss: 1.159
RISK PROFILE
Risk level: medium
Suggested risk: 1%
Timeframe: 1h
Disclosure: I am part of Trade Nation's Influencer program and receive a monthly fee for using their TradingView charts in my analysis.
✅LIKE AND COMMENT MY IDEAS✅

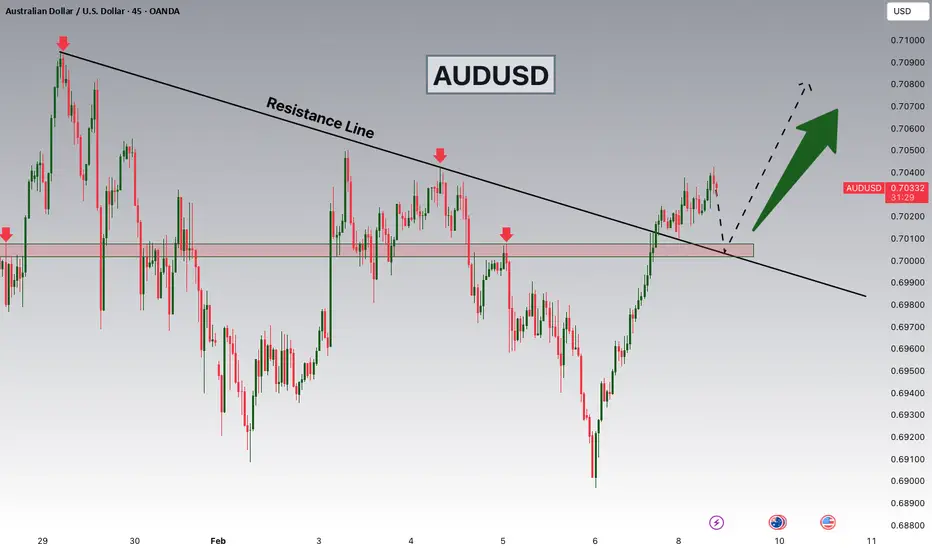
AUDUSD Breakout and Potential RetraceHey Traders, in today's trading session we are monitoring AUDUSD for a buying opportunity around 0.70000 zone, AUDUSD was trading in a downtrend and successfully managed to break it out. Currently is in a correction phase in which it is approaching the retrace area at 0.70000 support and resistance area.
Trade safe, Joe.
Silver Is Compressing Below Trendline — Breakdown Risk Silver remains in a clearly bearish structure on the H1 timeframe. Price is capped below a descending trendline after a sharp impulsive selloff from the prior range high. The bounce from the support area is weak and overlapping, showing corrective behavior rather than genuine accumulation. Each rally is being sold into, confirming that sellers are still in control.
The market is currently compressing between the descending trendline and a well-defined support zone. This type of structure often precedes expansion, and given the broader downside momentum, the probability still favors a bearish resolution. The highlighted support has already been tested multiple times, which increases the risk of failure rather than strengthening it.
A clean breakdown below the support zone would likely trigger continuation toward lower liquidity levels, aligning with the projected bearish path. Only a decisive reclaim above the descending trendline and sustained acceptance would invalidate this setup. Until then, upside moves should be treated as corrective pullbacks within a larger downtrend trade the structure, not the bounce.

Gold Is Bouncing Inside a Bearish Channel — Relief Rally or TrapGold remains structurally bearish on the 1H timeframe, trading inside a clearly defined descending channel. Recent price action shows repeated rejections from the channel resistance, confirming that sellers are still defending lower highs. The current bounce is coming from the channel support line, where price has reacted multiple times in the past, making a short-term rebound technically reasonable.
However, this upside move should be viewed as corrective, not impulsive. There is no clean break above the descending channel or a confirmed shift in market structure yet. As long as price stays below the channel top and fails to hold above prior swing highs, bullish momentum remains limited and vulnerable to renewed selling pressure.
The key decision area lies at the channel resistance ahead. A rejection there would reinforce the bearish continuation narrative, while only a decisive breakout and hold above the channel would invalidate the downtrend. Until then, this is a market to trade reactions and levels not to assume a trend reversal.

TESLA: Market of Buyers
The charts are full of distraction, disturbance and are a graveyard of fear and greed which shall not cloud our judgement on the current state of affairs in the TESLA pair price action which suggests a high likelihood of a coming move up.
Disclosure: I am part of Trade Nation's Influencer program and receive a monthly fee for using their TradingView charts in my analysis.
❤️ Please, support our work with like & comment! ❤️

NATGAS: Long Trade Explained
NATGAS
- Classic bullish formation
- Our team expects growth
SUGGESTED TRADE:
Swing Trade
Buy NATGAS
Entry Level - 3.404
Sl - 3.347
Tp - 3.493
Our Risk - 1%
Start protection of your profits from lower levels
Disclosure: I am part of Trade Nation's Influencer program and receive a monthly fee for using their TradingView charts in my analysis.
❤️ Please, support our work with like & comment! ❤️

QQQ The Target Is UP! BUY!
My dear friends,
My technical analysis for QQQ is below:
The market is trading on 609.55 pivot level.
Bias - Bullish
Technical Indicators: Both Super Trend & Pivot HL indicate a highly probable Bullish continuation.
Target - 620.06
About Used Indicators:
A pivot point is a technical analysis indicator, or calculations, used to determine the overall trend of the market over different time frames.
Disclosure: I am part of Trade Nation's Influencer program and receive a monthly fee for using their TradingView charts in my analysis.
———————————
WISH YOU ALL LUCK

US100 Sellers In Panic! BUY!
My dear friends,
US100 looks like it will make a good move, and here are the details:
The market is trading on 25010 pivot level.
Bias - Bullish
Technical Indicators: Supper Trend generates a clear long signal while Pivot Point HL is currently determining the overall Bullish trend of the market.
Goal - 25505
Recommended Stop Loss - 24728
About Used Indicators:
Pivot points are a great way to identify areas of support and resistance, but they work best when combined with other kinds of technical analysis
Disclosure: I am part of Trade Nation's Influencer program and receive a monthly fee for using their TradingView charts in my analysis.
———————————
WISH YOU ALL LUCK

EURUSD What Next? BUY!
My dear followers,
I analysed this chart on EURUSD and concluded the following:
The market is trading on 1.1791 pivot level.
Bias - Bullish
Technical Indicators: Both Super Trend & Pivot HL indicate a highly probable Bullish continuation.
Target - 1.1804
Safe Stop Loss - 1.1784
About Used Indicators:
A super-trend indicator is plotted on either above or below the closing price to signal a buy or sell. The indicator changes color, based on whether or not you should be buying. If the super-trend indicator moves below the closing price, the indicator turns green, and it signals an entry point or points to buy.
Disclosure: I am part of Trade Nation's Influencer program and receive a monthly fee for using their TradingView charts in my analysis.
———————————
WISH YOU ALL LUCK

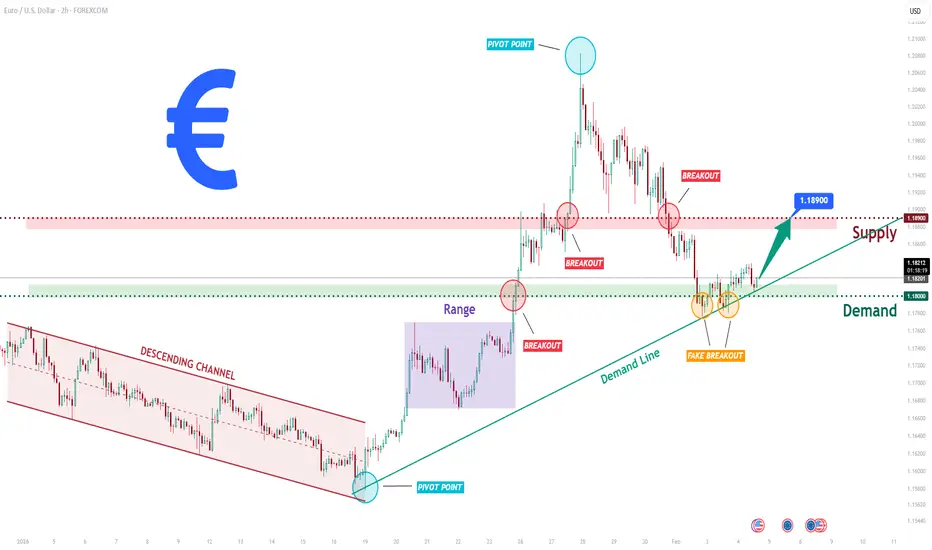
EURUSD Long: Demand Zone Holds - Bulls Preparing Next LegHello traders! Here’s a clear technical breakdown of EURUSD (2H) based on the current chart structure. EURUSD previously traded within a well-defined descending channel, where price consistently respected the descending resistance and support lines, forming a series of lower highs and lower lows. This structure confirmed sustained bearish pressure and orderly downside continuation. The bearish phase eventually reached a key pivot point, where selling momentum weakened and buyers began to step in. Following this pivot, price broke out of the descending channel and transitioned into a ranging phase, indicating temporary balance between buyers and sellers after the trend shift. This range acted as an accumulation zone before the next impulsive move. A clean bullish breakout above the range confirmed renewed buyer control and initiated a strong impulsive rally to the upside.
Currently, EURUSD is pulling back from supply and retesting the Demand Zone around 1.1800, which aligns closely with a rising demand trend line. A brief fake breakout below demand has already occurred, followed by a quick recovery back above the level — a strong sign that sellers failed to gain acceptance below support. This behavior suggests that the current pullback is corrective rather than a full trend reversal.
My primary scenario, as long as EURUSD holds above the 1.1800 Demand Zone and continues to respect the rising demand line, the bullish structure remains intact. A sustained reaction from this area could lead to a renewed upside move, targeting a retest of the 1.1890 Supply Zone (TP1). A clean breakout and acceptance above supply would confirm bullish continuation and open the door for further upside expansion. However, a decisive breakdown and acceptance below the demand zone and trend line would invalidate the bullish scenario and signal a deeper corrective phase. For now, structure, trend, and price behavior continue to favor buyers, with demand acting as the key battlefield. Manage your risk!
US100 SENDS CLEAR BULLISH SIGNALS|LONG
US100 SIGNAL
Trade Direction: long
Entry Level: 25,014.9
Target Level: 26,014.3
Stop Loss: 24,348.7
RISK PROFILE
Risk level: medium
Suggested risk: 1%
Timeframe: 1D
Disclosure: I am part of Trade Nation's Influencer program and receive a monthly fee for using their TradingView charts in my analysis.
✅LIKE AND COMMENT MY IDEAS✅

QQQ: Will Keep Growing! Here is Why:
The price of QQQ will most likely increase soon enough, due to the demand beginning to exceed supply which we can see by looking at the chart of the pair.
Disclosure: I am part of Trade Nation's Influencer program and receive a monthly fee for using their TradingView charts in my analysis.
❤️ Please, support our work with like & comment! ❤️

TESLA Massive Long! BUY!
My dear followers,
This is my opinion on the TESLA next move:
The asset is approaching an important pivot point 410.99
Bias - Bullish
Technical Indicators: Supper Trend generates a clear long signal while Pivot Point HL is currently determining the overall Bullish trend of the market.
Goal - 425.61
About Used Indicators:
For more efficient signals, super-trend is used in combination with other indicators like Pivot Points.
Disclosure: I am part of Trade Nation's Influencer program and receive a monthly fee for using their TradingView charts in my analysis.
———————————
WISH YOU ALL LUCK

NATGAS Technical Analysis! BUY!
My dear subscribers,
This is my opinion on the NATGAS next move:
The instrument tests an important psychological level 3.405
Bias - Bullish
Technical Indicators: Supper Trend gives a precise Bullish signal, while Pivot Point HL predicts price changes and potential reversals in the market.
Target - 3.488
My Stop Loss - 3.360
About Used Indicators:
On the subsequent day, trading above the pivot point is thought to indicate ongoing bullish sentiment, while trading below the pivot point indicates bearish sentiment.
Disclosure: I am part of Trade Nation's Influencer program and receive a monthly fee for using their TradingView charts in my analysis.
———————————
WISH YOU ALL LUCK

ETHUSD Is Going Up! Long!
Please, check our technical outlook for ETHUSD.
Time Frame: 1D
Current Trend: Bullish
Sentiment: Oversold (based on 7-period RSI)
Forecast: Bullish
The market is approaching a key horizontal level 2,050.77.
Considering the today's price action, probabilities will be high to see a movement to 2,817.29.
P.S
Overbought describes a period of time where there has been a significant and consistent upward move in price over a period of time without much pullback.
Like and subscribe and comment my ideas if you enjoy them!

GBPNZD Will Go Higher From Support! Buy!
Take a look at our analysis for GBPNZD.
Time Frame: 5h
Current Trend: Bullish
Sentiment: Oversold (based on 7-period RSI)
Forecast: Bullish
The market is on a crucial zone of demand 2.261.
The oversold market condition in a combination with key structure gives us a relatively strong bullish signal with goal 2.277 level.
P.S
The term oversold refers to a condition where an asset has traded lower in price and has the potential for a price bounce.
Overbought refers to market scenarios where the instrument is traded considerably higher than its fair value. Overvaluation is caused by market sentiments when there is positive news.
Like and subscribe and comment my ideas if you enjoy them!

BITCOIN BUYERS WILL DOMINATE THE MARKET|LONG
BITCOI SIGNAL
Trade Direction: long
Entry Level: 69,967.58
Target Level: 85,412.99
Stop Loss: 59,642.66
RISK PROFILE
Risk level: medium
Suggested risk: 1%
Timeframe: 1D
Disclosure: I am part of Trade Nation's Influencer program and receive a monthly fee for using their TradingView charts in my analysis.
✅LIKE AND COMMENT MY IDEAS✅

GBP/AUD BULLISH BIAS RIGHT NOW| LONG
Hello, Friends!
The BB lower band is nearby so GBP-AUD is in the oversold territory. Thus, despite the downtrend on the 1W timeframe I think that we will see a bullish reaction from the support line below and a move up towards the target at around 1.950.
Disclosure: I am part of Trade Nation's Influencer program and receive a monthly fee for using their TradingView charts in my analysis.
✅LIKE AND COMMENT MY IDEAS✅
