BTCUSD: Test Of Low In Sight But Bears Beware.BTCUSD update: Lower high increases the possibility of the failed low attempt around the 9683 level. To break this bearish bias, price needs to push above the 12346 minor resistance zone.
Even though a higher low formation has been established above the 9989 area, that does not guarantee we will get the new rally back to 15K or 16K. It increases the chances UNLESS the market changes which we have no control over. As a price action trader I do not fight or insist or assert my ego, I simply adjust.
The current bearish pin bar that is forming indicates such a change and points to the possibility of the bearish momentum leading this market toward retesting the lows once again. In order for this scenario to follow through, the bearish pin bar needs to close in the current configuration and the next candle needs to break the current candle low and close weak as well. IF this sequence occurs, then the retest of the lows becomes much more likely.
What is the failed low formation? As I wrote in my previous report, the failed low is when price goes slightly lower (often into a reversal zone) and then proceeds to reverse dramatically. Often a pin bar will appear in these type of situations. Failed lows look extremely bearish at the bottom and are usually accompanied by a lot of hype, drama and bearish news.
Trading failed lows often provides very attractive reward/risk since the best prices become available. The key to watch for is the reversal candle formation within the reversal zone which in this case can be between the 9683 area and the 8656 boundary. IF the reversal candle never appears (and closes) then that is a sign to steer clear because it will indicate bearish momentum is taking prices to much lower levels.
I am still long from an average price of about the mid 12Ks and do not intend to exit. I write about the bearish possibilities because they are important to be aware of for risk management purposes but if the reversal candle that I am anticipating appears, I will simply buy more. What makes me so bullish in such a situation is the key support area and repetitive buying patterns.
I am evaluating and positioning myself for a broader rally that may take days or weeks to unfold in this market. It is just a matter of a bullish catalyst taking the market by surprise that will spark such a move.
In summary, being able to anticipate what the market is likely to do next provides a way to constantly adjust risk and expectations. Bullish momentum came into the market, but has stalled for whatever reason but do not lose sight of the bigger picture. Lower highs often lead to lower lows BUT there is no guarantee that this market will push lows here especially in light of being within a relevant support zone. Any minor higher low or immediate reversal off of a lower low (failed low formation) and I am looking to add to my position trade long. IF price breaks below dramatically, then I just sit on my position and wait for renewed signs of stability and evaluate from there. IF instead price never pulls back and pushes through the minor resistance, then we are back in the bullish momentum scenario. Trading and investing effectively starts with a plan, and that plan begins with an evaluation process that considers multiple scenarios. Either the market confirms or it doesn't and based on your risk tolerance you should know ahead of time what action you are going to take. Not reaction.
Questions and comments welcome.
Lowerhigh

ETHUSD: Lower High Can Lead Back To 872 Area?ETHUSD update: Lower high established at the 1160 level which is not far from the 1216 to 1304 resistance zone. This formation is appearing across the main coins and signals further short term weakness.
This is the trading environment as I described weeks earlier. Vertical markets breed bad habits and now is when the bad habits become expensive. As I wrote in my previous BTC report, buying into the now minor peak had to be done responsibly and for me that means with fractional sizing and no margin. I also wrote that I prefer to wait for the retest of the supports which is now underway across the board.
In this market, a retest of relevant support levels is IF price can make its way back into the 872 to 739 area (.618 support zone relevant to recent bullish structure). That would produce a broad double bottom or possibly a failed low formation and would be a good location to consider a swing trade long according to my plan.
The extreme price that I would be open to buying into is the 670 level which is the lower boundary of the reversal zone measured from the 770 low. This zone is based on a proportion of the most recent bullish swing. IF price pulls back that far (anything can happen),I will be looking for reversal candles such as a pin bar or engulfing pattern to enter into a position trade long. I like this area the most because it represents an extreme price which is often where the herd is pushed out of longs or emotionally seduced into shorts. It is also where risk on the long side is the lowest relative to recent price structure.
Speaking of shorts, selling into a lower high is not a bad idea, because reward and risk can be clearly quantified. Overall 1160 is the level to define risk from while the nearest target is 872. The current price is not the best entry since reward/risk is around 1:1 or less, but a minor retrace higher can present an opportunity on the swing trade time frame. I do NOT short these markets because I do not use margin, and I intend to participate on the bigger picture which is bullish. For those of you who are comfortable with this side of the market, you must not hesitate to take profits if you have the opportunity because the general environment is bullish and shorts will most likely get squeezed fast. I mention the short side because being aware of both sides of a market is part of having perspective.
In summary, lower highs often lead to lower lows and within the context of a bullish bigger picture, a conflicting situation like this can be confusing. This is why a well defined plan and flexibility allow for effective trading around the confusion while the reactionary herd is still looking for the uncommon and unrealistic vertical market environment. My plan, just like in the other markets, is to participate on the long side which is in line with the bigger picture. As this bearish retrace may present a short term opportunity for some, I am waiting for the broader trend to reassert itself and I have levels to anticipate where that change will most likely take place. Either the market confirms my scenario, or I don't participate it is that simple.
Questions and comments welcome.

USDCHF 4HThere is now a possibility that price could now see some further retracing to the upside, as price has been in a strong downtrend now looking for some breathing room ..

USDCAD 4HI believe price finished making its retracement (Lower high) rejecting off daily resistance 1.25850 with a daily pin bar, now waiting for a break of the CTL for shorts down to previous support & a break of that will shoot price down to the next area of daily support (Lower low).

EURNZD 2HLooks like a potential double bottom off strong daily support, waiting for a daily closure for potential longs. I would now be buying the pullback (lower high) completion before a potential new low..

USDCAD 60Price broke its higher time frame counter trendline & is coming back for a retest. Now looking to create a lower high before continuing its downtrend..

USDCAD DAILYPrice on a strong level of daily support / fibonacci support, may get a retest of broken consolidation or to the 38.2 fibonacci level before a lower low..

XAUUSD 60 Price having a hard time breaking above 1325 daily resistance, showing we may see some exaustion before building potential bullish momentum again. Watch for a break & retest of the ascending trendline for shorts down to monthly support !

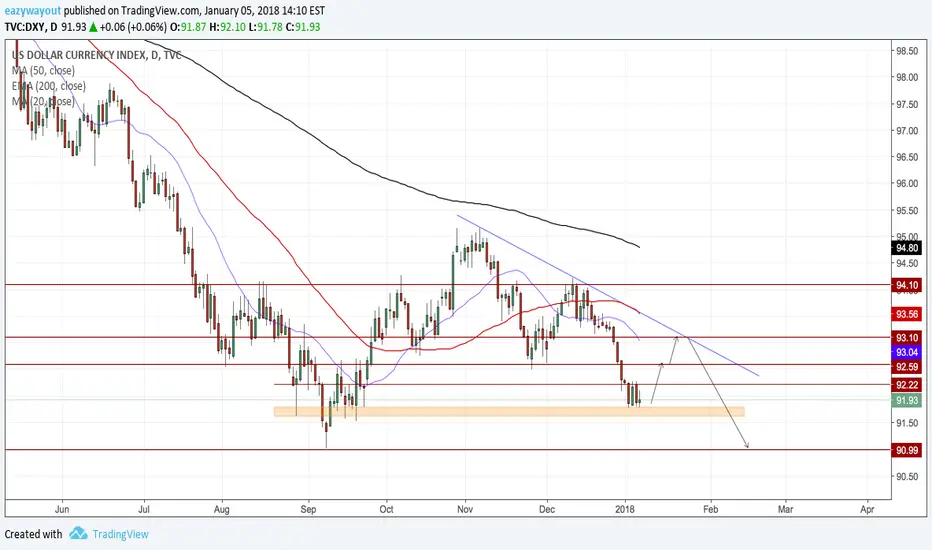
DXY (Dollar index) DailyPrice is rejecting at a strong level of support, & I believe there will be a rebound in the dollar for some time before a potential continuation down to 91 weekly support.
GBPAUD 4HPrice getting ready to complete its 5th wave down to the next level of daily support, where at that point I will look for a potential reversal. Price came back for a bit deeper of a retracement & is now rejecting a strong level of daily resistance / the 50% fibonacci zone.

BTCUSD: Break Of 14400 Can Lead To 16350 Resistance Retest.BTCUSD update: The 16350 resistance zone stays intact while price retests 13145 which is within a minor support zone. Is this a good retrace to buy? Let's consider the scenarios.
First, price has held the 13269 to 12581 support zone which is the .618 area relative to the recent bullish swing. At the moment price action is consolidating just above which can unfold in two formations that are worth considering.
When I refer to consolidation I am referring to an inside bar formation, or a series of dojis. In the current configuration, price may be forming a mini symmetrical triangle if the current candle closes the way it looks at the time of this writing. Triangles are continuation patterns and the appearance of one in this position is likely to lead to a continuation of the bearish momentum which can take prices into the minor support area below, or even through it. This scenario could see price retesting the 11600 low for a potential triple bottom formation. I would rather look to buy there than here.
The appearance of a small bear flag can also unfold here which is more likely to lead to lower prices rather than higher. These bearish scenarios are contingent on the 14400 minor resistance level staying intact (.382 of current bearish swing).
The signal that price is more likely on its way back toward the 16350 to 17876 area is a decisive break above the 14400 level meaning price needs to close above the level and on the high of the period.
So in terms of taking a position, this level is a tough call because there is no clear signal or formation calling for a long, but price is fluctuating between a minor support area and resistance level.
This is where your risk tolerance and trading plan have to come together to make the trading decision. From the perspective of my trading plan, the reward/risk is attractive since the 13145 low can be used as a reference point, compared to the nearest target which is the 16350 area. The problem is reward/risk is not the only factor that goes into a trade decision. My plan requires some form of confirmation which is missing at the moment and does not offer any special bias in my favor.
From the investor perspective, this is a swing low which simply offers a better opportunity than buying at a swing high. If sized appropriately (according to your plan) you won't be seriously affected IF price decides to test the 10K level or lower. That just becomes another buying opportunity. Precision is not required for this method because you are using position sizing without margin to average in. As long as you believe in the long term viability of this coin, and are willing to lose your investment, then this strategy is the less complicated of the two.
Keep in mind if you are using another exchange like Coinbase or any other where price is not the same, you have to translate the prices from this chart to your own chart. The formations will be the same, even if the prices are not.
In summary, I laid out the details of what to consider while price is fluctuating within an attractive reward/risk area without momentum confirmation. Risk/reward is not the only factor that goes into making a swing trade decision according to MY plan and is why I will not take a swing trade long here. Based on the momentum, I think price can retest lower levels and I am willing to wait for that possibility before taking a longer term position. Again YOU must decide what you are comfortable with, I cannot make that decision for you. If you are depending on the analysis of other people for outright buy and sell decisions, in the long run you will be subject to a random outcome. You might as well flip a coin.
Comments and questions welcome.

USDJPY 4HWatch for a break of the CTL (pink line) for completion of the right shoulder. A break above 113 will invalidate this setup & long positions will be considered..

Bitcoin Double Top? Don't Bet On It.BTCUSD update: 17579 is a new high, but barely compared to 17171. This is the double top variation scenario that I wrote about in my previous report. Is the top in place?
After watching the kind of vertical moves that have occurred in ETH and LTC, this appears to be an anything goes market so even though these conditions are rare and high risk, the strength is clear and must be acknowledged. This means the bearish signs that do appear do not carry as much weight.
In the case of this market, I wrote about the double top variation which is what is unfolding at the moment. Price makes a new high, but not much higher within the reversal zone (below 18300). In a normal market this would be a sign of coming weakness and even offer potential short signals on smaller time frames. The problem is this is NOT a normal market.
I realize there are a lot of people itching to short this market because reward/risk is attractive at these levels and even a relatively small move lower is worth a couple of thousand points. And if you have the risk tolerance and ability to put a short position on, this would be a better time to try compared to the previous price action. Just remember keep this in mind: Weak markets do not sit and consolidate near highs. They reject resistance fast which is not happening right now.
This is why acknowledging the bigger picture is so important because it sets expectations that are more in line with the intent of the market. Newer traders see a bearish pattern and jump on it with high expectations while the position may offer some profit, but expectations should be limited until this market shows significant signs that a broader correction is more likely which it is not doing right now.
Until this market breaks some significant support levels like 12400, it is more likely to consolidate and attempt to go higher. In this bullish environment, support levels are more likely to hold.
As far as swing trades go, I want to see price retest the 12400 area (.382 of bullish structure measured from the 4k low) and then show reversal patterns for a retest of the high. Also the 14280 level is an interesting area because it is a .382 of the bullish structure measured from the 8821 low. IF the market retests these levels, it could be setting up a head and shoulders formation on a large time frame which would then imply a short term top is in place, but right now it is too early to tell while the broader structure still exhibits strength. If I am going to take swing trade I want to be in line with the bigger picture, not against it.
In summary, a -500 or more day in a market that has the ability to move 2k is not much. Maybe the futures are beginning to have the effect that I have been writing about as far as bringing more of a balance. We can sit here and speculate about how and why, but again the market doesn't care what we think. As a price action trader, I am always comparing current price action to previous structure and history, and evaluating that information in light of the bigger picture which carries the most weight. So using what is available now to answer "is the top in place?" the answer is no, because there is not enough supporting evidence to make a strong argument. Remember making money in vertical markets does not require skill, but keeping that money is a different story. If the market is not coming to you, there is no need to put on a trade. Flat is a position too.
Questions and comments welcome.

ETHUSD Falling Apart Or Buying Opportunity?ETHUSD update: After retesting the .618 resistance zone, this market has broken the 450 support area and is now sitting within a support zone. The big question is: Is this a good time to buy?
My first impression of this price action is investors are selling their ETH to buy more BTC because of it's relentless new highs in anticipation of the futures contract starting on Sunday. Markets like BTC are extremely rare, and are great if you are in, but the futures are going to bring it back to reality. I believe the futures are going to attract a lot of volume away from the current exchanges because of their security, flexibility and credibility (something current exchanges are missing).
This market is behaving more in line with reality. In reality, prices correct to some degree. And at the moment, this price is sitting within the .618 support zone of the recent bullish swing that failed to make a new high. Aren't support zones a place to buy? They are, except when momentum is bearish which is the case here.
In support zones like this, I prefer to see a chart pattern reversal before getting long. On the current time frame or even smaller. Or I would like to see a candle stick reversal off of a retested level like a double bottom.It is not happening here. Just like there are no confirmation for shorts in BTC, there are no confirmations to go long in ETH for a swing trade at the moment.
Since the momentum is still bearish, I am expecting price to retest the 385 low, and possibly the bullish reversal zone somewhere above 361. These are the levels where I will be watching for reversal formations to go long for swing trade in anticipation of a retest of the 470 to 488 resistance zone (.618 of previous bearish swing).
IF price decides to reverse sooner without a formation then a bullish break of the 435 resistance (.382 of recent bearish swing) is the signal I will need to see. At that point I can look for a shallow retrace, or some other signal to start buying. Confirmation is key, because what happened at 455 can happen again. This is what I am expecting BTC to behave more like once balance returns (and the majority of U.S. investors and traders will be able to short).
In summary, buying a pull back in a broader bullish trend is in line with my trading plan, BUT some form of confirmation is required. This process helps to filter out many false starts or buying too early. It is no different from shorting BTC right now which I have been warning against because there are no signs at all. Do you want to see what a market that is setting up for a sell off looks like? The two week double top formation in this market is a prime example. Relative to the current formation, any price action below 385 will be extreme and offer the best reward/risk, just wait for a reversal formation. Usually before the market starts working its way back up, it will show a pattern on a smaller time frame (look at the long tails at the 400 and 385 low that were tested a week ago). When it comes to TA and these markets, there is a huge amount of ignorance which will serve as an advantage as these markets return to reality. Remember TA is most effective for evaluating momentum and reward/risk on smaller time horizons. People who can put this into perspective and recognize its limitations are the ones who have a better chance at achieving consistency. Normalcy does not imply a bear market, just one that does not go up in a straight line. The BTC situation is breeding unrealistic expectations and reinforcing bad habits which will be the mechanisms that offer the more experienced traders opportunities when these markets regain some normalcy.
Comments and questions welcome.

ETHUSD Perspective And Levels: Lower High Within Triangle?ETHUSD update: This market is in a wide consolidation within a bullish trend which often means prices are poised to go higher, but upon further evaluation there is a lower high in place which is not a bullish sign. I realize no one wants to hear about a mixed market, but I have no choice but to write what I see.
Just a quick reminder, I chose to write about my swing trade strategy for these markets. I chose it because it allows me to write realistic and timely analysis that offers perspective. It is not the only strategy or market I trade, but it is the only one that I write about. On top of that, I am very selective with the trade calls. If you are looking for trades and action, there are many other analysts in this community that you can refer to. My analysis provides "perspective and levels" that you can use to make your own judgements on.
As far as this market goes, it is in a wide consolidation, while at the same time failing to break beyond the .618 resistance zone that is relative to the most recent bearish swing. On top of that, there is an outside bar (482.70 to 431) which establishes a lower high formation within the resistance zone. These are bearish signs while the overall triangle itself tends to be a trend continuation pattern which is bullish. So which carries more weight?
The triangle because the structure is larger in terms of time and is in line with the trend. For a swing trade, buying the breakout is tricky. Why? Because buying into this breakout is buying right into a minor resistance, rather than a reversal formation near a support. A break beyond the previous high of 482.70 will trigger a long signal, but the nearest reasonable target is the 500 to 510 area which is a potential 30 points while the risk is at least 35 to 40 points (446 area which is the .382 of the recent bullish swing). The reward/risk can be adjusted to about 1:1 with some stop adjustment, but for me, the trade entry criteria is not present. I am not going to force a trade, but if you are okay with the risk, and are monitoring this market frequently, then it can be a worthwhile break out.
For me to get long at this point, I would rather see price retest the 445 area for a double bottom or failed low formation on a smaller time frame. The reward/risk is much more attractive, and a higher probability for price to follow through. So that is my plan.
If price happens to break the 445 and 400 levels, then the 345 extension target (see previous ETH report) may still be in play. Remember, these markets sell fast and shake out weak hands quickly. That scenario will negate the bullish triangle that is present at the moment.
In summary, I get many questions about how this market will be affected by the introduction of BTC futures. My initial thought is it will take the spot light away from these markets but not have a dramatic effect on price range, that is my best guess. No one knows how the futures will affect these markets, not even the official experts, we just have to wait and see. This market is in a position to go either way since it is in the middle of the range. The bias is still bullish, but there are clear bearish signs that make for a very conflicting situation. When I evaluate swing trades, I look for more reasons to stay out of a market instead of getting in. I may miss moves, but avoid tons of REAL losses which is what has kept me in this game for so long, while many of my peers that I started with left the business years ago. Something to consider.
Comments and questions welcome. (I am trying to catch up on all these, and others have stepped up to address questions and concerns, and have done a great job which is nice to see, if you have a pressing question, a PM will get a faster response).

BTCUSD Perspective And Levels: Flirting With Highs Mixed Market.BTCUSD update: Price retests the 10450 to 10880 resistance zone quickly and is now hesitating. Is this bullish now? Not exactly. The market is still flirting with the upper border of the resistance which makes it risky for both shorts and longs. In this report I will highlight the levels and POSSIBILITIES to consider.
First, for those who are incapable of taking responsibility or feel that you are losing when a market moves in a favorable way and you are not in, DO NOT read my reports, they will not help you. The market is a much more effective teacher than me, just make sure you understand, the lessons will be expensive.
Now, for the rest of us who do understand the limitations of TA, and how financial markets work. I realize one thing that these coins have that other traditional markets do not, and that is an extreme imbalance of shorts. This is just a theory, but it may help explain the absence of persistent selling. The majority of U.S. retail customers do not have the ability to short. If a U.S. customer opens an account outside the U.S., most of the exchanges restrict these customers from having margin accounts. This type of condition dramatically limits selling pressure. I realize U.S. customers are not the only people active in these markets, but they do make up a significant portion. This means shorting carries additional risk in general but the futures may change that.
Institutions have access to deep pockets and WILL have the ability to short. Futures contracts are typically short term trading instruments that institutions will be able to use for reasons other than outright directional trading and investing. It will change the balance of power and will most likely enforce the behavior of more balanced markets. Not retrace 1K and the next day back up 1K. The entry of institutions is going to ruin the party for the retail trader, not enhance it.
Here is my perspective on the POSSIBILITIES BASED ON MARKET STRUCTURE at the moment. (Note to the entitled: THIS CAN CHANGE QUICKLY). Price is flirting with the upper border of the 10450 to 10880 resistance zone which is a .618 of the initial bearish swing. What makes this a tough area is it has broken the resistance which is bullish, but has stopped at the upper boundary which now makes it questionable. It is possible that price may consolidate for a day and then break to new highs. Capturing moves like this are possible but RISKY because the retrace potential is high and the nearest shallow support is at 10232 (.382 of current bullish swing). Unless you are day trading and taking smaller risk, longer time horizon trades at these levels ARE high risk and not worth the potential loss.
The bearish scenario: Price is sitting in close proximity to a resistance area, it is near the all time high (possibility of a double top) and beyond that, it is facing a wide reversal zone (up to 12094). The reversal zone is an extension beyond the recent peak measured from the 8821 low. If price blows through the reversal zone, then further strength is likely. With all this being said, there are NO signals to get short. Shorting right now may work out, but keep in mind it is a pure gamble because there is NO confirmation of selling. The nearest level that I am using as a reference to confirm that this market is likely to retest the low 9ks is a break of the 10292 level (.382 of recent bullish swing). Until that happens, this market is likely to consolidate and retest the highs.
In summary, these are wild markets that will most likely be tamed by the entry of institutions. Bubbles are not about fundamentals, but instead about euphoria. They persist until something changes the perception of the participants, especially when there is built in regulatory restriction on selling. I do not care how high or low a market goes, I simply seek high probability scenarios because it is consistency that breeds success not home runs.
Comments and questions welcome.

BTCUSD Perspective And Levels: Looks Like 8Ks before 12Ks?BTCUSD update: After making the all time high of 11441, the rug gets pulled and now that this market has attempted to reestablish some stability, it is possible to get a better idea of where price is likely to go next.
The outside bar that was painted 3 candles ago (11441 to 9000) is a sign of a top, at least a temporary one. For those who were shorting too early, THIS is an example of what should be in place BEFORE you even think about shorting this market. I also wrote about the symmetrical nature of the zig zag that produced an extension at the 10650 area which was not exact, but as you can see, was within the ball park of the peak. This why I kept repeating, lock in profit while you CAN, not when you have to.
This dramatic price action has generated new levels to be aware of and has signaled a change in momentum to bearish. Measuring from the 5400 low, the nearest relevant support is the 9120 area which is now showing signs of a double bottom. Below that, there is the 7650 to 6690 area which is relative to the .618 area. The new resistance zone to watch for a retest is now the 10450 to 10870 area which is relevant to the .618 of the new bearish swing.
This kind of price action is where people buy too early and think they just got a good price before the next run to 12k. Based on the current structure, this market is more likely to test the low 8ks or high 7900s before finding any significant stability. Even though there is a double bottom in the low 9ks to 8800 area, it carries much less weight in this bearish context. And relative to the big picture, the low 9ks is an extremely shallow support.
The level to now watch for is a failed high within the 10450 to 10870 area. That is the place to experiment with shorts, NOT when this market is making new highs. Price actually tested this area very briefly and rejected it which also adds weight. Typically corrective moves unfold in 3 waves, (a zig zag formation) and at the moment, is possibly setting up for the next leg lower. I cannot short these markets even if I wanted to because I am not treading on margin. I have no problem waiting for a much lower price to buy into after stability reappears.
I am writing about this bearish scenario because these are the signs that the market is showing based on structure and price action, and is NOT based on my feelings, opinion or anything else. I am flexible and have the ability to adjust to new information. Which means IF the market happens to break above the 10870 area with conviction, then that will negate this bearish scenario that I am writing about now. As long as it stays below 10450, the bearish scenario is likely to persist. That is what markets do, and it is our job as short term traders to go with the flow, not assert our meaningless opinions to validate our egos.
In summary, I have NO intention of getting involved in this market until I see levels and price structure that are in line with my swing trade plan. Since I can't and do not short these markets, I have no choice but to stay out and observe. A break below the 8800 area will signal the next bearish leg is in play and can take this market back to the low 8ks. Do not get fooled by the initial leg of a likely broader sell off. Pay attention to the technical signals, not the news which can easily mislead the less experienced into thinking this is a buying opportunity. This market has gone too far too fast which is extremely abnormal (look at a weekly chart), and the corrective move that is attempting to unfold is actually very healthy and required before this market can continue higher. I do not know how low this market will go, but I do know that it is too early to view the current retrace as a buying opportunity. Be patient, make your plan and let the market come to you.
Comments and questions welcome. (I appreciate the community members helping to answer questions here, again if it is a pressing question, PM will get you a faster response).


ETHUSD Perspective And Levels: Initial Selling And 345?ETHUSD update: My 516 target was touched before the rug got pulled and is now showing signs of a top. My swing trade was exited at 499 on the way to 500 according to PLAN for a 30+ point profit (in a matter of hours). I have NO intention of getting back in until signs of stability return.
The fact that this market went from 516 back to 400 within hours is definitely a reminder of how risky these markets are. This is why it is always MORE important to calculate risk, than it is to anticipate profit. I did not expect my trade to hit it's target in a matter of hours, I figured a day or so, but I knew my risk going into it, and based on the structure and the signs at that moment, the RISK relative to the potential that I evaluated made sense for MY swing trade plan. It was not an emotional play, and I have no fear of missing out as some less experienced trader suggested. I placed my target at the time I entered the trade at 499 simply because I figured 500 will pose some psychological resistance even though I had an extension at 516. I know the limitations of TA and I understand that I am not dealing with absolutes, but instead estimates.
At this point, all the markets have developed a similar structure and this can be the initial leg of a more bearish structure. I have NO intention of buying any near by supports until I see clear signs of stability. The signs that imply further weakness include the long wick off of the 516 extension, the decisive break of the consolidation support, and two minor support levels just below it. There are now two resistance levels to watch for and they are the 450 area (previous support) which is now the .382 resistance of the new bearish swing. And the 476 to 492 area which is the .618 resistance relative to the new bear momentum as well.
Based on the concept of market symmetry, if this corrective move is going to unfold in a zig zag where the first and third leg are of equal length, then that puts the potential completion of this selling effort at 345. This is not an absolute prediction, but offers some estimate of how far this market can retrace before the selling is more likely to exhaust itself. This is the same type of measurement that I use to generate the extension targets when the market is pushing highs.
Since there is a very bullish bias in these markets generally, price may find stability sooner, but I will let the structure appear before I look to evaluate any new longs. One scenario would be a larger time frame double bottom in the 400 area which can take at least a day or two to unfold.
In summary, when everyone is celebrating new highs and eating up all the hype, it is easy to forget the risk. These markets are extremely risky and can get the rug pulled from under them at a moments notice. I keep getting messages from traders who seem to have this built in assumption that these markets are normal and that they are stable investments for the future. Stable investments do not move at the rate of 5 to 10% in a day higher or lower. These are extremely speculative markets which are ideal for short term trading strategies because they change so fast. I kept urging people to lock in some profits WHILE YOU CAN, and instead I get, "So how much higher is this going to go?". Selling the top is a lottery ticket, a long shot, low probability. Focus on mitigating risk, and high probability strategies like defining levels and waiting for structure to better confirm trades. If you're only plan is to "just make money" then you should not be in these markets. As far as the current structure, there is likely at least one more selling leg and I have no interest in buying at the moment until stability is clear as defined by MY plan.
Comments and questions welcome.

BTCUSD Perspective And Levels: Extreme Prices And The Retrace.BTCUSD update: Price decline to 5400 and then sharp retrace leaving behind a possible pin bar on the larger time frames. This is most likely the completion of the A Wave.
Keep in mind in markets where emotion runs to extremes, levels are going to be far from precise. The 6030 level was the area where I was looking for a bullish retrace to begin the B Wave counter correction, but price went to 5400 instead. This is not logic driving these markets when prices extend that far that fast and then reverse.
More importantly, if the current candle closes with a long tail, it will establish a pin bar. These are reversal candles and when they appear on a large time frame (4 hour and above) they carry a lot of weight. A break of 6469 will signal bullish momentum and most likely the beginning of the B Wave.
I have written previously that these are tricky waves because they often fool investors into thinking it is the next leg to a new high. If the B Wave unfolds, it is possible for price to retest the 6950 to 7350 zone which is the .618 resistance of the current bearish swing. How is this information helpful?
For one, if price breaks above the 6569 high, this market is likely in retrace mode so that means if you have been shorting, you should stop until the next resistance is reached. Possibly lock in more profit (if you are short from the 7ks) and cut losses if you shorted the lows. Also there will be many day trade opportunities on the long side if the market manages to work its way back up to the low 7ks.
Why not go long for a swing trade? The reason is the coming bounce (IF it unfolds) is less likely to reach the low 7ks. In the face of such bearish momentum, it may only go to the .382 resistance at the 6350 area and then continue lower. This price action does not favor swing trade longs. And again this is where smaller time frame strategies like day trading solve that problem because the trade is open for a much smaller period of time. Things change way too fast in this market to be taking low probability trades especially when more time in the market is involved.
It is possible for the B Wave to be a small retrace that does not get beyond the .382, either way, the next wave which is the C Wave can take this market to the high 4ks. There is a .618 support zone at the 4789 area which is relative to the recent bullish swing originating from the 2980 low. It is just under the broader support in the 4950 area that I have written about in previous reports. A failed high (B Wave) can lead to these levels in the next week or two if this correction persists.
IF price manages to retest the high 4ks, that would be an area to watch for some form of stability. Such as a double bottom that takes a number of days to form. This is the area where I would be interested in buying for a broader move back up if the right structure presents itself. That is my plan.
Also now that BCH is in play, (and much stronger in terms of fundamentals) BTC may not be worth holding for the long term anymore. It appears BCH is attracting all the investors. That is a risk that we all face with these coins because technology evolves so fast, a coin can become obsolete relatively quickly. And this is why TA is so valuable, it provides signs that can prepare you for what is more likely to happen next, just like the top of this sell off. News is only a catalyst.
In summary, this market is in position for a retest of newly projected resistance levels which offers day trade opportunities on the long side in my opinion, no swing trades. If price establishes a lower high in the coming week, it is likely to retest the 5400 low and possible push into the higher 4ks before finding a more stable support to build a base upon. For those who short, 6350 and 6950 are the levels to watch. Other than that I am staying flat and waiting for the market to offer a more attractive reward/risk situation.
Comments and questions welcome.

NZDUSD 4HCalled this retracement last week, price came up to make a lower high, now forming a bearish flag pattern. A new lower low is on the cards to be completed soon :)

NZDUSD DAILYWe are in retracement mode right now with NZD, I am expecting a lower high & retrace to its downtrend line for the 3rd touch to enter short again to make a lower low..

ETHUSD Perspective And Levels: Middle Of Range?ETHUSD Update: Price retraces back to 294 while BTC continues to push highs. The fact that this market could not push the 315 high is concerning and I do not plan to add to my long position.
I am still long from 298.84 with my stop now adjusted to 286. At this point, in order f or me add to my position, price needs to show proof of strength. The 315 level is a tough range resistance and also a lower high formation which is not what I want to see when I am long. A break below 288 will confirm the 315 double top and a good level for me to be out of this trade. I think I gave it plenty of time to prove itself.
The 297 to 294 minor support (.618 of recent bullish swing) is holding price up at the moment, and in a more bullish environment, this would be a good place to go long or add upon a reversal signal. Since price is coming from a double top, I suspect this support is more likely to break. Keep in mind this market is consolidating and during these conditions, price can do more random things as compared to when price is trending. By adjusting my stop higher, I am lowering my risk on my small position while still giving the market some room to reverse back in my favor.
If I get completely stopped out at 286, I will not consider getting back in until this market starts moving big one way or the other. That means a bullish or bearish break of this consolidation will get my attention ONLY. From there I will reevaluate the potential for any swing trade longs. If the mid 280s is taken out, then the key level to watch is 270. If that breaks then the 250s become a strong possibility again (I wrote about this level in previous ETH reports).
Keep in mind I only trade these markets from one side and that is the long side. I understand many of the newer traders who seek action and adventure get anxious when I do not have any trades to talk about. If you are looking for broader movements in markets where reward/risk is decent and you are not trading anything else, consider the forex markets. There is a ton of activity there.
In summary, the price action in this market is not favorable for buying more at the current levels in my opinion (this may change if 310 is taken out). Not only is this market in a small range between the 273 low and the 310 area high, but it is right in the middle of a huge range (355 high and 136 low). In situations like this, swing trading is not the best strategy because of the overall lack of follow through like this market has been showing over and over. So it's either day trade, take small profits or position trade which is buy and hold small portions with very wide stops to avoid getting stopped out in the noise. In order for the market to be in play (meaning it is making progress in either direction and not gyrating) this range needs to be taken out. This is all about adjusting and being flexible. For those who are new to these markets, BTC was quiet for 2 years before it started making some real progress. I believe in the long term the break out will be to the upside, but until it starts showing more bullish signs, I am just going to sit tight and observe.
Comments and question welcome.
