XAGUSDLooking for silver to continue downward movement.
Created a nice evening star doji on the daily time frame with a big bearish engulfing.
Came back to entry and continued bearish movement.
I see silver creating a new low
Lowerhigh

USD/JPY SELL - 108.800 Potential Target AreaPotential SELL Position on USD/JPY - 108.800 Potential target

GBP/USD SELL- 1.30738 Potential Target AreaPotential SELL Position on GBP/USD- 1.30738 Potential target

BTC Update! Is weekly lower high set? Can bulls shift weekly?Ok, last chart we discussed the bulls getting above our zone we've had outlined for months on 4 hour chart but zooming out to bigger picture of the weekly chart. We were watching to see if the weekly just set another lower high and anything lower than $10,540 was just another lower high on our weekly chart. Bulls got to $9195 and are currently trending back down. Tentatively it does appear $9195 may be the lower high for weekly so nothing has changed bigger picture...yet. Bulls would now need a higher low compared to $6430 and then shoot for higher highs. Very manageable here. The 4 hour chart losing its EMA support is first sign I watched for to say this weekly is setting its lower high but the Daily chart (not pictured) is actually holding EMA support still. If daily loses EMA support it will confirm the lower high on weekly for myself. There is nothing wrong with a lower high on weekly and it is what was expected. Would ideally like to see bulls hold $8k to give a very comfortable higher low and then seek to push back up above $9200 and ideally towards $10k. Overall healthy consolidation thus far and no red flags for the bulls.
Just My 2 Sats!

GBPNZD SHORTPotential short for GBPNZD
Market was pushed up by news
We are still in overall downtrend I believe on the 4 hour time frame
TP 1 - 70 pips
TP 2 - 160 pips

XAUUSD SHORTSeries of lower higher being created
Daily time frame created a Morningstar for a pullback to continue down.
Take profit 1 = 78 pips
take profit 2 = 140 pips
take profit 3 = 200 pips


Is Namaste trading in a bull flag?Or possibly a descending triangle, only time will tell.
This recent move was likely an insider privy to information about a company N is invested in, "Choklat" receiving a processing licence. BUY the rumor & SELL the news, next week is the best time to exit this trade before there's even further capitulation to the 18c & 13.5c range.
In the grand scheme of things, this little rally is probably going to be another lower high, N is still down -87% since September where Andrew Left exposed this company for what it was, and still is, IMO, trash..
NShort

XRPUSD 1H BEST %R MOMENTUM STRATEGYStep #1: Define the Trend. An Downtrend is defined by a Series of LH Followed by a Series of LL.
The definition of an downtrend is pretty much standard. In an downtrend, we look for a series of lower highs followed by a series of lower lows. Two LH followed by at least another two LL is enough to define an downtrend.
A lower high is simply a swing low point that is lower than the previous swing high. While a lower low is simply a swing low that is lower than the previous swing low.
All momentum traders know that the trend is our friend. But without momentum behind the trend, we might actually not have any trend.
For active traders, we also look at the actual price action in order to gauge momentum. Besides reading the best momentum indicator.
Step #2: In an Downtrend Look for Bold Candlesticks that Close Near the Lower End of the Candlestick .
A technical analysis concept is that you want to use multiple confirmation signs when buying and selling. This will increase the likelihood that’s a high probability trading setup.
In this regard, the momentum trading strategy besides using the best momentum indicator, also incorporates the price action.
A practical way to read momentum from a price chart is to simply look at the candlestick length. What we want to see in an downtrend is big, bold bearish candlesticks that close near the lower end of the candlestick.
Now, it’s time to focus on the Williams %R. This is the best momentum indicator. Which brings us to the next step of our momentum indicator strategy.
Step #3: Wait for the best Momentum Indicator to get overbought (above -20). Then rallies below the -50 level before Selling .
We’re going to use Williams %R, the best momentum indicator in a smart way. In an downtrend, we sell after the best momentum indicator has reached overbought conditions (above -20). And then rallied back below the -50 level.
Now, we have confirmation from both the price and the best momentum indicator. The real momentum is behind this trend and the probabilities are in favor of more downside prices from here on.
Note* If the best momentum indicator continually stays in oversold territory (below -80 level), it signals a strong momentum and conversely a strong trend. Inversely the same is true in a uptrend.
The next important thing we need to establish is where to place our protective stop loss.
Step #4: Place Your Protective Stop Loss above the Recent Lower Low.
We want to hide our protective stop loss. It is above the most recent lower low level that formed right before the best momentum trading strategy issue the sell signal.
Alternatively, you can also trail your stop loss above each most recent lower low. This strategy will allow you to lock-in the potential profits in case of a sudden market reversal.
Last but not least the momentum indicator strategy also needs a place where we need to take profits, which brings us to the last step of the best momentum trading strategy.
Step #5: You pick your own TP strategy or
Take Profit once we break above the Previous Lower Low
A trend in motion can stay in that state longer than anyone can anticipate. And since we want to maximize our potential profits we let the market tips it hands before liquidating our trades. In this regard, we look for a break in the trend structure. Respectively a break above the most recent lower low.
Alternatively, you can take profit once the best momentum indicator breaks above the -50 level.
Note** The above was an example of a SELL trade using the Best Momentum Trading Strategy. Use the same rules for a BUY trade.

Bitcoin: Lower High Can Still Turn Into A Buy.Bitcoin has generated a fresh short term sell signal which can lead to a test of the 6800 low or lower. Since our strategy is long only, we simply step aside, BUT keep in mind just because a sell signal appears, it does not guarantee a new low or a test of some unreasonable target like 5K. Many investors and traders get wrapped up in fundamental arguments and other topical information that has very little relevance when it comes to the short term nature of order flow. In this article, I will highlight the technical points that we consider over the short term and what needs to align in order to justify a new swing trade. Charts reflect order flow which is much more reliable than news or fundamental opinions of others.
1. There is a BIG difference between swing trades (short term) and position trades (long term). We carry inventory, while we trade in and out of Bitcoin for short term gains. Any price test below the 7275 level emphasizes the attractiveness for accumulating more inventory (wholesale prices). This is NOT to be confused with our swing trade strategy.
2. Price has established a lower high off the 7850 level. This is a bearish structure, since lower highs typically lead to lower lows. IF price breaks below the 6800 support, the next high probability reversal area is 6550.
3. We will enter a new swing trade IF: price produces a reversal at or above 6800 (double bottom), OR if it tests 6550 followed by a pin bar or inside bar. Realistic profit potential for a reversal off of these levels is at least 1K points (test of 8500 or low 9Ks).
4. The big picture (14K high to 6800 low) can still be categorized as a corrective consolidation or a Wave 2 (in terms of Elliott Wave). From our perspective, this is NOT a compelling bearish trend. It is a correction of the broader BULLISH structure from 3150 to 14K. That means the risk is still greater on the short side (especially for swing trades).
5. IF Bitcoin finds support and reverses, it NEEDs to prove itself by taking out the 10,300 resistance. In this scenario, the broader Wave 3 is likely in progress. Until then, we will continue to evaluate short term price action within the scope of a range bound market.
6. The probability of the location still favors broad bullish reversals. Short term price action (candle sticks and momentum) may very well be conflicting, but they still carry less weight. For us this means we weight sell signals less and buy signals more.
I am not sharing this information to persuade anyone to follow our strategy. I share it to provide a sense of perspective, and a look at the variables and elements that we consider as part of our decision making process. There is no single way to trade or invest in a market, but there are a collection of best practices that can lead to better results over time. Technical and fundamental analysis are just a small part of a process that is ruled by psychology (your own vs. the market). That is what best practices are all about and what I hope to effectively share here.

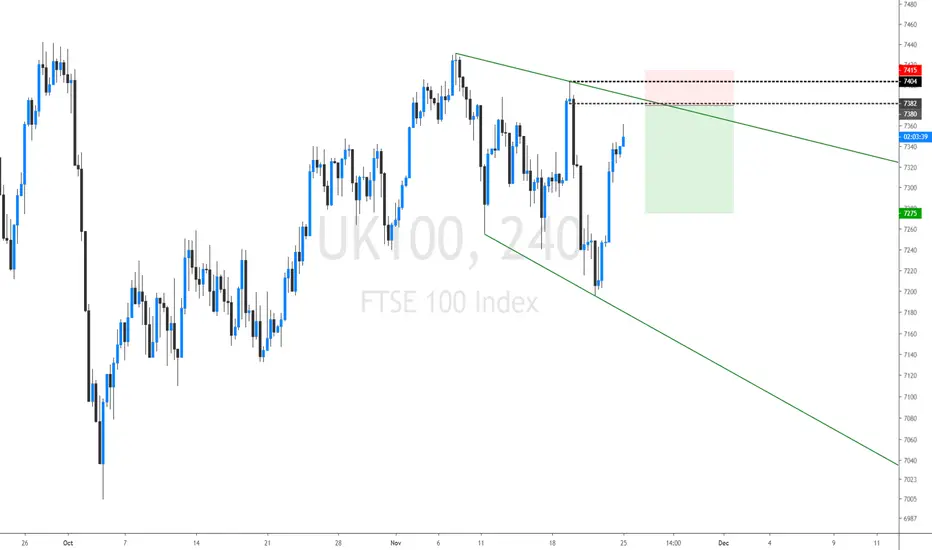
FTSE 100 - Possible sequence of lower highs.We look to Sell at 7380
Trading has been mixed and volatile.
The trend of lower highs is located at 7382.
Positive overnight flows lead to an expectation of a firm open this morning.
Preferred trade is to sell into rallies.
Expect trading to remain mixed and volatile.
Stop: 7415
Target 1:7275
Target 2: 7200
Drake started from the bottom, but not with Canopy?Or did he?
I mean, technically Drake could have been invested in Canopy for many years now, he's a very business savvy guy, not just rapper / icon. So who really knows what his average cost is.
Anyway, on a 3 month & 6 month chart we can clearly see lower high after lower high, and this recent move may become just that, another lower high... The rsi is very overextended & it looks like an inverse H&S already played out there... But on the actual chart, it appears as though a Inverse H&S may still be forming, only time will tell I guess.

EUR/GBP Technical analysisThe EUR/GBP pair is currently in a downtrend in the 4-H chart making lower lows and lower highs.
It is currently consolidating below the critical resistance 0.87940.
Hence we expect the pair to be bearish for the short term.

EUR/AUD Technical analysisThe counter is in a bearish mode making lower high and lower lows consistently.
A trendline can also be drawn connecting the lower highs of the counter.
Also, the counter broke a critical support level of 1.62556 with a strong candle.
Hence, we expect the pair to head down from here.

NZD/CAD Technical analysisThe counter is in a bearish mode making lower high and lower lows consistently.
A trendline can also be drawn connecting the lower highs of the counter.
Also, the counter broke a critical support zone which could act as resistance.
Hence, we expect the pair to be bearish further from here.

Higher lows & a H&S pattern?It's strange to see such volatility in Bitcoin, Dash & Ethereum while the publicly traded companies mining these assets are unchanged today.
Anyway, it appears as though Neptune Dash has been making higher lows on a macro level, see where I have the green flags. It's yet to be determined if this level will hold, but so far so good.
I have an umbrella to represent a cascading waterfall that's likely to happen if it doesn't form as a higher low.
Time will tell per usual.
D

Very low volume todaySPY volume was barely half of the daily average at close. That is VERY bad for the longs. On the e-mini: If a close below the recent pin bar happens then I believe a lower high would have been made, keeping my predictions alive. If futures dive, obviously SPY follows.

GBPCAD ShortDaily candle rejected as shooting star candle at lower high. Expecting one more push down, 1st target is 1.6050 then 1.6000 possibly a bit lower, after a pull back...
This is a weekly demand zone so after one more push down we could see a bounce from the low...

BTC Update! Continued battle between bulls and bears Bulls and bears have put on quite the battle for the last 2 weeks. Last chart we sat around $9550 and I was watching our large range of $9000-11,100. 6 days later and we continue to be well within this range. I was personally looking for some oversold bounce opportunities as well as a possible flush below $9k. We did see the sell off from mid $9000's down to $9108 with a very quick rebound of 6-7% within a couple hours. Positive of this is the bulls defended the prior low of $9,071 by $37 so essentially a double bottom. We now have support building with touches at $8919, 9071, and 9108. Our weekly candle remains an inside bar with bulls last weeks high of $10,688. Most importantly to me personally is $11,112. If bulls cannot break that and set a lower high here then we will be tightening up an equilibrium pattern. We have our higher low at $9108 and then would be the lower high (anything under $11,112) on the daily chart. This could cause continued extension of the range for a while longer.
Personally I did not play the oversold bounce as was not at a computer and move was just too quick for me to get to one and act. I did personally enter a small trade position around $9700 and was utilizing $9300 range as my stop loss (more clear on hourly chart). I have since raised my stop loss to $9800s to make it a profitable trade regardless. Another leg up today or this weekend would have me moving SL up towards 10.3k assuming the pullback to $10,321 yesterday can hold today.
Alts seem to continue to struggle greatly compared to BTC which really doesn't have me interested much in anything else at this time.
Just My 2 Sats!

Euro/Dollar BUYS - 1.12110 Potential Target AreaPotential Buy Position on Euro/Dollar - 1.12110 Potential Target Area

BTC Update! Another lower low! Another bad day for BTC and crypto in general. I personally got stopped out after refilling this most recent position. Minimal damage done since I was able to flip the trade yesterday I outlined in last post but I am now back to cash and more or less just playing a game of patience here. Bulls need to establish some form of support as there's not much support nearby. 4 hour chart is oversold but daily still has a ways to go. Our strongest support remains down at 7400-7700 range but continue to prefer we not revisit that area. We have had a lot of politicians involved in crypto talk the past few days revolving mostly around BTC and Libra coin from facebook. Crypto has been very shaky and seeing a lot of bearish posts lately so definitely keeping my eyes on new entries. Will clean up this chart today now that our last trade setup has failed as bulls were unable to reverse the trend by forming a higher low and instead sank to lower lows.
Just My 2 Sats!

BTC Update! Lower high playing out. Mnuchin Trade opportunity!We are playing out exactly as expected off of yesterdays chart. I had outlined our box of where I'd ideally put my "bearish glasses" on and begin shorting BTC if I were a bear. I was pretty confident we'd see a lower high form compared to $11,950 and the bulls would then need to defend the low of $9857 and form a higher low in order to begin having a chance at changing this trend. I had already entered positions in low $10k and was planning to seek entry of remainder once we pulled back after our anticipated lower high was set.
We got our lower high yesterday at $11,080 and have seen a 5% pullback overnight off that with our current pullback low at $10,512. Would be great if this held as our low of the pullback but anything above $9,857 will give us a higher low.
Mnuchin Trade:
Now I did change up my strategy yesterday and made a comment in yesterdays post as Mnuchin was speaking. Those not familiar, Mnuchin is the US Secretary of the Treasury. Now I was fortunate to be able to listen live to his comments as well as be at a computer which opened me up for an interest in taking on a short term trade for a quick flip. I have outlined that in the 5 minute chart above where it was a very quick flip for profit and then back to refilling positions once our expected lower high hit and we began to pullback. With Mnuchin speaking we had a known event as it was announced shortly before that he'd speak at 2pm eastern and BTC price began to drop down. To me this was just some exiting positions in anticipation that it could be negative news. Perfectly acceptable expectation in my opinion. I was preparing with both buys on negative news (buy the dip) or buying into a pump up if news was positive or just not very negative for a quick flip of a trade. We got the latter and at 2pm Mnuchin came out and overall I'd say it was neutral comments. Essentially investors need to use caution and be educated on what they are buying into and it is highly speculative asset class and those using for illegal purposes will be caught. Overall I think that's a very fair statement regarding crypto and bulls began to step in and buy. I was with them and then immediately began scaling out of my position as I was still expecting us to form a lower high within my range since the news was not something crazy bullish that would allow us to moon shot back up. This allowed for a quick 5% flip in under an hour for profit and then reset my buys for the anticipated pullback. This is an easy example of being prepared and recognizing the news event and that often leads to some nice volatility for easy trades. I have refilled majority of the position I sold in the trade already and will hold rest for a dip closer to $10,200's just in case and ideally help bulls defend support for our higher low. If we do not dip further then no big deal and will carry on with current position in hopes bulls reverse trend and get the higher high and begin stair stepping back up.
Just My 2 Sats!

Trade setup: GBP/AUD analysisprice has approached a key area of support around 1.7700 region which is in confluence with the key weekly trendline acting as support too, in addition, the price has extended into the lows to form a new lower low, could expect some form of retracement to the upward region of 1.8000
