The market is punishing weak altcoins!Over the past three months, BCHAUD, LRCUSD, ADAUSD, SANUSD, and XTZUSD have been among the weakest cryptocurrencies in their group. Their decline is driven not by a single factor, but by a combination of market fear, declining interest in older altcoins, and specific issues within the projects themselves. Even positive news such as network upgrades or new product launches has so far failed to restore investor confidence.
Decline factors:
BCHAUD: the upgrade failed to trigger a recovery
Lrcusd
#LRC/USDT Ready to go up#LRC
The price is moving within a descending channel on the hourly timeframe. It has reached the lower boundary and is trending towards a bounce. A retest of this boundary is expected.
The Relative Strength Index (RSI) indicates a downward trend, and this trend is likely to continue due to the overbought condition.
There is a key support zone in green at 0.02915, and the price has bounced off this zone several times, making it a strong support level.
The price is trending towards the 100-per
LLong
#LRC/USDT Ready to go up#LRC
The price is moving in a descending channel on the 1-hour timeframe. It has reached the lower boundary and is heading towards breaking above it, with a retest of the upper boundary expected.
We have a downtrend on the RSI indicator, which has reached near the lower boundary, and an upward rebound is expected.
There is a key support zone in green at 0.0514. The price has bounced from this level multiple times and is expected to bounce again.
We have a trend towards stability above the 10
LLong
LRC Buy/Long Signal (4H)We have a liquidity pool on the chart that, if swept, could allow the price to rebound strongly upwards. There are two lows, with buyer stop-losses placed just below them.
We have two entry points, which can be entered using a DCA (Dollar-Cost Averaging) approach.
Targets are marked on the chart.
If you would like us to analyze a coin or altcoin for you, first like this post, then comment the name of your altcoin below.
LLong
Keep Your Eyes on LRC (Short with tight stop or Long at BO)Attention traders! It's time to buckle up, because LRC is facing some serious rejection at a major resistance level on the 4-hour timeframe. But don't be intimidated by this wall of resistance, because we're not backing down. We're going to wait for the breakout before opening any long positions, or you can even consider shorting with a tight stop loss above this resistance. Remember, guys, risk management is key to success in the markets, so keep your cool and stay focused. Get ready for some w
L
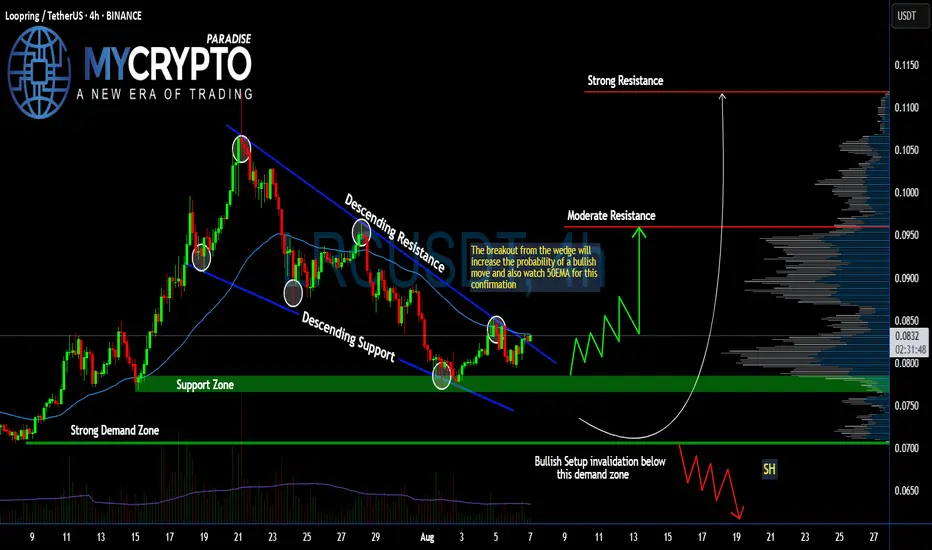
#LRC Ready for a Massive Recovery From Here | Must Watch Yello, Paradisers! Is #LRCUSDT finally ready for a breakout, or is it just another trap for early bulls? Let's break down the current structure of #LRC.
💎#Loopring ( CAPITALCOM:LRC ) has been moving within a descending wedge pattern for weeks, with price consistently making lower highs and lower lows—clearly respecting both descending resistance and support levels. However, we are now starting to see signs of change as it retests the upper trendline.
💎A breakout above the descending resistance
LLong
LRC/USDT 1W – Final Test Before a Major Reversal?> Loopring (LRC) is currently sitting at a critical long-term support zone, and the next few weeks could determine whether a strong reversal or deeper decline will follow.
---
🧠 Macro Overview:
After falling more than 97% from its all-time high (ATH) of $3.0596, LRC is now revisiting a historical demand zone between $0.0657–$0.0821. This area has acted as a powerful launchpad during previous cycles and remains a major accumulation zone.
---
🔎 Technical Structure & Price Action:
✅ Historica
LLong
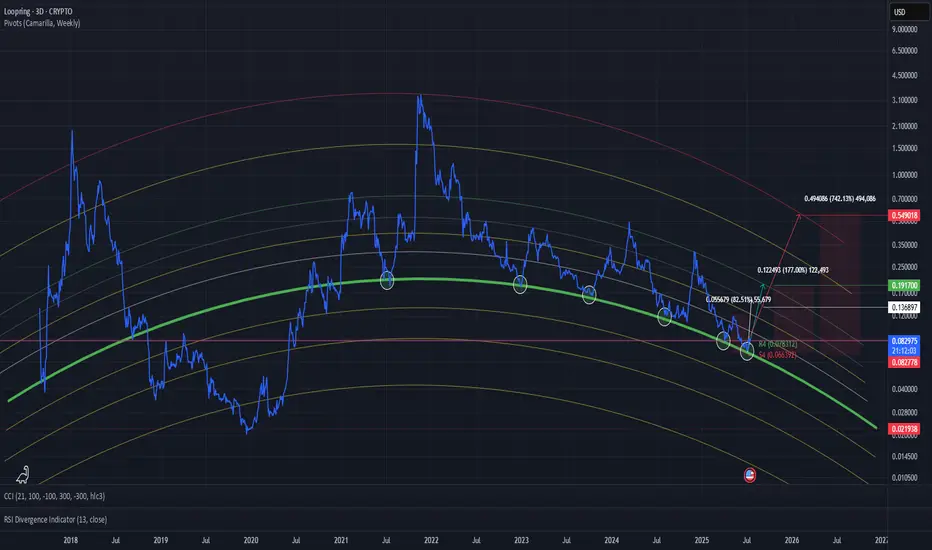
LRC/USDTI’m not sure if there’s a specific method of analysis for this, but it’s clear how precisely the coin reacts to these levels.
That’s why I dare to assume we won’t go any lower.
The green line has consistently acted as a strong support — almost like a trampoline that price bounces off.
All realistic and objective targets are already marked on the chart.
Additionally, the weekly Camarilla Pivot is showing significant strength right now, which adds further bullish confluence.
LRCUSDT 1WLRC ~ 1W Analysis
#LRC This is the lowest support at this time, maybe you can consider starting to buy back from here with a short -term target of at least 15%+
LLong
LRCUSDT 1WLRC ~ 1W Analysis
#LRC If you still have a Conviction on this coin. Maybe you can consider this support to start buying back from here with a minimum target of 20%+.
LLong
LRCUSDT 1WLRC ~ 1W
#LRC If you still have Conviction on this coin,. Don't miss this trade, Buy and take profit of at least 20%+
LLong
LRCUSDT 1WLRC ~ 1W
#LRC If you still have Conviction on this coin,. This support block will be a very good buying spot for now, Buy it gradually with a target of at least 20%++
LLong
Loopring completed very sneaky right shoulder just b4 goldencrssLoopring snuck in this extremely small right shoulder and price action has now retested the neckline as support right before Oo prints golden cross is set to occur. I’m guessing the breakout up from the inverseheadandshoulders is validated very close to when the cross occurs. *not financial advice*
L
LRC is Setting Up BIG!Loopring (LRC) is presenting an excellent opportunity with a confluence of technical factors aligning at the old high demand zone. This area holds significant importance as it combines the strength of a multi-tap demand zone with a Fibonacci retracement level, enhancing its reliability for a potential bounce.
Why the Old High Demand Zone is Key
3-Tap Test:
The price has tapped into this demand zone multiple times, signaling its strength as a support level. Each tap reinforces the zone, indicati
LLong
#LRC/USDT Ready to go up#LRC
The price is moving in a descending channel on a 1-day frame and sticking to it well
We have a bounce from the lower limit of the descending channel, this support is at 0.2112
We have a downtrend on the RSI indicator that is about to be broken, which supports the rise
We have a trend to stabilize above the moving average 100
Entry price 0.2150
First target 0.2258
Second target 0.2331
Third target 0.2427
LLong
LRCUSDT 1WLRC ~ 1W
#LRC If you still have Conviction on this coin. buy in stages from here. With a minimum target of 20%+. It is only a matter of time until this resistance line is broken. and bullish will dominate
LLong
LRC looks bullishThe LRC appears to have completed a correction that was ABC and wave C was a terminal.
We are looking for buy/long positions on the green range
The target is the red box on the chart.
Closing a daily candle below the invalidation level will violate this analysis
For risk management, please don't forget stop loss and capital management
Comment if you have any questions
Thank You
L
LRCUSD LoopRing... Ring.. Ring. Hello? Like a phone, lol get it?
Okay, enough fun, time for the serious stuff.
Loopring is at support area, where things are flipping in the bullish direction
I don't know the exact point it moves, but I know .1 was an area of support on a past chart.
Take this move and probably compress the line, which isn't as accurate and more a guide to show the idea of a potential trend move to the upside.
Okay, here is help from AI
Here's an analysis based on the chart provided:
### Overview:
- **Asset:** Loopr
LLong
LRC buy/long setup (4H)From where we placed the green arrow on the chart, we have a bullish pattern on the chart.
This pattern is diametric or triangular. In both scenarios, the price can move from the green range to the red box.
The targets are marked on the chart.
Closing a daily candle below the invalidation level will violate the analysis.
For risk management, please don't forget stop loss and capital management
When we reach the first target, save some profit and then change the stop to entry
Comment if you h
L
LRC/USD Local trend. Wedge. Capitulation zone 17 08 2024Logarithm. Time frame 3 days (no less).
The price is in the capitulation zone in a local descending wedge, after breaking the long-term horizontal channel. The percentages are shown from the key zones for clarity.
Linear without market noise.
Main trend (most of the price chart history).
LLong
LRC/USDT Main Trend 08/17/2024Main trend (the most visible part). Logarithm. Time frame 1 week. Loopring is an open protocol for building decentralized exchanges.
The price is in the capitulation zone in a local descending wedge, after breaking the long-term horizontal channel. The percentages are shown from the key zones for clarity.
The chart also shows the dynamic support/resistance zones of the Gann fan (bullish and bearish).
It is worth noting that the price is at a significant profit of crypto funds 4-26X, but most
LLong
LRC LOOKS BULLISHThis analysis is an update of the analysis that you can see at the bottom of this page, in the related analysis section
LRC Diametric seems to be complete. By maintaining the green range, it can move towards the targets.
Closing a candle below the invalidation level will violate the analysis
For risk management, please don't forget stop loss and capital management
When we reach the first target, save some profit and then change the stop to entry
Comment if you have any questions
Thank You
L
The last bullish chance of LRC in Mid term!Hi.
COINEX:LRCUSDT
😊Today, I want to analyze LRC for you in a WEEKLY time frame so that we can have a Mid-term view of LRC regarding the technical analysis. (Please ✌️respectfully✌️share if you have a different opinion from me or other analysts).
➡️As you can see, LRC is completed this pattern, and if it follows this pattern Price can grow a lot.
✅ Due to the Ascending structure of the chart...
- High potential areas are clear in the chart.
-LRC has been Bullish Recently!
-The odds of an
LLong
#LRCUSDT LONG#LRC
Finally, we reached the upper limit of the downward channel
Since May 2023
At the same time, we are close to breaking the EMA 100
We have a large reversal pattern and the price looks set to break it
The price is expected to trade in an upward wave with price corrections
Current price 0.3310.
The first target is 0.4805.
The second target is 0.6294.
LLong