LTCUSD ❕ above the liquidityTrading volumes indicate interest in price growth.
The price broke through up 200EMA (4H TF)
On the 1H Timeframe, 50EMA and 200EMA formed a "golden cross" pattern.
TD Sequential formed a reversal signal downwards (30m TF)
I expect that the price can continue rising when the LTC will fix above the support level after the test.
LTCUSD

LTC important zone🎅🎅As you can see i have two scenario on my LTC chart.
I'm preparing myself to open position on the first scenario,what's your opinion?
Comment down below

LTC : TA Movement.Low time frame showing some movements depending on some trend patterns.
The question is if this can confirm the coming time, for that reason interesting to see if it can get confirmation or not.
The markets still have not much movement since BTC is stable.

$LTC | Long PositionIf you see some bullish breaker on 1H or below, you may think to open a long position

ETHUSD and LTCUSD Technical Analysis – 22nd DEC, 2022ETHUSD: Bullish Harami Pattern Above $1152
Ethereum was unable to sustain its bearish momentum and after touching a low of 1152 on 20th Dec, the price started to correct upwards against the US dollar crossing the $1200 handle today in the European trading session.
We have seen a bullish opening of the markets this week.
We can clearly see a bullish harami pattern above the $1152 handle which is a bullish pattern and signifies the end of a bearish phase and the start of a bullish phase in the markets.
ETH is now trading just above its pivot level of 1217 and moving into a mildly bullish channel. The price of ETHUSD is now testing its classic resistance level of 1221 and Fibonacci resistance level of 1224 after which the path towards 1300 will get cleared.
The relative strength index is at 59 indicating a strong demand for Ether and the continuation of the bullish phase in the markets.
We can see the formation of bullish engulfing lines in the 4-hour time frame.
Both the STOCHRSI and Williams percent range are indicating an overbought market, which means that the prices are expected to decline in the short-term range.
Most of the technical indicators are giving a BUY market signal.
Most of the moving averages are giving a BUY signal and we are now looking at the levels of $1350 to $1400 in the short-term range.
ETH is now trading above its 100 & 200 hourly simple and exponential moving averages.
Ether: bullish reversal seen above the $1152 mark
Short-term range appears to be mildly bullish
ETH continues to remain above the $1200 level
The average true range is indicating LESS market volatility
Ether: Bullish Reversal Seen Above $1152
ETHUSD is now moving into a mildly bullish channel with the price trading above the $1200 handle in the European trading session today.
ETH touched an intraday low of 1209 in the Asian trading session and an intraday high of 1220 in the European trading session today.
We can see that the price is back over the pivot point in the 4-hour time frame.
The parabolic SAR indicator is giving a bullish reversal signal in the 2-hour time frame.
The Ichimoku price is over the cloud in the 2-hour time frame indicating a bullish tone of the markets.
The price of Ethereum is marching towards a bullish zone against the US dollar and bitcoin. ETH/USD could continue to move higher back towards the $1400 level.
The daily RSI is printing at 47 indicating a NEUTRAL demand for Ether in the medium-term range.
The key support levels to watch are $1184 which is a 3-10 day MACD oscillator stalls, and $1191 which is a 14-3 day raw stochastic at 20%.
ETH has increased by 0.20% with a price change of 2.43$ in the past 24hrs and has a trading volume of 37.617 billion USD.
We can see a decrease of 29.77% in the total trading volume in the last 24 hrs which appears to be normal.
The Week Ahead
ETH’s price continues to remain in a bullish zone against the US dollar and bitcoin. ETHUSD is expected to move higher towards the $1300 and $1400 levels this week.
On the upside we are now looking at the immediate targets of 1303 which is a 38.2% retracement from a 13-week low, and 1372 which is a 50% retracement from 13-week high/low.
The immediate short-term outlook for Ether has turned mildly bullish, the medium-term outlook has turned neutral, and the long-term outlook for Ether is neutral in present market conditions.
The price of ETHUSD will need to remain above the important support level of $1172 at which the price crosses 18-day moving average stalls.
The weekly outlook is projected at $1450 with a consolidation zone of $1350.
Technical Indicators:
The average directional index, ADX (14): is at 33.73 indicating a BUY
The rate of price change: is at 0.694 indicating a BUY
Bull/bear power (13): is at 9.48 indicating a BUY
High/lows (14): is at 2.49 indicating a BUY
LTCUSD: Bullish Engulfing Pattern Above $61.07
Litecoin was unable to sustain its bearish momentum last week and after touching a low of $61.07 on 19th Dec, the price started to correct upwards against the US dollar crossing the $66 handle today in the European trading session.
We can see that the price is back over the pivot point in the daily time frame indicating a bullish tone of the markets.
We can clearly see a bullish engulfing pattern above the $61.07 handle which is a bullish pattern and signifies the end of a bearish phase and the start of a bullish phase in the markets.
Litecoin is now trading above its 100 hourly simple moving average and below its 200 hourly exponential moving average. The price of LTCUSD is just above its pivot level of 66.18.
The relative strength index is at 61.91 indicating a STRONG demand for Litecoin and the continuation of the bullish phase in the markets.
We can see that the Williams percent range indicator is back over -50 indicating a bullish trend in the 15-minute time frame.
Litecoin touched an intraday low of $65.23 in the Asian trading session and an intraday high of $66.60 in the European trading session today.
The price of Litecoin continues to remain above most of the moving averages, which are now giving a STRONG BUY signal at current market levels of 66.28.
The STOCHRSI is indicating an overbought level, which means that the price is expected to correct downwards in the short-term range.
The short-term outlook for Litecoin has turned mildly bullish.
Most of the technical indicators are giving a BUY signal
Litecoin: bullish reversal seen above the $66.30 level
The commodity channel index is indicating a neutral level
The average true range is indicating LESS market volatility
Litecoin: Bullish Reversal Seen Above $61.07
We can see that the price of Litecoin continues to gain traction against the US dollar and bitcoin. We are now looking to touch the $70 level.
The super trend indicator is giving a bullish reversal signal in the 4-hour time frame.
We can see the formation of bullish engulfing lines in the daily time frame.
The Ichimoku price is over the cloud in the 2-hour time frame indicating a bullish trend.
The resistance of the channel is broken in the 15-minute time frame.
The price of LTCUSD is now facing its classic resistance level of 66.33 and Fibonacci resistance level of 66.52 after which the path towards $70 will get cleared.
The daily RSI is printing at 41.35 which is indicating a weak demand for Litecoin and the shift towards the consolidation phase in the short-term range.
LTCUSD has increased by 1.45% with a price change of 0.9506$ in the past 24hrs and has a trading volume of 0.314 billion USD.
Litecoin’s trading volume has increased by 28.66% compared to yesterday which appears to be normal.
The Week Ahead
The price of Litecoin remains supported at lower levels and now we are looking to gain strength above the $70 handle.
We can see the resumption of the long term bullish trend with the support located at $61.91 which is a 38.2% retracement from a 13-week low.
The price of Litecoin needs to remain above the important support level of $65.69 which is a 14-3 day raw stochastic at 20%
The short-term outlook for Litecoin has turned mildly bullish, the medium-term outlook is bullish, and the long-term outlook is neutral at present market conditions.
The weekly outlook is projected at $75 with a consolidation zone of $70.
Technical Indicators:
The MACD (12, 26): is at 0.219 indicating a BUY
The average directional index (14): is at 30.67 indicating a BUY
Bull/bear power (13): is at 0.684 indicating a BUY
The rate of price change: is at 10.52 indicating a BUY
Disclaimer: This forecast represents FXOpen Companies opinion only, it should not be construed as an offer, invitation or recommendation in respect to FXOpen Companies products and services or as financial advice.

✅TS ❕ LTCUSD: bounced up✅✅ LTC bounced up.
The main trend is downward.
Correction is expected.✅
🚀 BUY scenario : long to 71.🚀
----------------------------------------------------------------------------
Remember, there is no place for luck in trading - only strategy!
Thanks for the likes and comments

Litecoin- New leg up coming?Litcoin was one of the coins that I really liked recently and, indeed, LtcUsd has had a nice run from 50s November's low.
Now the coin corrected the recent leg up and is trading in a very strong resistance zone that lies between 60 and 65.
As long as this zone is intact there is a high probability for a new leg up and Litecoin could rise to test 90-93 zone resistance.
Buy dips could be a good strategy for this coin that also has an R:R of 1:3

LTCUSD ABC correction nearing completion?after 5 waves up we are seeing a massive ABC (variation of) correction and completing the 5 waves of C imho
IF this count is correct, and BTC tumbles to new lows (or at least test previous lows) i think its fair to say we will see market wide corrections
Some Key Levels of Significance:
-$48.88
-$40.27
-$29.52
-$22.83
in particular if this current structure is a true bear flag, i will be most interested in a buy at the ~$30.00 level
not financial advice, just thoughts and notes for me to compare in the future.

Litecoin LTC Price Prediction for DecemberLitecoin LTC is bearish ahead of the release of new economic data on December 13, the Consumer Price Index:
LTC/USDT short
Entry Range: $75 - 78
Price Target 1: $70
Price Target 2: $64
Price Target 3: $57
Stop Loss: $85

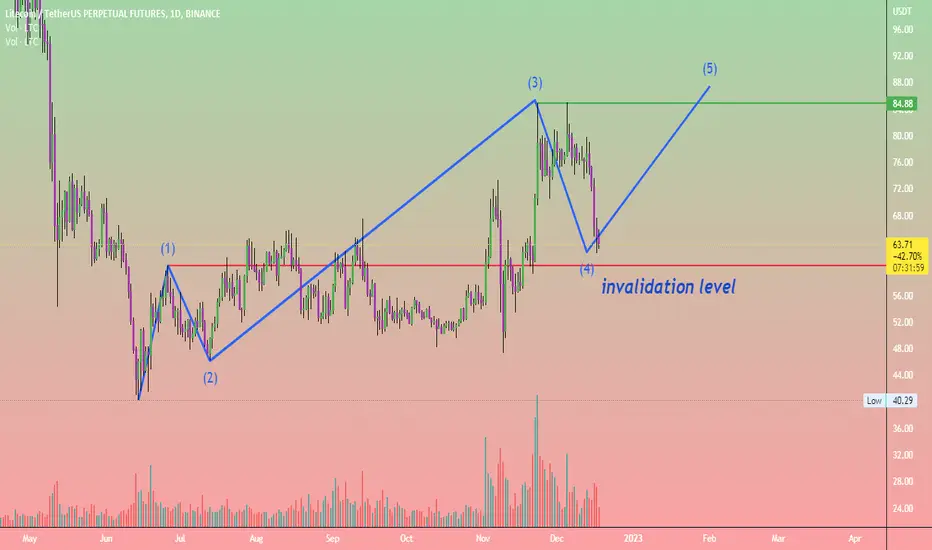
Litecoin, 1hOur priority scenario in Litecoin is the growth in a small wave (3) to the range of 68.50-72.76. These are important levels for LTC and we believe that these are only the first upside targets. If the price of LTC falls below 61.21, the upward scenario will be canceled, we’ll revise our markup.

LTCUSD ❕ above the liquidityTrading volumes declined.
Litecoin continues to trade above liquidity.
Price and RSI have formed a bullish divergence (4H TF)
I expect the price to rise after overcoming the resistance level.

LTCUSD '2D' - Short now or wait a day or two?Litecoin is looking like it's currently floating above the ranging market where it's ultimately going to end up. The question is when.. Do we place a short trade now with our Crypto Tipster v2 signal or do we wait a couple of days when the price (might) hit the top edge of the descending triangle?
The choice ultimately is up to you, either way you're going to be looking at a good 10-20% short over a week or two.

LTC SHORT AND LONG SETUPHello, dear traders. how are you ? Today we have a setup to SELL/SHORT and buy/long the LTC symbol.
For risk management, please don't forget stop loss and capital management
When we reach the first target, save some profit and then change the stop to entry
Comment if you have any questions
Thank You

LTC move down to $52 then upLTC is working on a similar pattern from a previous down cycle and it'll be interesting to see how this plays out.
With the end of the year coming up and the fed sticking with a 0.5 increase, I would anticipate continued downward pressure along with some holders looking to sell for tax purposes and get back in the game in early 2023.
not trading advice
tg

LTC Litecoin bullflag 100 USD ?Above is my analysis on LTC or Litecoin
Crypto market has been downward trending except for this coin Litecoin it has been showing strength this is because the Litecoin Halvening is coming in end July 2023 which is just 7 months from today.
LTC has been forming a clear bull flag which the target of the pole leads to prices above 100 usd
there is also a 0.382 fib bounce off the move from 48 usd to 85 usd therefore the bulls are showing strength for this coin and ofcourse people will buy ltc in anticipation of the halvening pump cus in 2018 the dec to 2019 june pump for ltc was 6x or 600%

ETHUSD and LTCUSD Technical Analysis – 15th DEC, 2022ETHUSD: Three White Soldiers Pattern Above $1222
Ethereum was unable to sustain its bearish momentum and after touching a low of 1222 on 08th Dec, the price started to correct upwards against the US dollar moving into a consolidation channel above the $1250 handle today in the European trading session.
We can see the formation of a bullish doji star pattern in the 1-hour time frame indicating bullish trends.
The commodity channel index indicator is giving a bullish divergence signal in the 1-hour time frame.
We can clearly see a three white soldiers pattern above the $1222 handle which is a bullish pattern and signifies the end of a bearish phase and the start of a bullish phase in the markets.
ETH is now trading just above its pivot level of 1286 and is moving into a consolidation channel. The price of ETHUSD is now testing its classic resistance level of 1287 and Fibonacci resistance level of 1288 after which the path towards 1300 will get cleared.
The relative strength index is at 48 indicating a NEUTRAL demand for Ether and the continuation of the consolidation phase in the markets.
The resistance of the channel is broken on the daily time frame.
The STOCHRSI is indicating an OVERBOUGHT level, which means that the prices are expected to decline in the short-term range.
Some of the technical indicators are giving a BUY market signal.
Most of the moving averages are giving a NEUTRAL signal due to the market consolidation seen below the $1300 handle.
ETH is now trading below both the 100 hourly simple and 200 hourly exponential moving averages.
Ether: bullish reversal seen above the $1222 mark
The short-term range appears to be mildly bullish
ETH continues to remain above the $1250 level
The average true range is indicating LESS market volatility
Ether: Bullish Reversal Seen Above $1222
ETHUSD is now moving into a consolidation/correction channel with the price trading below the $1300 handle in the European trading session today.
The prices of Ethereum are ranging near the support of the channel indicating bullish trends.
The MACD indicator is now giving a bullish divergence signal in the 30-minute time frame.
The price of Ethereum broke the $1300 level and then we can see some decline due to short selling of Ether which caused the dip below the $1300 level.
ETHUSD touched an intraday high of 1314 and an intraday low of 1281 in the Asian trading session today.
We have seen a bullish opening in the markets this week.
The daily RSI is printing at 51 indicating a neutral demand for Ether in the long-term range.
The key support levels to watch are $1210 which is a 14-3 day raw stochastic at 30%, and $1244 which is a 38.2% retracement from 4 Week High.
ETH has decreased by 2.50% with a price change of 33.04$ in the past 24hrs and has a trading volume of 8.409 billion USD.
We can see an increase of 0.58% in the total trading volume in the last 24 hrs which appears to be normal.
The Week Ahead
The price of ETH has now entered into a consolidation/correction zone, and after this we are expecting fresh upside waves crossing the $1300 and $1400 levels.
ETHUSD continues to gain bullish traction from a weekly time frame from a 4-hour time frame with the bottom support located at $1075 touched on 22nd Nov.
The immediate short-term outlook for Ether has turned mildly bullish, the medium-term outlook has turned neutral, and the long-term outlook for Ether is neutral in present market conditions.
The price of ETHUSD will need to remain above the important support level of $1243 at which the price crosses the 18-day moving average.
The resistance zone is located at $1291 at which the price crosses 9-day moving average stalls.
The weekly outlook is projected at $1350 with a consolidation zone of $1300.
Technical Indicators:
The Williams percent range: is at -24.78 indicating a BUY
The commodity channel index (14): is at 62.01 indicating a BUY
High/Lows (14): is at 0.3436 indicating a BUY
Bull/Bear power (13): is at 0.6240 indicating a BUY
LTCUSD: Triple Bottom Pattern Above $73.50
Litecoin was unable to sustain its bearish momentum last week and after touching a low of $73.50 on 12th Dec, the price started to move upwards against the US dollar touching a high of $79.79 on 13th Dec.
The price of Litecoin has corrected lower below the $75 handle due to short selling, but a rebound in the price is expected after the consolidation wave gets over.
We can clearly see a triple bottom pattern above the $73.50 handle which is a bullish pattern and signifies the end of a bearish phase and the start of a bullish phase in the markets.
Litecoin is now trading above its 100 hourly simple moving average and below its 200 hourly simple moving average. The price of LTCUSD is just below its pivot level of 75.86
The relative strength index is at 50.32 indicating a NEUTRAL demand for Litecoin and the shift towards the consolidation phase in the markets.
The momentum indicator is back over zero in the 30-minute time frame indicating bullish trends.
Litecoin touched an intraday high of $75.91 and an intraday low of $73.56 in the Asian trading session today.
The price of Litecoin continues to remain above some of the moving averages, which are now giving a BUY signal at current market levels of 74.80.
The RSI is indicating a neutral level, which means that the price is expected to move towards the consolidation phase in the short-term range.
The short-term outlook for Litecoin has turned mildly bullish.
Some of the technical indicators are giving a buy signal
Litecoin: bullish reversal seen above the $73.50 levels
The commodity channel index is giving a NEUTRAL signal
The average true range is indicating LESS market volatility
Litecoin: Bullish Reversal Seen Above $73.50
The price of Litecoin is now moving in a correction phase below the $75 handle. After this wave gets over, we can see fresh upsides towards the $80 level.
The relative strength index indicator is back over 50 in the 15-minute time frame indicating bullish trends.
The RSI Indicator is also giving a bullish divergence signal in the 1-hour time frame.
The price of LTCUSD is now facing its classic resistance level of 74.83 and Fibonacci resistance level of 74.85 after which the path towards $80 will get cleared.
Litecoin is now facing its resistance zone at $77.32 at which the price crosses 9-day moving average stalls and at $80.03 which is a 14-3 day raw stochastic at 50%.
The daily RSI is printing at 52.38 which is indicating a neutral demand for Litecoin and the continuation of the consolidation wave in the medium-term range.
LTCUSD has decreased by 4.35% with a price change of 3.41$ in the past 24hrs and has a trading volume of 0.619 billion USD.
Litecoin’s trading volume has increased by 11.29% compared to yesterday which appears to be normal.
The Week Ahead
The price of Litecoin is moving in a zigzag pattern with the price remaining above the long-term monthly support located at $70.37 which is a 38.2% retracement from 13-week high.
We are expecting more upsides towards the $75 and $80 levels, after the current downside wave gets exhausted.
Some of the technical indicators are also giving a neutral stance.
The price of Litecoin needs to remain above the important support level of $73.54 which is a 3-10 day MACD oscillator stalls.
The short-term outlook for Litecoin has turned mildly bullish, the medium-term outlook is neutral, and the long-term outlook is neutral at present market conditions.
The weekly outlook is projected at $80 with a consolidation zone of $75.
Technical Indicators:
The average directional index (14): is at 22.50 indicating a BUY
The ultimate oscillator: is at 57.55 indicating a BUY
The rate of price change: is at 0.094 indicating a BUYThe commodity channel index (14): is at -31.10 indicating a NEUTRAL
Disclaimer: This forecast represents FXOpen Companies opinion only, it should not be construed as an offer, invitation or recommendation in respect to FXOpen Companies products and services or as financial advice.

LTCUSD ❕ trading in rangeTD Sequential has formed a reversal signal down (4H TF)
The RSI chart on the 30m Timeframe signals an upcoming correction.
I expect the asset to begin a correction if it holds in the range.

#LTC/USDT 1DAY UPDATE BY @CRYPTOSANDERS !!Welcome to this quick LTC/USDT analysis.
I have tried my best to bring the best possible outcome in this chart.
Reason for Analysis:-Litecoin (LTC) also rose in today’s session, with the token rebounding from its losses to start the week.
Following a drop to $73.52, which was the lowest level LTC/USD had hit since November 29, the token raced to a high of $79.52 earlier today.
This surge in price sent litecoin to its strongest point since December 7, which is the last time price was above $80.00.
Looking at the chart, today’s bullish momentum comes as the RSI bounced from a floor of 55.50, and it is now nearing a ceiling of 61.50.
This move has also sent the 10-day (red) moving average higher, a day after it appeared to be certainly heading for a downward trend.
What happens on Wednesday with the U.S. Federal Reserve will now dictate how cryptocurrency prices will move during the run-up to the Christmas period.
Remember:-This is not a piece of financial advice. All investment made by me is at my own risk and I am held responsible for my own profit and losses. So, do your own research before investing in this trade.
Hit the like button if you like it and share your charts in the comments section.
Thank you...

LTC Perp Currently trading in ranges we saw the rejection from support downside there is a possible bos and will form LL or atleast to touch the 50%(Mid Range).
Targets every thing is in the chart.Do accordingly.
NFA.
DYOR.

Litecoin at critical areaWhen LTC crosses this bullish area and closes above (1D candle), I think it will fly.

LTC- Long on 4HHi,
I've entered LONG on the LTC/USD pair. It looks like a clear cut rejection from support and now were starting to see a breakthrough past the previous high from last week.
Target 1 remains at the high from the start of the month with the local high close being $83. From there we target the daily resistance at $94. If we see any sign of rejection before hitting Target 1, the stop loss will be set at $73.
Good luck if you join

FRACTAL: LTC Litecoin LOVES Decembers ⬆Hi Traders, Investors and Speculators 📈📉
Ev here. Been trading crypto since 2017 and later got into stocks. I have 3 board exams on financial markets and studied economics from a top tier university for a year. Daytime job - Math Teacher. 👩🏫
Historically, December is a bullish month for Litecoin, with the price often going parabolic and increasing more than 100 % ! Previously, 4 out of 5 Decembers, the price of LTCUSDT has increased exponentially. A quick look at a fractal that played out during 2020 from this exact support zone that we are currently trading on ($68) shows a whopping 168% increase.
While you're here 👀 Here's a guide to risk reward ratios and how to setup the perfect position :
_______________________
📢Follow us here on TradingView for daily updates and trade ideas on crypto , stocks and commodities 💎Hit like & Follow 👍
We thank you for your support !
CryptoCheck
