LUNC Approaches Key Support — Breakout or Breakdown?💵 Coin: CRYPTOCAP:LUNC / USDT
⏳ Time Frame: 2D
📍 Current Price: around 0.00005424
📉 Main Structure: Descending Trendline
🟨 Support / Demand Zone: 0.0000475 – 0.0000440
The LUNC/USDT chart currently shows price trading below a Descending Trendline, formed by a series of lower highs since the peak around the 0.00010–0.00012 area.
Price is now approaching the intersection between the Descending Trendline and the 0.0000475–0.0000440 support zone, making this area important for determining the ne
LUNCUSD
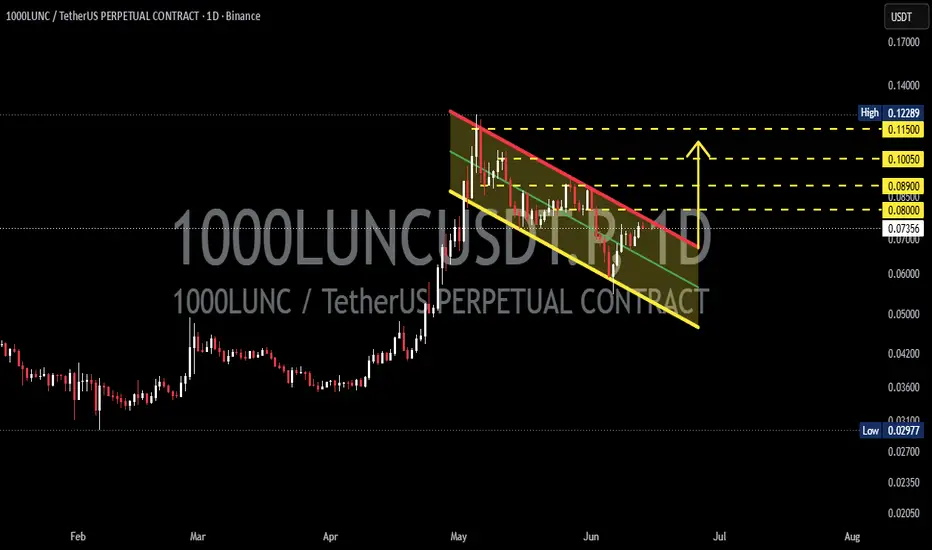
LUNC/USDT – Bullish Flag, Ready for a Higher Move?On the daily (1D) chart, 1000LUNC/USDT appears to be forming a Bullish Flag Pattern 🏳️📈, one of the most popular bullish continuation patterns that typically develops after a strong upward impulse.
Price previously experienced an aggressive rally from around 0.04500 to a peak near 0.12289 🚀, followed by a healthy correction phase that formed a descending channel (flag) characterized by a series of lower highs and lower lows.
At the moment, price is trading near the upper boundary of the patter
LUNC Order Flow: Why the 1H Rally is a TrapChasing LUNC after a vertical 10% rip into premium resistance is mathematical suicide. The timeline is aggressively bidding the v4.0.1 network upgrade and the recent 923 million Binance token burn, assuming this is the start of a macro reversal.
If you are buying here, you are trading the narrative, not the liquidity. You are providing exit liquidity to algorithmic sellers.
Here is the verifiable on-chain reality and the 1H microstructural data proving why this rally is exhausted, and exactl
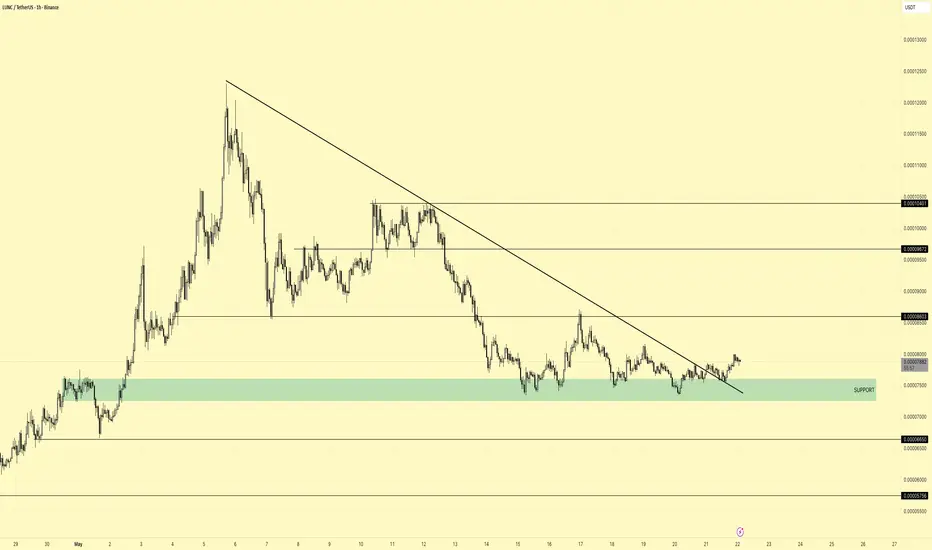
LUNCUSDTLUNC/USDT 1H Analysis
LUNC has been respecting a long-term descending trendline for an extended period, but price is now starting to push above that structure while holding a key support zone around 0.000073–0.000075.
The highlighted support area has reacted multiple times, showing clear buyer interest whenever price revisits the zone. At the same time, the recent move above the descending trendline suggests weakening bearish momentum in the short term.
If price can maintain acceptance above
LUNC Analysis (4H)LUNC has moved sharply and without any correction toward the strongest supply zones and has absorbed a large amount of liquidity. Moves like this are not trends; they are impulsive pushes meant only to sweep liquidity.
In my view, sufficient liquidity has now been collected, and the market should enter a phase of price and time correction, gradually and calmly moving toward lower levels while forming a time-based correction.
The supply zones and targets are marked on the chart.
A daily candle
LUNC Showing Classic Three-Drive StructureHi!
The chart illustrates a strong pump followed by what looks like a developing three-drive pattern. After the first drive, price pulled back roughly 33%, forming a solid base before climbing into the second drive. Momentum is still bullish, but a deeper retracement may occur before the projected third drive toward the 0.000116 area. As long as corrections stay controlled and volume supports the trend, the overall structure suggests continued upside potential.
LUNCUSDT — Accumulation at Demand Zone, Breakout or Breakdown?📝 Overview
The pair LUNC/USDT on the weekly (1W) timeframe is showing a long and extended consolidation phase since mid-2024 until now. Price has been moving sideways within the demand zone (0.00004665 – 0.00005990), marked by the yellow box on the chart.
This area serves as the final defense for buyers, acting as an accumulation base before a potential breakout to the upside. On the other hand, if broken to the downside, it could flip into a supply zone that drives price even lower.
---
🔎 P
LUNC ANANLYSIS (2D)LUNC, after a strong pump in the form of an X wave, appears to have entered a diametric pattern and is now at the end of Wave E.
In the green zone, we are looking for buy positions in spot, while in the red zone, we are looking for sell/short positions in futures.
To invalidate the buy and sell outlooks, we have marked two invalidation levels on the chart. If a daily candle body closes above or below these levels, the respective outlook will be invalidated.
For risk management, please don't f
LUNC Luna Classic Is About To DieA lot of these tokens in the next couple years are going to bleed out to zero. With the new Bitcoin ETFs and big money in the space they arent buying Luna, or BNB, or name your coin. They are buying what regulators have allowed them to buy. So far thats only Bitcoin,Ethereum, Litecoin, and Bitcoin Cash. This next bullrun will be utility, and regulatory based for the big players.
People holding these tokens like LUNC are going to eventually dump. Luna will never go to even a penny never m
Could LUNC be preparing to make a comeback?LUNC has been trading below equilibrium for about two years now, following a horrific loss in value that completely destroyed its reputation and shattered the wealth of tens of thousands of investors. However, the charts seem to indicate that LUNC could experience a 300% to 500% price increase by early 2026, perhaps even sooner.
I'm by no means a fan of LUNC and would avoid it like the plague if I were you. Regardless, the "wealth transfer" community across a wide variety of platforms seems con
LUNC trash token has already lost 100% of the 'Trump Pump' gainsThe LUNC trash token, often promoted by the 'wealth transfer' community on YouTube and other platforms, has officially lost 100% of the gains it made from the 'Trump Election pump.' It does appear that LUNC could be setting up for a decent move in the future, but anyone who invests in a trash token like this, which has defrauded so many people and robbed them of their wealth, would have to be utterly insane. Not to mention, there are trillions and trillions of tokens.
There are much better inve
LUNC BULLISH During what we predicted, LUNC was able to act and broke the triangle with a great momentum, and now it's time for him to say hello again to the ceiling of our triangle, which plays the role of support, this is the correction that was expected and then it should Let's wait for an attractive climb again
LUNC, Don't question the INTENTION to go UP.. and i mean UP.I'll keep it simple.
KEY NOTES:
WEEKLY DESCENDING TRENDLINE BROKEN.
HUGE MASSIVE NET BUY VOLUME registered this past 48hours.
WEEKLY PRICE SHIFT.
WEEKLY - Unusual volume strength line (top indicator).
2 BUBBLE UP VOLUME - bottom indicator warning sign of long series of ASCEND.
BE READY for an ASCEND of a lifetime.
Spotted at 0.000105
TAYOR.
Safeguard Capital always.
LUNC is bearishThe general structure of LUNC is bear.
The latter has swept orders by hitting a supply and then broke the support line.
A resistance swap range has also been formed on the chart, in which we are looking for sell/short positions.
The targets are clear on the chart.
Closing a daily candle above the invalidation level will violate the analysis
Note that the financial market is risky, so:
Do not enter any position without confirmation and trigger.
Do not enter a position without setting a stop.
LUNC ANALYSIS (6H)LUNC appears to be forming a large triangle or diametric pattern.
It looks like wave D is over and we are now entering wave E.
Wave E appears to be a diametric.
After the completion of wave e and f from E, we are expected to move towards the targets for wave g from E.
The green range is where we look for buy/long positions.
Closing a daily candle below the invalidation level will violate the analysis.
For risk management, please don't forget stop loss and capital management
When we reach t
LUNC/USDT planning bullish reversal from support| 🚀LUNC💎 Paradisers, gear up for an intriguing opportunity with #LUNCUSDT as it edges closer to a crucial support level, signaling a potential bullish reversal. If the price maintains its momentum and rebounds from this level, we might embark on a bullish journey from this support.
💎 With continued upward momentum, our sights are set on targeting the resistance at $0.00021046. Surpassing this level would lead us into the resistance mitigation zone at $0.00025546. However, should the price struggle to
LUNC: 📊Analysis by AhmadArz:
🔍Entry:
BUY:1442
SELL:2353
🛑Stop Loss:
BUY:1322
SELL:2642
🎯Take Profit:
BUY:1565-1690-1823
SELL:2050-1752-1442
🔗"Uncover new opportunities in the world of cryptocurrencies with AhmadArz.
💡Join us on TradingView and expand your investment knowledge with our five years of experience in financial markets."
🚀Please boost and💬 comment to share your thoughts with us!
in the minor movement(LUNC)📊Analysis by AhmadArz:
Ok by scalp trading????
🔗"Uncover new opportunities in the world of cryptocurrencies with AhmadArz.
💡Join us on TradingView and expand your investment knowledge with our five years of experience in financial markets."
🚀Please boost and💬 comment to share your thoughts with us!