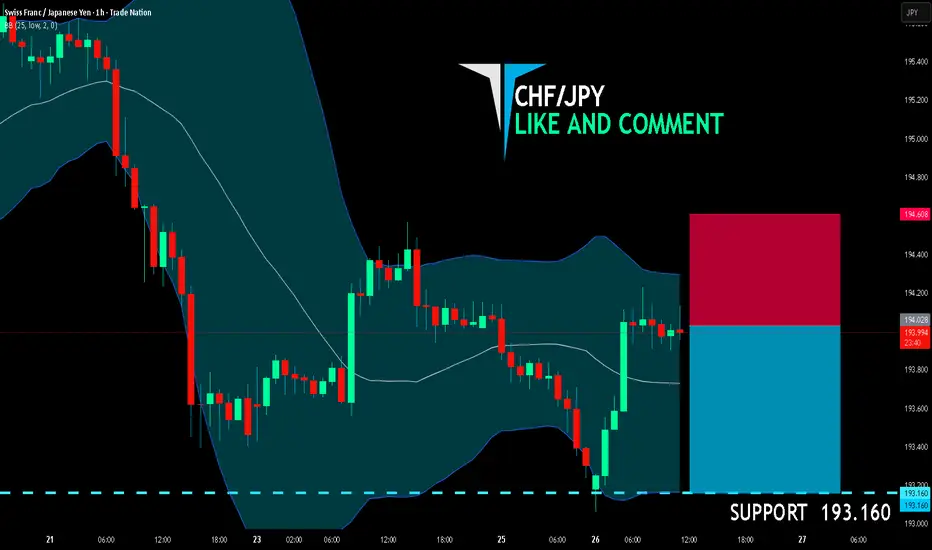
CHF/JPY SHORT FROM RESISTANCE
CHF/JPY SIGNAL
Trade Direction: short
Entry Level: 194.028
Target Level: 193.160
Stop Loss: 194.608
RISK PROFILE
Risk level: medium
Suggested risk: 1%
Timeframe: 1h
Disclosure: I am part of Trade Nation's Influencer program and receive a monthly fee for using their TradingView charts in my analysis.
✅LIKE AND COMMENT MY IDEAS✅
M-forex
NZD/JPY BEARS WILL DOMINATE THE MARKET|SHORT
Hello, Friends!
We are now examining the NZD/JPY pair and we can see that the pair is going up locally while also being in a uptrend on the 1W TF. But there is also a powerful signal from the BB upper band being nearby, indicating that the pair is overbought so we can go short from the resistance line above and a target at 88.001 level.
Disclosure: I am part of Trade Nation's Influencer program and receive a monthly fee for using their TradingView charts in my analysis.
✅LIKE AND COMMENT MY IDEAS✅

CAD/JPY SENDS CLEAR BEARISH SIGNALS|SHORT
Hello, Friends!
The BB upper band is nearby so CAD-JPY is in the overbought territory. Thus, despite the uptrend on the 1W timeframe I think that we will see a bearish reaction from the resistance line above and a move down towards the target at around 109.581.
Disclosure: I am part of Trade Nation's Influencer program and receive a monthly fee for using their TradingView charts in my analysis.
✅LIKE AND COMMENT MY IDEAS✅

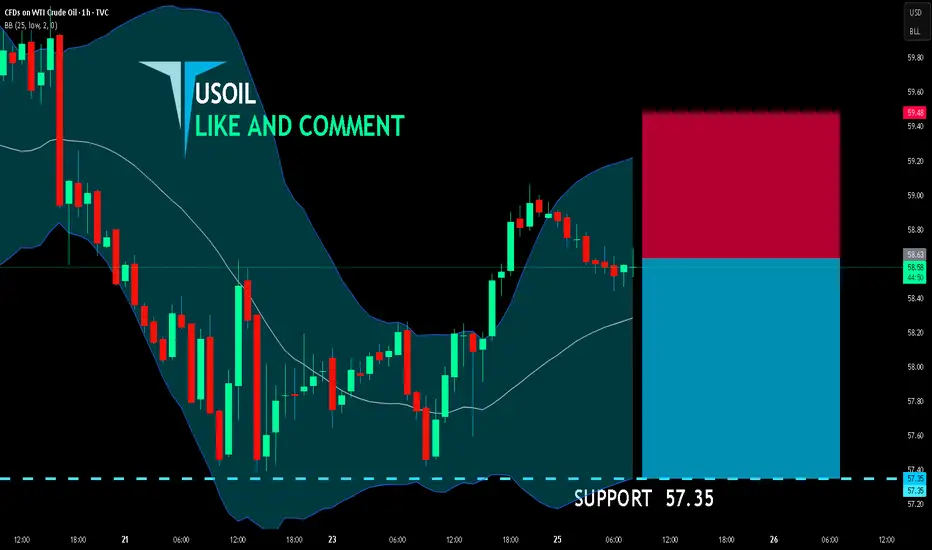
USOIL BEARS ARE GAINING STRENGTH|SHORT
USOIL SIGNAL
Trade Direction: short
Entry Level: 58.63
Target Level: 57.35
Stop Loss: 59.48
RISK PROFILE
Risk level: medium
Suggested risk: 1%
Timeframe: 1h
Disclosure: I am part of Trade Nation's Influencer program and receive a monthly fee for using their TradingView charts in my analysis.
✅LIKE AND COMMENT MY IDEAS✅
GBPUSD Will Go Lower From Resistance! Sell!
Take a look at our analysis for GBPUSD.
Time Frame: 6h
Current Trend: Bearish
Sentiment: Overbought (based on 7-period RSI)
Forecast: Bearish
The market is approaching a key horizontal level 1.316.
Considering the today's price action, probabilities will be high to see a movement to 1.309.
P.S
The term oversold refers to a condition where an asset has traded lower in price and has the potential for a price bounce.
Overbought refers to market scenarios where the instrument is traded considerably higher than its fair value. Overvaluation is caused by market sentiments when there is positive news.
Like and subscribe and comment my ideas if you enjoy them!

EURCAD Will Go Lower! Short!
Please, check our technical outlook for EURCAD.
Time Frame: 1D
Current Trend: Bearish
Sentiment: Overbought (based on 7-period RSI)
Forecast: Bearish
The market is approaching a significant resistance area 1.630.
Due to the fact that we see a positive bearish reaction from the underlined area, I strongly believe that sellers will manage to push the price all the way down to 1.619 level.
P.S
We determine oversold/overbought condition with RSI indicator.
When it drops below 30 - the market is considered to be oversold.
When it bounces above 70 - the market is considered to be overbought.
Like and subscribe and comment my ideas if you enjoy them!

EURCHF Will Go Down! Sell!
Here is our detailed technical review for EURCHF.
Time Frame: 1h
Current Trend: Bearish
Sentiment: Overbought (based on 7-period RSI)
Forecast: Bearish
The market is on a crucial zone of supply 0.933.
The above-mentioned technicals clearly indicate the dominance of sellers on the market. I recommend shorting the instrument, aiming at 0.930 level.
P.S
Overbought describes a period of time where there has been a significant and consistent upward move in price over a period of time without much pullback.
Like and subscribe and comment my ideas if you enjoy them!

NZDCHF: Bearish Move From Trend Line 🇳🇿🇨🇭
On a today's live stream, we discussed a trading setup on NZDCHF.
There is a high chance that the pair will retrace from a solid falling
trend line on a daily time frame.
Goal - 0.456
❤️Please, support my work with like, thank you!❤️
I am part of Trade Nation's Influencer program and receive a monthly fee for using their TradingView charts in my analysis.

EURUSD Is Bullish! Buy!
Please, check our technical outlook for EURUSD.
Time Frame: 2h
Current Trend: Bullish
Sentiment: Oversold (based on 7-period RSI)
Forecast: Bullish
The market is trading around a solid horizontal structure 1.152.
The above observations make me that the market will inevitably achieve 1.155 level.
P.S
The term oversold refers to a condition where an asset has traded lower in price and has the potential for a price bounce.
Overbought refers to market scenarios where the instrument is traded considerably higher than its fair value. Overvaluation is caused by market sentiments when there is positive news.
Like and subscribe and comment my ideas if you enjoy them!

ETHUSD Technical (Bullish Plan) ...ETHUSD Price retraced back into the 2910 zone, which has been acting as a clean reaction point in previous structure. After the pullback, ETH is holding above the range low and showing signs of stabilizing, suggesting that buyers are defending this area. As long as price holds above 2910 on the 4H structure, the upside bias remains intact.
The first major objective sits around 3700, where previous supply and structural resistance align. If momentum continues and ETH clears that level without rejection, the next extension target is 4300, which aligns with the higher-timeframe resistance zone and the next liquidity pocket.
This setup remains valid as long as ETH doesn’t close strongly below the 2910 support, which would invalidate the bullish continuation idea and shift momentum back to the downside

EURUSD Buyers Defend Support — Targets 1.1600 Resistance RetestHello traders! Let’s break down the current EURUSD structure. EURUSD is trading within a broad ascending structure, finding strong support at the Buyer Zone (1.1500–1.1510), which aligns with both the Support Level and the lower boundary of the rising channel. This area has acted as a key reaction point multiple times, confirming the presence of strong buyers and forming the base for several upward impulses. Earlier, the pair broke out of the descending triangle structure, retesting the former Seller Zone before continuing lower. After reaching the channel support, EURUSD formed a local bottom and started to grow, respecting the trendline and creating higher lows. A fake breakout occurred near the mid-channel resistance, where buyers quickly returned, signaling continued demand. Currently, EURUSD is approaching the Resistance Level at 1.1600, which also serves as the first major take-profit area (TP1). This zone has previously caused corrective moves and remains the main barrier for buyers. If the pair maintains momentum and stays above the Buyer Zone, I expect a bullish push toward TP1 → 1.1600, where sellers may again attempt to hold resistance. A confirmed breakout above 1.1600 would unlock a path toward higher levels within the ascending structure. However, if EURUSD breaks below 1.1500 and fails to hold the Buyer Zone, the bullish scenario becomes invalid. In that case, the price may revisit deeper support levels and potentially exit the rising channel. For now, the structure remains moderately bullish, with buyers dominating as long as the pair trades above demand and respects the ascending support line. Please share this idea with your friends and click "Boost" 🚀

EURUSD – Technical Target Analysis...📊 EURUSD – Technical Target Analysis (Based on my Chart)
1️⃣ Trendline Breakout
Price has clearly broken above the descending trendline, which often signals that the prior bearish momentum is weakening and a corrective move upward is likely.
2️⃣ Ichimoku Structure
Price pushed into and through the cloud, showing early bullish pressure.
A bullish continuation is possible if price holds above the cloud and above the breakout level.
---
🎯 Target Levels Based on my Chart
My chart shows two target zones, and the market structure supports them:
🔵 Target 1 (Short-term / Conservative)
📍 1.1570 – 1.1580 zone
This area is:
The first horizontal resistance
A point where previous selling pressure appeared
A logical TP1 for a breakout-pullback setup
A pullback into this zone is common after a trendline breakout.
---
🔵 Target 2 (Extended / Stronger Move)
📍 1.1615 – 1.1622 zone
This area aligns with:
Major structural resistance on my chart
The upper measured-move extension my marked
Previous swing highs
If momentum continues, this is the next logical upside target.
---
🧭 Summary of Targets
Target Price Zone Reason
Target 1 1.1570 – 1.1580 First resistance + measured breakout level
Target 2 1.1615 – 1.1622 Major resistance + full extension

GBPUSD Technical Target Analysis (1H Chart)...📊 GBPUSD Technical Target Analysis (1H Chart)
My chart shows:
A descending trendline that price is currently testing.
Price is sitting inside the Ichimoku cloud, attempting to break upward.
Two Target Point levels marked on my chart.
Based on the structure visible:
---
🎯 Target Levels From my Chart
🔵 Target 1 — Short-Term / First Resistance
📍 1.3150 – 1.3160 zone
This is the level my marked as my first target.
It matches:
First major horizontal resistance
A typical breakout-level retest
Mid-range liquidity zone
This is a logical TP1 after a trendline break.
---
🔵 Target 2 — Extended Target / Full Bullish Move
📍 1.3195 – 1.3205 zone
This is my second “Target Point” at the top.
It aligns with:
Higher-timeframe resistance
Prior rejection zone
Completion of a measured move
This is the likely TP2 if price pushes fully out of the cloud and breaks the trendline cleanly.
---
🧭 Summary
Target Price Zone Reason
Target 1 1.3150 – 1.3160 First major resistance after breakout
Target 2 1.3195 – 1.3205 Next structural high + full extension

SOL/USDT (30-minute)..
✅ Targets Visible on My Chart (Already Marked by me)
My TradingView chart for SOL/USDT (30-minute) shows two downward “Target Points” marked with blue arrows:
1. First Target Zone:
• Around $128 (approx).
• Marked just below the current price break of the trendline.
2. Second / Deeper Target Zone:
• Around $120–121.
• This is the larger measured move shown by the longer blue arrow.
🧭 What the Chart Suggests (Just Based on What I Drew)
Price appears to have broken the ascending trendline.
Targets seem to be drawn using a measured-move / range projection.
Cloud (Ichimoku) shows price dipping into bearish zone

GBPAUD Looks Bullish (1D)In the GBPAUD pair, strong liquidity has accumulated below the chart, and the price has consistently formed bullish structures.
Given the bullish structure and the formation of a support zone, we can look for long buy positions on the demand zone.
The main swing targets for this move are marked on the chart.
If the invalidation level is touched, this analysis will be invalidated.
Do not enter the position without capital management and stop setting
Comment if you have any questions
thank you

GOLD ANALYSIS 11/26/20251. Fundamental Analysis:
a) Economy:
USD:
• The USD is leaning toward a slight decline as the market expects the FED to keep interest rates unchanged and possibly make minor cuts in the coming months.
• This supports gold because a weaker USD → bullish for gold in the short term.
U.S. Stock Market:
• U.S. equities have rebounded following stable corporate earnings; risk-on flows are returning.
• This limits gold’s upside, but does not create strong pressure as the bullish momentum is not too strong.
FED:
• The FED continues to emphasize a cautious policy stance, with no additional rate hikes.
• This keeps bond yields low → supportive for gold in the medium term.
TRUMP (Trump Administration):
• Trump’s policies on boosting manufacturing and cutting taxes continue to create expectations of rising inflation.
• Higher inflation → long-term positive for gold, although it may cause short-term volatility.
Gold ETF – SPDR:
• SPDR has not sold off and maintains holdings around 104 tons.
• The “no selling” stance → neutral to slightly bullish signal.
b) Geopolitics:
• Conditions remain relatively stable over the past 24 hours.
• The market continues to monitor trade tensions and financial conflicts between major economic blocs.
• Any geopolitical disturbance increases safe-haven demand for gold.
c) Market Sentiment:
• Overall sentiment is slightly risk-on: U.S. stocks stable, risk appetite improving.
• However, the market maintains a degree of caution ahead of upcoming GDP and PCE reports.
• Therefore, gold may not rise strongly, but it maintains solid price support and short-term upside.
• End-of-month and end-of-year periods typically see lower trading activity.
2. Technical Analysis:
a) Market Structure:
• Gold remains in a short-term uptrend with a clear sequence of higher lows from the 4029 zone.
• The rising trendline is still intact.
b) Price Action Signals:
• The 15m chart shows a clean bullish pattern.
• A retracement to 4096 may occur before heading higher.
• Upside targets remain toward 4193.
c) Technical Indicators:
• RSI is neutral → suitable for a pullback before continuation.
• MA20 – MA50 expanding upward → reinforces the bullish bias.
d) Main Scenario:
• Pullback to 4096, then bounce upward → targets: 4158 → 4193.
• Strategy is to follow price action at key levels. At resistance zones, always wait for confirmation of breakout or rejection before trading. Favor setups aligned with the main trend.
e) Key Levels:
Resistance: 4158 – 4193 – 4244
Support: 4096 – 4062 – 4029
3. Market Summary (25/11/25):
• GOLD tested the 4040–4060 area and bounced upward according to trend structure.
• Price range was relatively narrow but still maintained a bullish base.
• No major news catalysts; market moved mainly on technicals.
4. Strategy for Today (26/11/25):
🪙 SELL XAUUSD | 4213 – 4211
SL: 4217
TP1: 4205
TP2: 4199
🪙 BUY XAUUSD | 4133 – 4135
SL: 4129
TP1: 4141
TP2: 4147

GBPUSD: Bearish Drop to 1.307?FX:GBPUSD is eyeing a strong bearish continuation on the 1-hour chart , with price compressing tightly into a key resistance zone + downward trendline touch, forming a high-probability compression pattern that could trigger sharp selling pressure if sellers break the ongoing consolidation. Perfect short setup after the recent rally exhaustion, targeting lower support cluster with good risk-reward.
Entry between 1.3130–1.3140 for a short position (aggressive entry right here with proper risk management is recommended). Main target at 1.3070 . Set stop loss on any 4H candle close above 1.3160 , delivering a clean risk-reward ratio of ~1:2 (conservative) to 1:3+ (if partials used). Watch for bearish confirmation on lower timeframe break or strong red candle with volume spike.⚡
Fundamentally , pound is losing steam near multi-month highs as markets aggressively price in BoE rate cuts (potentially as soon as December) while the dollar regains strength on sticky US data and reduced Fed cut expectations . Upcoming UK CPI and US PMI this week can act as major catalysts for USD strength – classic risk-off setup for cable shorts.💡
📝 Trade Setup
🎯 Entry (Short):
1.3130 – 1.3140
(Aggressive entry from current levels is possible with strict risk management.)
🎯 Target:
• TP: 1.3070
❌ Stop Loss:
• Any 4H close above 1.3160
⚖️ Risk-to-Reward:
• ~1:2
👇 Share your thoughts below! 👇

Hassett News Bullish for GoldAccording to news agencies, Hassett name is on the forefront for next FED chair. Even the idea of it is bullish for metals. I don't expect a cut from FED in December but market expectations + Hassett optimisim could cause bullish pressure if no selloff came from the stock market.
Silver also helping gold bulls. China silver stocks are very low and it could cause a pull from London which will be bullish as well.
But despite all, I plan a close stop in case of a turnaround. I do not trust news too much and sentiment could change so easily these days.

#EURJPY , HighRisk QuickScalp📌 Market Insight: {#EURJPY }
⚠️ Risk Assessment: {High}
🚀 Approach:
Super Risky Setup ... at ATH and we need becareful
Just for QuickScalp
#Ash_TheTrader #Forex #GBPJPY #MarketAnalysis #TradingSetup #RiskManagement #GOLD #Scalper #NQ #EURUSD

NZDUSD: Time for Pullback 🇳🇿🇺🇸
NZDUSD looks too overbought after a formation
of a huge fair value gap.
I see a clear weakness of the buyers after
a test of a historic daily key level.
Expect a pullback at least to 0.5669
❤️Please, support my work with like, thank you!❤️
I am part of Trade Nation's Influencer program and receive a monthly fee for using their TradingView charts in my analysis.

NZDCAD NZDCAD going short with 1:2 RR as overall it is in a downtrend with a strong pullback and confirmation to go short.

BTCUSD BUYS HELD Bitcoin’s price has been rising steadily over the last few days and the market has seen a sharp rise in to the upside, more trades are expected to be coming from a buy stop trigger

GOLD outcome.GOLD is pulling back in Asian session ans has been consolidating. Waiting for a climb going to London session.
