Gold price analysis October 22GOLD UPDATE – Strong Correction Pressure Appears
After a long rally, gold witnessed a sharp decline yesterday, with a deep correction of up to 300 prices - a rare number in the recent period. This shows that profit-taking pressure from buyers is increasing, and the short-term correction trend may continue today.
In the context of the temporary pause in the uptrend, the resistance zones above will play an important role in observing price behavior. If there is a clear price rejection signal at these zones, the priority strategy will be to SELL according to the correction wave.
📉 SELL trigger: When there is a price rejection at the resistance zone of 4179 - 4226
🎯 Target: 3946
The short-term trend is leaning towards a downward correction, so keep a close eye on the price reaction to avoid missing out on the opportunity to trade in the right direction.
M-forex

Gold price analysis October 21GOLD UPDATE – Buying opportunity is forming after a strong correction
Today's European session recorded a rather deep correction of gold, when the price fell nearly 100 USD before temporarily stabilizing again. However, the main trend is still leaning towards the Buyers, and the support zones below are considered ideal areas to observe BUY signals.
Notable zones include: 4223 – 4193 – 4267, where the market may react and create opportunities to enter orders.
The upcoming US session is still likely to maintain the upward momentum, so the priority strategy at this time is still to wait for BUY when there is a confirmation signal of price rejection at support.
🎯 Trading plan:
BUY NOW: 4367
BUY Trigger: when there is a signal of price rejection at 4223 or 4193
Target: 4500

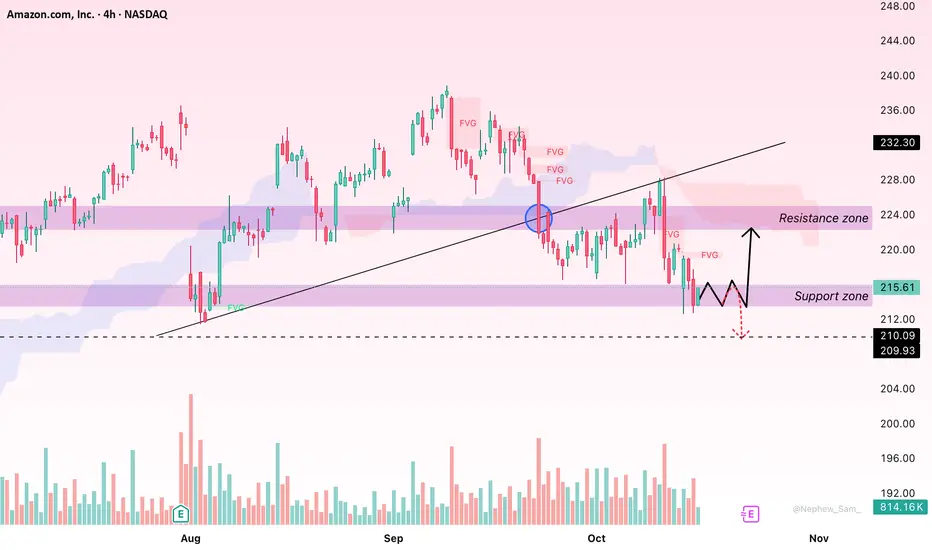
Amazon (AMZN): Pullback Pause or Start of a Deeper Correction?Hello everyone,
Amazon’s stock has drawn attention after sliding from the 220 USD peak to below 216 USD. Looking at the broader picture, this move reflects not only a technical correction but also investors’ growing caution amid mixed U.S. economic signals and uncertainty around the tech sector’s outlook.
From a fundamental standpoint, the backdrop isn’t entirely favorable for tech giants. Although Amazon remains dominant in e-commerce and cloud computing, growth expectations are cooling due to rising competition and higher advertising costs. Lower-than-expected margins triggered early profit-taking, especially as Treasury yields climb and U.S. growth shows signs of slowing. With capital flows turning defensive, FAANG stocks — including AMZN — are among the first to face selling pressure. Additionally, softer consumer demand in emerging markets and ongoing supply chain disruptions have raised concerns that Amazon’s expansion momentum could temporarily stall.
On the H4 chart, the bearish structure is clear. AMZN has dropped from the 218–220 USD zone toward 215 USD, staying below the Ichimoku cloud — a signal that sellers still dominate. The 215.0 area now acts as short-term support, while 210.0 is a stronger defensive zone if selling persists. On the upside, 220.0–222.0 remains a heavy resistance area filled with thick FVG clusters, where sellers could reappear if the price rebounds.
Looking ahead, I expect AMZN may dip slightly to retest 215.0–214.5 before attempting a recovery. If buying interest emerges from this zone, a rebound toward 220.0–222.0 is possible — a key region to confirm a short-term reversal. However, a decisive break below 214.5 could extend the decline toward 210.0, where long-term buyers may find value again.
Despite near-term pressure, Amazon’s strong fundamentals remain intact, and such corrections often provide opportunities for institutional accumulation at lower levels.
What do you think — is this just a healthy pullback, or the start of a deeper correction for Amazon?
GBP/USD: Bearish Pressure Ahead of UK BudgetThe British Pound is currently under bearish pressure amid unfavorable economic factors in the UK. The forecast for UK CPI inflation in September is only 3.9%, lower than the central bank's expectations. This could lead to more dovish expectations for monetary policy, putting pressure on GBP.
Additionally, the UK's budget announcement on November 26 will be another crucial factor. Until clear information from the budget is released, the British Pound is likely to remain in a "frozen" state with limited upward movement.
Technically, GBP/USD has reached resistance at 1.34500 and is experiencing a significant pullback. If the price fails to hold support at 1.32500, the likelihood of further decline to 1.32000 is high.
In conclusion, with weak fundamental factors and a bearish technical trend, the probability of GBP/USD continuing to decline is quite high in the near future.

AUDUSD: Waiting for Retest Before Any Breakout MoveHello everyone,
AUDUSD is currently consolidating after a technical rebound and trades around the recently breached FVG, while remaining under the Ichimoku cloud on H4 – a sign that the main downtrend is still in place, but selling pressure has eased. The market has shifted to a “watching” phase rather than aggressive selling, evidenced by short-term sideways price action and small indecisive candles. Support at 0.6450–0.6440 remains critical, being both a former low and a prior buying zone that had absorbed selling. If this area holds, AUDUSD could form a rebound to retest resistance at 0.6530–0.6550, which coincides with the 55/100-day SMA and represents a significant technical confluence according to FXStreet.
On the news front, AUD faces mixed influences. As per OFX, risk-on sentiment due to hopes of improved US–China trade relations has supported a short-term recovery, given AUD’s risk-sensitive profile. However, recent Australian employment data was weak, with a loss of 34,000 jobs in September, raising expectations that the RBA might cut rates sooner, weighing on AUD versus USD. FXStreet notes that AUDUSD currently “lacks sufficient momentum” to breach the 0.6629–0.6707 zone, and absent new catalysts, price may simply return to retest 0.6440 support.
I lean towards a scenario of retesting support before any further advance. If 0.6450–0.6440 holds, this area becomes a potential buying zone targeting 0.6530–0.6550, with an extension towards 0.6580–0.6600 if breached. Conversely, a stronger USD on positive US data or negative AUD/China news could break 0.6440, opening room for declines to 0.6400 or even 0.6370.
What are your thoughts? Share them in the comments!

USDCHF H1 | Possible Uptrend AheadSwissie (USD/CHF) has bounced off the buy entry which is an overlap support and could rise from this level to the take profit.
Buy entry is at 0.7937, whichis an overlap support.
Stop loss is at 0.7907, which is a pullback support.
Take profit is at 0.7986, which is an overlap resistance that aligns with the 61.8% Fibonacci retracement.
High Risk Investment Warning
Trading Forex/CFDs on margin carries a high level of risk and may not be suitable for all investors. Leverage can work against you.
Stratos Markets Limited (tradu.com ):
CFDs are complex instruments and come with a high risk of losing money rapidly due to leverage. 65% of retail investor accounts lose money when trading CFDs with this provider. You should consider whether you understand how CFDs work and whether you can afford to take the high risk of losing your money.
Stratos Europe Ltd (tradu.com ):
CFDs are complex instruments and come with a high risk of losing money rapidly due to leverage. 66% of retail investor accounts lose money when trading CFDs with this provider. You should consider whether you understand how CFDs work and whether you can afford to take the high risk of losing your money.
Stratos Global LLC (tradu.com ):
Losses can exceed deposits.
Please be advised that the information presented on TradingView is provided to Tradu (‘Company’, ‘we’) by a third-party provider (‘TFA Global Pte Ltd’). Please be reminded that you are solely responsible for the trading decisions on your account. There is a very high degree of risk involved in trading. Any information and/or content is intended entirely for research, educational and informational purposes only and does not constitute investment or consultation advice or investment strategy. The information is not tailored to the investment needs of any specific person and therefore does not involve a consideration of any of the investment objectives, financial situation or needs of any viewer that may receive it. Kindly also note that past performance is not a reliable indicator of future results. Actual results may differ materially from those anticipated in forward-looking or past performance statements. We assume no liability as to the accuracy or completeness of any of the information and/or content provided herein and the Company cannot be held responsible for any omission, mistake nor for any loss or damage including without limitation to any loss of profit which may arise from reliance on any information supplied by TFA Global Pte Ltd.
The speaker(s) is neither an employee, agent nor representative of Tradu and is therefore acting independently. The opinions given are their own, constitute general market commentary, and do not constitute the opinion or advice of Tradu or any form of personal or investment advice. Tradu neither endorses nor guarantees offerings of third-party speakers, nor is Tradu responsible for the content, veracity or opinions of third-party speakers, presenters or participants.

GBPUSD H1 | Bearish Continuation SetupCable (GBP/USD) has rejected off the sell entry which is a pullback resistance and could potentially drop from this level to the downside.
Sell entry is at 1.3390, which is a pullback resistance.
Stop loss is at 1.3439, whichis a pullback resistance.
Take profit is at 1.3327, which is an overlap support that is slightly below the 61.8% Fibonacci retracement.
High Risk Investment Warning
Trading Forex/CFDs on margin carries a high level of risk and may not be suitable for all investors. Leverage can work against you.
Stratos Markets Limited (tradu.com ):
CFDs are complex instruments and come with a high risk of losing money rapidly due to leverage. 65% of retail investor accounts lose money when trading CFDs with this provider. You should consider whether you understand how CFDs work and whether you can afford to take the high risk of losing your money.
Stratos Europe Ltd (tradu.com ):
CFDs are complex instruments and come with a high risk of losing money rapidly due to leverage. 66% of retail investor accounts lose money when trading CFDs with this provider. You should consider whether you understand how CFDs work and whether you can afford to take the high risk of losing your money.
Stratos Global LLC (tradu.com ):
Losses can exceed deposits.
Please be advised that the information presented on TradingView is provided to Tradu (‘Company’, ‘we’) by a third-party provider (‘TFA Global Pte Ltd’). Please be reminded that you are solely responsible for the trading decisions on your account. There is a very high degree of risk involved in trading. Any information and/or content is intended entirely for research, educational and informational purposes only and does not constitute investment or consultation advice or investment strategy. The information is not tailored to the investment needs of any specific person and therefore does not involve a consideration of any of the investment objectives, financial situation or needs of any viewer that may receive it. Kindly also note that past performance is not a reliable indicator of future results. Actual results may differ materially from those anticipated in forward-looking or past performance statements. We assume no liability as to the accuracy or completeness of any of the information and/or content provided herein and the Company cannot be held responsible for any omission, mistake nor for any loss or damage including without limitation to any loss of profit which may arise from reliance on any information supplied by TFA Global Pte Ltd.
The speaker(s) is neither an employee, agent nor representative of Tradu and is therefore acting independently. The opinions given are their own, constitute general market commentary, and do not constitute the opinion or advice of Tradu or any form of personal or investment advice. Tradu neither endorses nor guarantees offerings of third-party speakers, nor is Tradu responsible for the content, veracity or opinions of third-party speakers, presenters or participants.

EURUSD H1 | Bullish Reversal from Pullback SupportEUR/USD is falling towards the buy entry which is a pullback support and could bounce from this level to the upside.
Buy entry is at 1.1591, which is a pullback support.
Stop loss is at 1.1560, which is a pullback support.
Take profit is at 1.1646, whichis an overlap resistance.
High Risk Investment Warning
Trading Forex/CFDs on margin carries a high level of risk and may not be suitable for all investors. Leverage can work against you.
Stratos Markets Limited (tradu.com ):
CFDs are complex instruments and come with a high risk of losing money rapidly due to leverage. 65% of retail investor accounts lose money when trading CFDs with this provider. You should consider whether you understand how CFDs work and whether you can afford to take the high risk of losing your money.
Stratos Europe Ltd (tradu.com ):
CFDs are complex instruments and come with a high risk of losing money rapidly due to leverage. 66% of retail investor accounts lose money when trading CFDs with this provider. You should consider whether you understand how CFDs work and whether you can afford to take the high risk of losing your money.
Stratos Global LLC (tradu.com ):
Losses can exceed deposits.
Please be advised that the information presented on TradingView is provided to Tradu (‘Company’, ‘we’) by a third-party provider (‘TFA Global Pte Ltd’). Please be reminded that you are solely responsible for the trading decisions on your account. There is a very high degree of risk involved in trading. Any information and/or content is intended entirely for research, educational and informational purposes only and does not constitute investment or consultation advice or investment strategy. The information is not tailored to the investment needs of any specific person and therefore does not involve a consideration of any of the investment objectives, financial situation or needs of any viewer that may receive it. Kindly also note that past performance is not a reliable indicator of future results. Actual results may differ materially from those anticipated in forward-looking or past performance statements. We assume no liability as to the accuracy or completeness of any of the information and/or content provided herein and the Company cannot be held responsible for any omission, mistake nor for any loss or damage including without limitation to any loss of profit which may arise from reliance on any information supplied by TFA Global Pte Ltd.
The speaker(s) is neither an employee, agent nor representative of Tradu and is therefore acting independently. The opinions given are their own, constitute general market commentary, and do not constitute the opinion or advice of Tradu or any form of personal or investment advice. Tradu neither endorses nor guarantees offerings of third-party speakers, nor is Tradu responsible for the content, veracity or opinions of third-party speakers, presenters or participants.

Bullish bounce?NZD/JPY is falling towards the pivot, which is a pullback support and could bounce to the 1st resistance, which acts as a swing high resistance.
Pivot: 86.77
1st Support: 85.67
1st Resistance: 88.49
Disclaimer:
The above opinions given constitute general market commentary, and do not constitute the opinion or advice of IC Markets or any form of personal or investment advice.
Any opinions, news, research, analyses, prices, other information, or links to third-party sites contained on this website are provided on an "as-is" basis, are intended only to be informative, is not an advice nor a recommendation, nor research, or a record of our trading prices, or an offer of, or solicitation for a transaction in any financial instrument and thus should not be treated as such. The information provided does not involve any specific investment objectives, financial situation and needs of any specific person who may receive it. Please be aware, that past performance is not a reliable indicator of future performance and/or results. Past Performance or Forward-looking scenarios based upon the reasonable beliefs of the third-party provider are not a guarantee of future performance. Actual results may differ materially from those anticipated in forward-looking or past performance statements. IC Markets makes no representation or warranty and assumes no liability as to the accuracy or completeness of the information provided, nor any loss arising from any investment based on a recommendation, forecast or any information supplied by any third-party.

Bullish reversal?NZD/CHF is reacting off the pivot which is a pullback support and could rise to the 1st resistance.
Pivot: 0.45550
1st Support: 0.45147
1st Resistance: 0.46124
Disclaimer:
The above opinions given constitute general market commentary, and do not constitute the opinion or advice of IC Markets or any form of personal or investment advice.
Any opinions, news, research, analyses, prices, other information, or links to third-party sites contained on this website are provided on an "as-is" basis, are intended only to be informative, is not an advice nor a recommendation, nor research, or a record of our trading prices, or an offer of, or solicitation for a transaction in any financial instrument and thus should not be treated as such. The information provided does not involve any specific investment objectives, financial situation and needs of any specific person who may receive it. Please be aware, that past performance is not a reliable indicator of future performance and/or results. Past Performance or Forward-looking scenarios based upon the reasonable beliefs of the third-party provider are not a guarantee of future performance. Actual results may differ materially from those anticipated in forward-looking or past performance statements. IC Markets makes no representation or warranty and assumes no liability as to the accuracy or completeness of the information provided, nor any loss arising from any investment based on a recommendation, forecast or any information supplied by any third-party.

GBPAUD to find buyers at current market price?GBPAUD - 24h expiry
Our short term bias remains positive.
50 4hour EMA is at 2.0572.
Offers ample risk/reward to buy at the market.
Our short term bias remains positive.
Prices have reacted from 2.0244.
We look to Buy at 2.0575 (stop at 2.0505)
Our profit targets will be 2.0784 and 2.0824
Resistance: 2.0665 / 2.0697 / 2.0785
Support: 2.0559 / 2.0459 / 2.0425
Risk Disclaimer
The trade ideas beyond this page are for informational purposes only and do not constitute investment advice or a solicitation to trade. This information is provided by Signal Centre, a third-party unaffiliated with OANDA, and is intended for general circulation only. OANDA does not guarantee the accuracy of this information and assumes no responsibilities for the information provided by the third party. The information does not take into account the specific investment objectives, financial situation, or particular needs of any particular person. You should take into account your specific investment objectives, financial situation, and particular needs before making a commitment to trade, including seeking, under a separate engagement, as you deem fit.
You accept that you assume all risks in independently viewing the contents and selecting a chosen strategy.
Where the research is distributed in Singapore to a person who is not an Accredited Investor, Expert Investor or an Institutional Investor, Oanda Asia Pacific Pte Ltd (“OAP“) accepts legal responsibility for the contents of the report to such persons only to the extent required by law. Singapore customers should contact OAP at 6579 8289 for matters arising from, or in connection with, the information/research distributed.

CADCHFNot financial advice. The essence of investing & trading is the intelligent and patient preying on the greed, fear, impatience, addiction and ignorance of the majority. It's definitionally Darwinian.

EURGBP REBOUND AHEAD|LONG|
✅EURGBP is respecting the ascending trendline, showing signs of institutional accumulation near the dynamic support. A potential move toward 0.8690 is anticipated as liquidity builds above the recent highs. Time Frame 2H.
LONG🚀
✅Like and subscribe to never miss a new idea!✅

USDJPY Had its 1st 1D Golden Cross since Dec 2024.The USDJPY pair has been trading within a Channel Up pattern since the April 22 2025 market bottom and just last week, it formed the first 1D Golden Cross since December 16 2024. As you can see, all three 1D Golden Crosses since June 2023 have been strong Buy Signals.
All have been formed within Channel Up patterns that formed Higher Highs just after the crosses. The target of the current Channel Up is 154.000, which represents a +6.06% rise, similar to both previous Bullish Legs of this pattern. The uptrend is so far restricted by the presence of the Lower Highs trend-line that started back on the July 03 2024 market Top.
This time however we may see this break as the 1W RSI has already broken above its own Lower Highs trend-line, signaling an early bullish warning. As a result, if the July 2024 Lower Highs trend-line breaks, we expect the pair to eye the upper Resistance at 159.000.
-------------------------------------------------------------------------------
** Please LIKE 👍, FOLLOW ✅, SHARE 🙌 and COMMENT ✍ if you enjoy this idea! Also share your ideas and charts in the comments section below! This is best way to keep it relevant, support us, keep the content here free and allow the idea to reach as many people as possible. **
-------------------------------------------------------------------------------
💸💸💸💸💸💸
👇 👇 👇 👇 👇 👇

GBP-USD Free Signal! Buy!
Hello,Traders!
GBPUSD Price has tapped into a strong horizontal demand area after a corrective drop, showing potential for a bullish rebound. If this zone continues to hold, we may see buyers driving price toward the next short-term target.
-------------------
Stop Loss: 1.3361$
Take Profit: 1.3391$
Entry: 1.3375$
Time Frame: 3H
-------------------
Buy!
Comment and subscribe to help us grow!
Check out other forecasts below too!
Disclosure: I am part of Trade Nation's Influencer program and receive a monthly fee for using their TradingView charts in my analysis.

EUR-USD Bearish Breakout! Sell!
Hello,Traders!
EURUSD Price has broken below the horizontal supply area and is now forming a bearish continuation setup. A possible retracement toward the previous zone may attract more sellers, targeting deeper liquidity levels below 1.1580. Time Frame 5H.
Sell!
Comment and subscribe to help us grow!
Check out other forecasts below too!
Disclosure: I am part of Trade Nation's Influencer program and receive a monthly fee for using their TradingView charts in my analysis.

Xauusd Bullish SetupThis Gold (XAU/USD) analysis presents a bullish setup on the 30-minute chart. The price is expected to rebound from the support zone around 4097, where a buy limit trade is placed. The stop loss is positioned at 4046 to manage downside risk. The analysis targets an upward move towards 4165 (first take profit), 4227 (second take profit), and a final target at 4318, indicating strong potential for a recovery and continuation of the uptrend.

Bearish reversal off 61.8% FIbonacci resistance?AUD/USD is rising towards the resistance level, which is a pullback resistance that aligns with the 61.8% Fibonacci retracement and could reverse from this level to our take profit.
Entry: 0.6508
Why we like it:
Why we like it:
There is a pullback resistance level that lines up with the 61.8% Fibonacci retracement.
Stop loss: 0.6542
Why we like it:
There is a pullback resistance that lines up with the 127.2% Fibonacci extension.
Take profit: 0.6443
Why we like it:
There is a multi-swing low support level.
Enjoying your TradingView experience? Review us!
Please be advised that the information presented on TradingView is provided to Vantage (‘Vantage Global Limited’, ‘we’) by a third-party provider (‘Everest Fortune Group’). Please be reminded that you are solely responsible for the trading decisions on your account. There is a very high degree of risk involved in trading. Any information and/or content is intended entirely for research, educational and informational purposes only and does not constitute investment or consultation advice or investment strategy. The information is not tailored to the investment needs of any specific person and therefore does not involve a consideration of any of the investment objectives, financial situation or needs of any viewer that may receive it. Kindly also note that past performance is not a reliable indicator of future results. Actual results may differ materially from those anticipated in forward-looking or past performance statements. We assume no liability as to the accuracy or completeness of any of the information and/or content provided herein and the Company cannot be held responsible for any omission, mistake nor for any loss or damage including without limitation to any loss of profit which may arise from reliance on any information supplied by Everest Fortune Group.

Bullish momentum set to continue?USD/JPY is falling towards the support level, which is an overlap support that lines up with the 38.2% Fibonacci retracement and could bounce from this level to our take profit.
Entry: 151.21
Why we like it:
There is an overlap support that lines up with the 38.2% Fibonacci retracement.
Stop loss: 150.41
Why we like it:
There is a pullback support that aligns with the 61.8% Fibonacci retracement.
Take profit: 153.13
Why we like it:
There is a swing high resistance level.
Enjoying your TradingView experience? Review us!
Please be advised that the information presented on TradingView is provided to Vantage (‘Vantage Global Limited’, ‘we’) by a third-party provider (‘Everest Fortune Group’). Please be reminded that you are solely responsible for the trading decisions on your account. There is a very high degree of risk involved in trading. Any information and/or content is intended entirely for research, educational and informational purposes only and does not constitute investment or consultation advice or investment strategy. The information is not tailored to the investment needs of any specific person and therefore does not involve a consideration of any of the investment objectives, financial situation or needs of any viewer that may receive it. Kindly also note that past performance is not a reliable indicator of future results. Actual results may differ materially from those anticipated in forward-looking or past performance statements. We assume no liability as to the accuracy or completeness of any of the information and/or content provided herein and the Company cannot be held responsible for any omission, mistake nor for any loss or damage including without limitation to any loss of profit which may arise from reliance on any information supplied by Everest Fortune Group.

Potential bullish rise?USD/CHF is reacting off the support level which is a pullback support and could rise from this level to our take profit.
Entry: 0.7942
Why we like it:
There is a pullback support level.
Stop loss: 0.7893
Why we like it:
There is a pullback support level.
Take profit: 0.8010
Why we like it:
There is a pullback resistance that is slightly above the 61.8% Fibonacci retracement.
Enjoying your TradingView experience? Review us!
Please be advised that the information presented on TradingView is provided to Vantage (‘Vantage Global Limited’, ‘we’) by a third-party provider (‘Everest Fortune Group’). Please be reminded that you are solely responsible for the trading decisions on your account. There is a very high degree of risk involved in trading. Any information and/or content is intended entirely for research, educational and informational purposes only and does not constitute investment or consultation advice or investment strategy. The information is not tailored to the investment needs of any specific person and therefore does not involve a consideration of any of the investment objectives, financial situation or needs of any viewer that may receive it. Kindly also note that past performance is not a reliable indicator of future results. Actual results may differ materially from those anticipated in forward-looking or past performance statements. We assume no liability as to the accuracy or completeness of any of the information and/or content provided herein and the Company cannot be held responsible for any omission, mistake nor for any loss or damage including without limitation to any loss of profit which may arise from reliance on any information supplied by Everest Fortune Group.

Bearish drop off?EUR/USD is reacting off the resistance level which is an overlap resistance that is slightly below the 23.6% Fibonacci retracement and could drop from this level to our take rpofit.
Entry: 1.1622
Why we like it:
There is an overlap resistance that is slightly below the 23.6% Fibonacci retracement.
Stop loss: 1.1669
Why we like it:
There is a pullback resistance that is slightly above the 50% Fibonacci retracement.
Take profit: 1.1560
Why we like it:
There is a pullback support level.
Enjoying your TradingView experience? Review us!
Please be advised that the information presented on TradingView is provided to Vantage (‘Vantage Global Limited’, ‘we’) by a third-party provider (‘Everest Fortune Group’). Please be reminded that you are solely responsible for the trading decisions on your account. There is a very high degree of risk involved in trading. Any information and/or content is intended entirely for research, educational and informational purposes only and does not constitute investment or consultation advice or investment strategy. The information is not tailored to the investment needs of any specific person and therefore does not involve a consideration of any of the investment objectives, financial situation or needs of any viewer that may receive it. Kindly also note that past performance is not a reliable indicator of future results. Actual results may differ materially from those anticipated in forward-looking or past performance statements. We assume no liability as to the accuracy or completeness of any of the information and/or content provided herein and the Company cannot be held responsible for any omission, mistake nor for any loss or damage including without limitation to any loss of profit which may arise from reliance on any information supplied by Everest Fortune Group.

USDJPY: Will Start Falling! Here is Why:
The charts are full of distraction, disturbance and are a graveyard of fear and greed which shall not cloud our judgement on the current state of affairs in the USDJPY pair price action which suggests a high likelihood of a coming move down.
Disclosure: I am part of Trade Nation's Influencer program and receive a monthly fee for using their TradingView charts in my analysis.
❤️ Please, support our work with like & comment! ❤️

Dollar Index (DXY): New Bullish Wave Confirmed?!
Here a quick follow-up for my recent idea for Dollar Index.
The price retested a recently broken major horizontal structure cluster
and even went below that with a bearish trap.
A rising trend line was respected as a strong vertical support
and we see a bullish continuation now.
I think that we can expect a rise at least to 99.3 level now.
❤️Please, support my work with like, thank you!❤️
