Gold Extends Its Downward Pressure Amid Clouded MomentumHello everyone, I see gold still holding its downward pace after forming a top around 4,230–4,250 USD/oz, now hovering near 4,030 USD/oz — trading below the Ichimoku cloud and squeezed between several unfilled Fair Value Gaps, signalling that the market may be rebalancing liquidity before choosing a clearer direction. After the strong surge earlier this month, corrective pressure has returned, pushing price toward the short-term support zone at 4,000–3,980 USD/oz — an area that overlaps with previous green FVGs and where buying reactions typically appear. On the upside, 4,070–4,100 USD/oz has turned into a key resistance region where price has repeatedly attempted to break but failed. Only a decisive breakout above this zone would restore the short-term bullish structure; otherwise, losing 3,980 could open the door for further downside.
On the news front, gold continues to face weight from fading expectations of a Fed rate cut next month, a strengthening US dollar, and the return of risk-off sentiment, all of which leave the metal struggling for momentum. The probability of a 25-basis-point cut, according to CME FedWatch, has sharply fallen from 61.9% to 39.8%, while the likelihood of unchanged rates has climbed to 60.2%. This extends the pressure on gold — a non-yielding asset — while the dollar benefits more clearly. The prolonged government shutdown in the US has also delayed key inflation and labour reports for October, leaving the Fed with less evidence to support a firmer forward-guidance message. Meanwhile, Chair Powell’s cautious stance reinforces the view that higher rates will persist for longer, adding further strain to gold.
Based on both technical and macro factors, I feel this could be gold’s final corrective phase before the market finds equilibrium again. I expect price to ease toward 3,990–3,970 USD/oz to “test” liquidity — an area where demand historically returns. If buyers step in as before, gold could rebound toward 4,100–4,150 USD/oz, and once above 4,150, the next target expands toward 4,200–4,250 USD/oz.
M-forex

XAUUSD: Light Downtrend, Targeting Lower LevelsGold prices declined during the Asian trading session on Tuesday, continuing the recent downtrend. The weakening confidence in the Federal Reserve's potential rate cut in December has provided strong support for the US dollar , putting pressure on gold and other non-yielding assets. Furthermore, the caution ahead of the delayed September non-farm payroll report, expected to be released this week, is also benefiting the US dollar and driving gold prices lower.
On the chart, we can see that gold is currently moving within a mild downtrend, with a price structure forming a “cup and handle” pattern, setting up for a possible pullback. The resistance level at 4,120,000 USD is quite strong, and if the price fails to break this level, gold is likely to continue its decline toward the next support levels around 4,080,000 USD and 4,000,000 USD.
In particular, the support zone near 4,000,000 USD is a key area to watch, where prices may bounce if selling pressure is not too strong. However, given the current downtrend, the potential for further declines below 4,000,000 USD is highly probable.
Trade Strategy Recommendations:
Sell: If gold fails to break the resistance at 4,120,000 USD and continues to decline, consider opening a sell position with targets near 4,080,000 USD and 4,000,000 USD.
Buy Against the Trend: Consider short-term buy orders if gold rebounds from the 4,000,000 USD support zone, but only trade with low risk and within a short time frame.
Be sure to closely monitor the important resistance and support levels , particularly around 4,080,000 USD and 4,000,000 USD, to make accurate trading decisions.

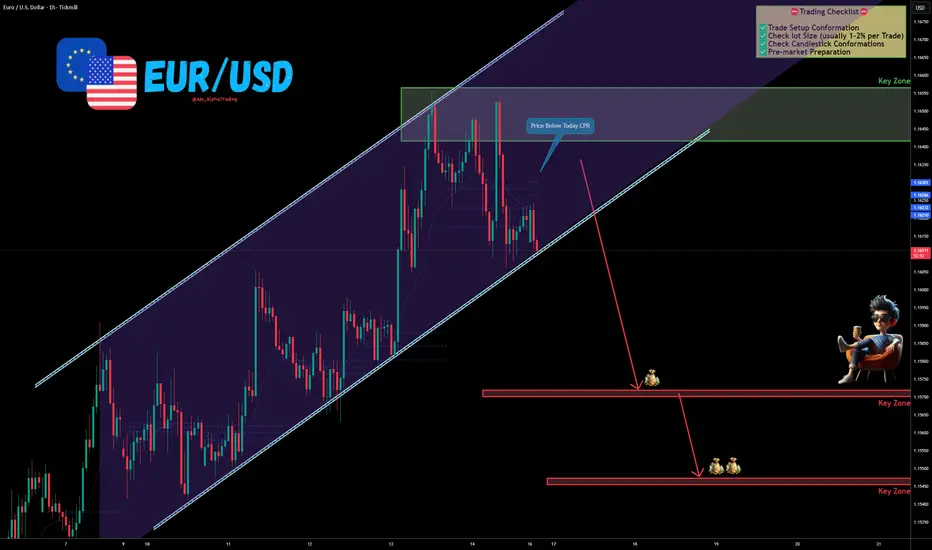
EUR/USD – Channel Breakdown Possibility | CPR Rejection Signals The EUR/USD Pair, Price has been trading within a Channel Pattern on the H1 chart, forming consistent lower highs and lower lows. Price action is now testing the lower boundary of the pattern, signalling a possible breakdown.
✅Market Context:
1️⃣Downward structure building inside the pattern.
2️⃣Sellers are showing strength near support levels.
3️⃣Breakdown below the trendline indicates momentum continuation toward lower zones.
✅Trade Plan:
Entry: Sell after confirmed breakdown below the support (Candle close below trendline or retest of the breakout).
💰Take Profit (TP): At the Key Zone – major support area identified ahead.
🛑Stop Loss (SL): Above the pattern structure / recent swing high.
✅Psychological Discipline:
1️⃣Stick to plan – No Revenge Trades.
2️⃣Accept losing trades as part of the strategy.
3️⃣Risk only 1–2% of your account balance per trade.
✅ Support this analysis with a
LIKE 👍 | COMMENT 💬 | FOLLOW 🔔
It helps a lot & keeps the ideas coming!
⚠️ Disclaimer: This analysis is for educational purposes only and does not constitute financial advice. Forex trading involves high risk. Trade only with capital you can afford to lose and always do your own research.
EURJPY FREE SIGNAL|LONG|
✅EURJPY broke cleanly above the key level with strong bullish displacement, confirming a shift in orderflow. A retracement into the breakout zone can offer premium entry before targeting the inefficiency above.
—————————
Entry: 180.071
Stop Loss: 179.785
Take Profit: 180.499
Time Frame: 2H
—————————
LONG🚀
✅Like and subscribe to never miss a new idea!✅

GBP/USD, GBP/CAD, GBP/AUD Techical SetupsUK CPI data in 8hrs could spark some volatility across British pound pairs. Even so, price action has presented several bearish clues across GBP/USD, GBP/CAD and GBP/AUD.
Matt Simpson, Market Analyst at City Index

EURCAD testing weekly SMA on 1H oversold RSIAs per subject, standard simple setup, EURCAD testing the weekly 20SMA on an oversold RSI on hourly. Also hitting the top of FVG created on Sept 5th. Nothing is certain. Tight SL.

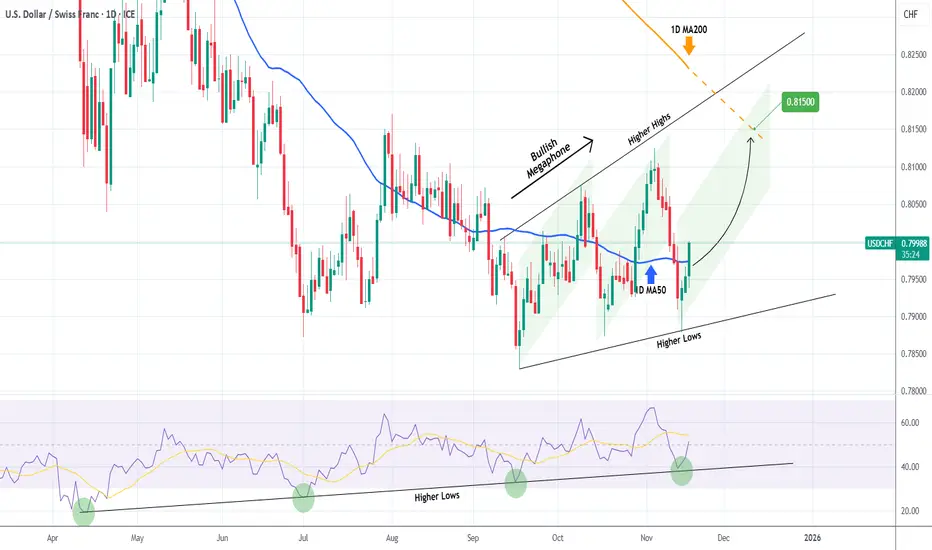
USDCHF Megaphone started its new Bullish Leg.The USDCHF pair has been trading within a 2-month Bullish Megaphone that was initiated after the huge 1D RSI Bullish Divergence of Higher Lows caused a market bottom in September and the price flipped the Lower Lows to Higher Lows and started rising.
Having broken above its 1D MA50 (blue trend-line) today, the new Bullish Leg has been confirmed and we expect it to make contact with the 1D MA200 (orange trend-line) around 0.81500.
---
** Please LIKE 👍, FOLLOW ✅, SHARE 🙌 and COMMENT ✍ if you enjoy this idea! Also share your ideas and charts in the comments section below! This is best way to keep it relevant, support us, keep the content here free and allow the idea to reach as many people as possible. **
---
💸💸💸💸💸💸
👇 👇 👇 👇 👇 👇
GBPAUD has formed a double top.GBPAUD - 24h expiry
Posted a Double Top formation.
We look for a temporary move higher.
The bearish engulfing candle on the 4 hour chart is negative for sentiment.
The overnight rally has been sold into and there is scope for further bearish pressure going into this morning.
Risk/Reward would be poor to call a sell from current levels.
We look to Sell at 2.0305 (stop at 2.0381)
Our profit targets will be 2.0085 and 2.0045
Resistance: 2.0260 / 2.0343 / 2.0400
Support: 2.0150 / 2.0100 / 2.0030
Risk Disclaimer
The trade ideas beyond this page are for informational purposes only and do not constitute investment advice or a solicitation to trade. This information is provided by Signal Centre, a third-party unaffiliated with OANDA, and is intended for general circulation only. OANDA does not guarantee the accuracy of this information and assumes no responsibilities for the information provided by the third party. The information does not take into account the specific investment objectives, financial situation, or particular needs of any particular person. You should take into account your specific investment objectives, financial situation, and particular needs before making a commitment to trade, including seeking, under a separate engagement, as you deem fit.
You accept that you assume all risks in independently viewing the contents and selecting a chosen strategy.
Where the research is distributed in Singapore to a person who is not an Accredited Investor, Expert Investor or an Institutional Investor, Oanda Asia Pacific Pte Ltd (“OAP“) accepts legal responsibility for the contents of the report to such persons only to the extent required by law. Singapore customers should contact OAP at 6579 8289 for matters arising from, or in connection with, the information/research distributed.

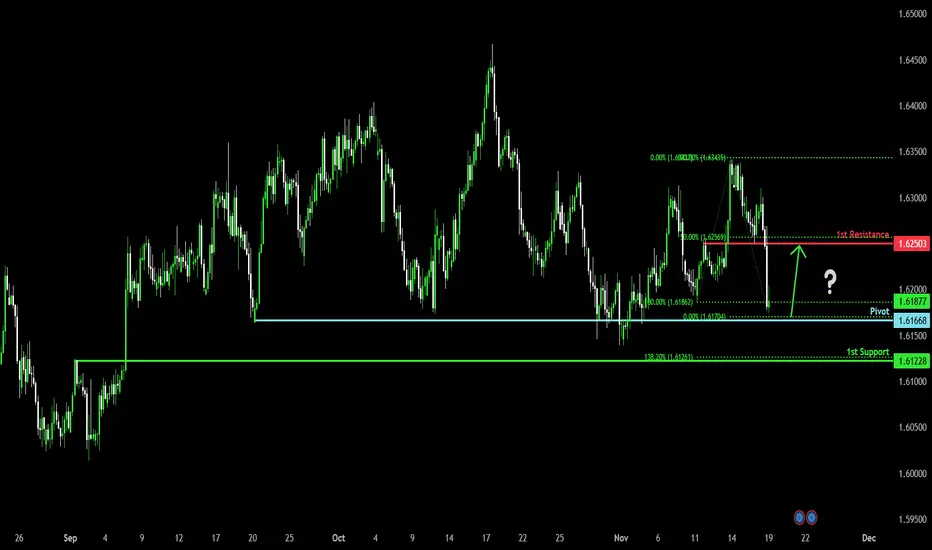
Bullish reversal setup?EUR/CAD is currently reacting off the pivot and could reverse to the 1st resistance.
Pivot: 1.61786
1st Support: 1.61228
1st Resistance: 1.62503
Disclaimer:
The opinions given above constitute general market commentary and do not constitute the opinion or advice of IC Markets or any form of personal or investment advice.
Any opinions, news, research, analyses, prices, other information, or links to third-party sites contained on this website are provided on an "as-is" basis, are intended to be informative only, and are not advice, a recommendation, research, a record of our trading prices, an offer of, or solicitation for, a transaction in any financial instrument and thus should not be treated as such. The information provided does not involve any specific investment objectives, financial situation, or needs of any specific person who may receive it. Please be aware that past performance is not a reliable indicator of future performance and/or results. Past performance or forward-looking scenarios based upon the reasonable beliefs of the third-party provider are not a guarantee of future performance. Actual results may differ materially from those anticipated in forward-looking or past performance statements. IC Markets makes no representation or warranty and assumes no liability as to the accuracy or completeness of the information provided, nor any loss arising from any investment based on a recommendation, forecast, or any information supplied by any third party.
Bullish momentum to extend?CAD/JPY is falling towards the pivot, which has been identified as a pullback support and could bounce to the 1st resistance, which aligns with the 100% Fibonacci projection.
Pivot: 110.59
1st Resistance: 112.07
1st Support: 109.83
Disclaimer:
The opinions given above constitute general market commentary and do not constitute the opinion or advice of IC Markets or any form of personal or investment advice.
Any opinions, news, research, analyses, prices, other information, or links to third-party sites contained on this website are provided on an "as-is" basis, are intended to be informative only, and are not advice, a recommendation, research, a record of our trading prices, an offer of, or solicitation for, a transaction in any financial instrument and thus should not be treated as such. The information provided does not involve any specific investment objectives, financial situation, or needs of any specific person who may receive it. Please be aware that past performance is not a reliable indicator of future performance and/or results. Past performance or forward-looking scenarios based upon the reasonable beliefs of the third-party provider are not a guarantee of future performance. Actual results may differ materially from those anticipated in forward-looking or past performance statements. IC Markets makes no representation or warranty and assumes no liability as to the accuracy or completeness of the information provided, nor any loss arising from any investment based on a recommendation, forecast, or any information supplied by any third party.

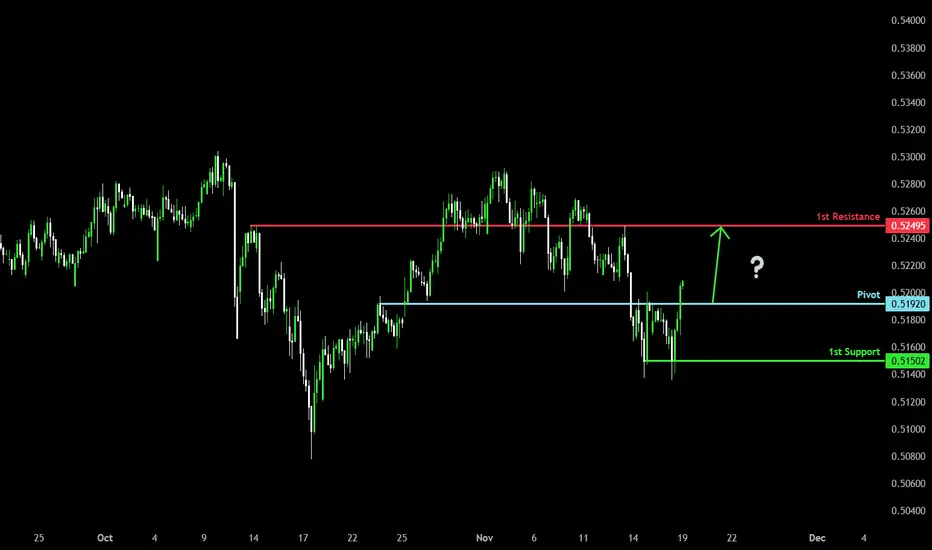
Bullish reversal?AUD/CHF could make a short-term pullback to the pivot, which acts as an overlap support, and could bounce to the 1st resistance.
Pivot: 0.51920
1st Resistance: 0.52495
1st Support: 0.51502
Disclaimer:
The opinions given above constitute general market commentary and do not constitute the opinion or advice of IC Markets or any form of personal or investment advice.
Any opinions, news, research, analyses, prices, other information, or links to third-party sites contained on this website are provided on an "as-is" basis, are intended to be informative only, and are not advice, a recommendation, research, a record of our trading prices, an offer of, or solicitation for, a transaction in any financial instrument and thus should not be treated as such. The information provided does not involve any specific investment objectives, financial situation, or needs of any specific person who may receive it. Please be aware that past performance is not a reliable indicator of future performance and/or results. Past performance or forward-looking scenarios based upon the reasonable beliefs of the third-party provider are not a guarantee of future performance. Actual results may differ materially from those anticipated in forward-looking or past performance statements. IC Markets makes no representation or warranty and assumes no liability as to the accuracy or completeness of the information provided, nor any loss arising from any investment based on a recommendation, forecast, or any information supplied by any third party.
Bullish bounce off key support?NZD/CHF is falling towards the pivot, which has been identified as an overlap support and could bounce to the 1st resistance.
Pivot: 0.45145
1st Support: 0.44964
1st Resistance: 0.45571
Disclaimer:
The opinions given above constitute general market commentary and do not constitute the opinion or advice of IC Markets or any form of personal or investment advice.
Any opinions, news, research, analyses, prices, other information, or links to third-party sites contained on this website are provided on an "as-is" basis, are intended to be informative only, and are not advice, a recommendation, research, a record of our trading prices, an offer of, or solicitation for, a transaction in any financial instrument and thus should not be treated as such. The information provided does not involve any specific investment objectives, financial situation, or needs of any specific person who may receive it. Please be aware that past performance is not a reliable indicator of future performance and/or results. Past performance or forward-looking scenarios based upon the reasonable beliefs of the third-party provider are not a guarantee of future performance. Actual results may differ materially from those anticipated in forward-looking or past performance statements. IC Markets makes no representation or warranty and assumes no liability as to the accuracy or completeness of the information provided, nor any loss arising from any investment based on a recommendation, forecast, or any information supplied by any third party.

WE CAN HOLD OUR POSITIONEUR/USD has remained in a downtrend and is using bullish order blocks only for short-term corrections. However, its downward movement isn't very stable due to the low number of sell orders. This week, the EUR/USD and GBP/USD pairs are stuck in a temporary correction, so we need to be cautious about corrective moves.
If you've been in the downtrend from the beginning, you can secure part of your profit here and set the rest of your position to risk-free

NZDCHF STRONG BREAKOUT|LONG|
✅NZDCHF broke above the 2H demand, taking sell-side liquidity and showing strong bullish displacement. With structure shifting upward, price is likely to extend toward the buy-side liquidity resting at the marked target zone.Time Frame 2H.
LONG🚀
✅Like and subscribe to never miss a new idea!✅

USDJPY Vulnerable to Deep Pullback After Wave 5USDJPY has completed a full 5-wave rising structure inside a clear wedge pattern, which usually signals exhaustion. The final Wave (5) shows weakening momentum, and price is beginning to slip below the wedge support — an early sign that the trend may be reversing. This suggests the pair is likely entering a deeper corrective decline, potentially retracing toward 150 or lower in an impulsive A-B-C move. In simple terms: uptrend looks tired → wedge breakdown could trigger a strong downside correction.
Stay tuned!
@Money_Dictators
Thank you :)

EUR-GBP Free Signal! Sell!
Hello,Traders!
EURGBP rejected the horizontal supply after collecting buy-side liquidity. With bearish order flow and displacement confirmed, price is expected to drive lower toward the sell-side liquidity at the marked take-profit zone
--------------------
Stop Loss: 0.8830
Take Profit: 0.8792
Entry Level: 0.8815
Time Frame: 3H
--------------------
Buy!
Comment and subscribe to help us grow!
Check out other forecasts below too!
Disclosure: I am part of Trade Nation's Influencer program and receive a monthly fee for using their TradingView charts in my analysis.
