Chainlink Update once again Looking at the RSI Updated from my ealier 2 post we are officially in the sell region on the 1h chart now you can either wait it out a little longer or sell the choice is yours although note the MACD is indicating uptrend still so i personally will hold till the RSI is 60 or higher however if you boughht in my earlier buy signal you should have made a decent trade.
Thumbs up comment opinions
Macdcross

Follow the RSI on on 1h Chainlink Update on last Post, For everyone checking out my charts if you caught the buy signal i last posted on LINK this new update is when to sell. Any where in this area of the RSI will be a good sell signal no bearish divergence for chainlink dont sleep on it. the goal is to buy low sell high this bull run has officially started profit as much as you can.
Also if we look at the MACD Chainlink is about to have a Golden Cross for a short term uptrend from the buy signal i posted earlier
for long term holders in Chainlink keep stacking it will shoot to the moon as well in my opinion do your own research though, i get it LINK has been performing terribly the past week almost 2 weeks now
if you like my charts hit the thumbs up been trading for months now had to learn a lot now i will be posting ideas i will update on BTC and also ETH later tonight possibly

Interesting buy opportunity for LTCUSDT, 1hThere is pretty strong support on S1 for LTCUSDT. Price tried to break it for 4 days and no luck.
Now it can be an interesting buying opportunity at bullish MACD cross.
1st target - 44
2nd target - 45.5
Disclaimer
Please remember that past performance may not be indicative of future results.
Due to various factors, including changing market conditions, the strategy may no longer perform as good as in historical backtesting.
This post and/or the script don’t provide any financial advice.

Selling opportunity for EURGBP, 4hEURGBP has a pretty strong resistance on the R2 level, the price failed to break it for some time.
RSI also is pretty overbought now, close to 70.
It seems like on MACD cross it can be a pretty good short trade.
1st target: 0.90
2nd target: 0.89
Disclaimer
Please remember that past performance may not be indicative of future results.
Due to various factors, including changing market conditions, the strategy may no longer perform as good as in historical backtesting.
This post and/or the script don’t provide any financial advice.

Selling opportunity for USDCHF, 1hUSDCHF failed again to break the S1 Fibonacci level so we have a pretty strong resistance at this level. Now we have MACD bearish cross so it might be a pretty good short trade.
1st target level - S2 ~ 0.938
2nd target level - S3 ~ 0.934
Disclaimer
Please remember that past performance may not be indicative of future results.
Due to various factors, including changing market conditions, the strategy may no longer perform as good as in historical backtesting.
This post and/or the script don’t provide any financial advice.

Short opportunity for LTCBTC, 1hIt seems like we have resistance at R3 Fib Pivot Points for LTCBTC at 1h chart.
We also have a bearish cross on MACD. So I expect the price to decline to R2 or R1 level.
Disclaimer
Please remember that past performance may not be indicative of future results.
Due to various factors, including changing market conditions, the strategy may no longer perform as good as in historical backtesting.
This post and/or the script don’t provide any financial advice.

GOLDEN CROSS ON DAILY CHARTBULLISH GOLDEN CROSS OPPORTUNITY ON SILVER. THIS MOVE CORRESPONDS WITH MASSIVE INVERSE HEAD AND SHOULDERS ON GDXJ (MONTHLY CHART). EXPECTING SILVER TO TARGET 24 AND JUNIOR MINING STOCKS TO RESPOND ACCORDINGLY.

LONG Asian Paints Intraday BTSTLong Asian Paint Indicator based Buying MACD breakout Target SL on Chart
For monitoring educational purpose
Trade on your own Risk

$TMBR looking great for a quick breakout!AMEX:TMBR
Looking like a great setup to break out after Earnings!
hitting the 0.382 fib level
signal crossing on the MACD
we've hit a few solid waves of trending down for a little over a month
I'm not thinking this breakout will be a longstanding rally, but definitely opened a few positions to try and take advantage of the possible pump & dump.
Happy Trading!
TLong

MACD Indicator strategy to Increase Winnings(Beginners Friendly)Hi friends, today I bring you an educational video on how to us the MACD secret strategy to catch and filter trend signals.
Thanks for constantly supporting use with your likes and follows
QUICK RECAP OF THE STRATEGIES:
MACD HISTOGRAM:
*How to find and anticipate the MACD Signal cross before they happen,
*How to use the histogram to predict Strong trend reversals
*How to calculate the MACD
*EASILY Confirm consolidation breakouts
THE LAST ASPECT OF THE VIDEO
please note:
The last aspect of the video is how to use the TREND FILTER for BUY & SELL Signals
to do this you will need to use the Higher timeframe for your entry.
Using these two important criterial:
1, If higher timeframes MACD line crosses ABOVE the Signal line this shows that buyers are in control =BUY/ LONG Bias
2, If higher timeframes crosses BELOW the Signal Line , this means the Bears has taken power over the market = SELL/SHORT Bias
so in other words,
*if you trade 1Day Chart Timeframe, you will use the WEEKLy chart Timeframe to find MACD Cross for your entry.
*If you trade 4Hours Chart Timeframe, You will use the DAILY chart Timeframe to find MACD cross for your entry
*if you use 1Hr chart Timeframe, you will use the 4HOURS chart timeframe to find MACD cross for your entry
Thanks for liking and your support. You can join the MFT house to improve and polish your trading skills for free.

Eur is bullish until 1.13445we can see regular divergence(+RD) also candles show that EURUSD is bullish until the resistant line

USDCAD Long H1MACD Divergence
Fibonachi Retracments on 0.5
MACD Cross Over
DXY Bullish
Camarila Pivot is Tighter than yesterday

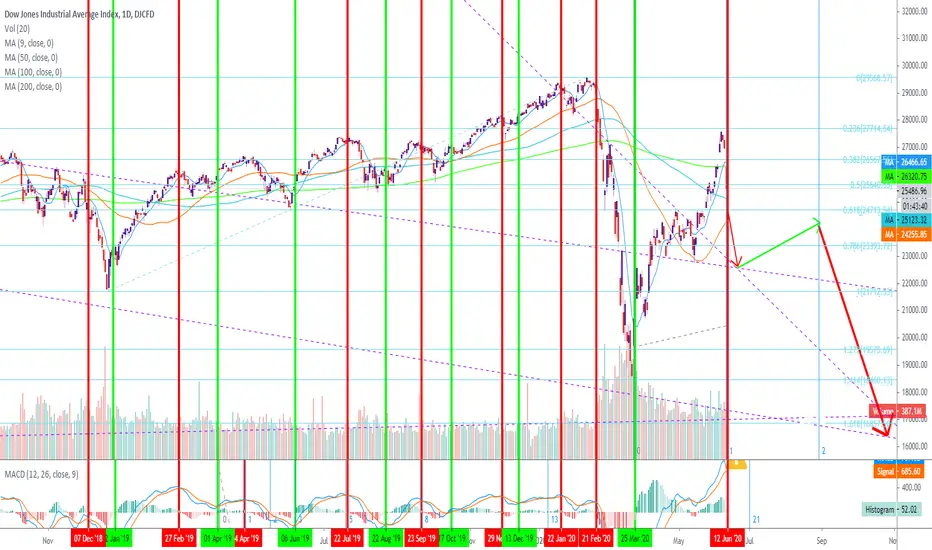
DOW JONES INDUSTRIAL AVG -DROP TO 17,000 POSSIBLE BY END OF 2020WE SHALL SEE. HOPEFULLY THIS TURNS OUT DIFFERENTLY
TVC:DJI

SPCE to ~$20, then $24+Price is currently in a upwards trending channel with a Doji candle off support and 21MA on the daily chart with volume after a downtrend period
There is also a nice Bullish engulfing off support on 4H (current chart) which tests the 8MA (green line). Zooming a bit further in, there is a Bullish harami candlestick pattern off the 50MA (purple line) on the 3H chart!!
MACD also crossed up on the 1H while 8MA is still hovering below the 21MA, which in my experience signals a reversal in the direction of the MACD cross; in this case a reversal to the upside.
All signs point to a run up.

MACD line breaking above the signal line faster than usual?Usually, when the MACD line breaks through the signal line the stock goes up until the lines crosses back over, coming down, therefore I have reason to believe this will continue with the momentum.

BTC MONTH VIEW MACD SELL SIGNALAll traders to alert.
Bitcoin has just hit a sell signal on the month view.
DI- about to cross DI+.
Watch the squeeze carefully on shorter time-spans for entry into a short position.
-dysonring2050

ABBV ParabolicABBV has formed a parabolic uptrend, with the presence of a falling wedge, which has led to a major bullish breakout, however still within the parabolic trend range. MACD also indicates a reversal taking place.

MACD CrossImpending cross on MACD weekly, I believe the bottom is in. We are now in the accumulation phase in marijuana stocks. All the big name players are heavily discounted, mostly due to overproduction in the last quarter.
This is one of the best Marijuana ETFs out there, much more stable than the concentrated growers ETFs.

rising wedge for the CablePrice is approaching a trendline but we can see a MACD DIVERGENCE in H4 timeframe, if price will break the wedge I will open a sell position; great oppportunity; price could push as low as 1.2285.
Look at daily timeframe using bollinger bands; in my opinion price could reach medium band (around 1.225).
wait to open a sell order

THE FALL OF THE POUND... ARE YOU ON THE RIGHT SIDE? THIS IS A CONTINUATION OF THE SETUPS STARTED THIS WEEK..... CAN'T TYPE LONG AS MARKETS ARE MOVING....
WHATS TO KNOW....
-BULLS WHO HELD TOO LONG ARE TRAPPED WITH THAT BIG CURRENT WICK ON THE 4HR
- IM LOOKING FOR A CLOSE BELOW THE CRITICAL AREA... (MIGHT USE THE HOURLY FOR ENTRY BECAUSE OF THE SPEED OF MARKET)
- BUT ANY TRADES FROM HERE DOWN WITH STOPS ABOUT THE HIGHS AIMING AT THE LOWS 1.19 COULD BE MORE ILL KEEP UPDATING ...
GOOD CONFIRMATIONS
-STOCH DIVERGENCE AND COMING OFF THE TOP
- MACD CROSS
OBSTACLES
-21 EMA (RED) WHERE BULLS MAY TRY AND JUMP BACK IN....
I HOPE THEY DO PROVIDE ANOTHER ENTRY AND RETRACE
-WILD NEWS
IF YOU ARE STILL A BULL.... THANK YOU FOR YOUR HELP
WE COULDN'T HAVE TRAPPED WITHOUT YOU....
HAPPY HUNTIN' HAPPY TRAPPIN'
BOOBII

Renko MACD and Renko MACD Trend IntroductionI introduce the Renko MACD and Renko MACD Trend indicators.
Other indicators powered by the Renko Engine:
Renko RSI
Renko Trend Momentum
Renko Weis/Ord Wave Volume
Strategies:
RSI-RENKO DIVINE Strategy
