BTCUSDT 1D | Bitcoin price overview: Continious growthIn our previous review of the Bitcoin daily chart from April 17, we considered the scenario of continuing growth with a target of $7,800 - $8,000.
The maximum that the price showed today is $7,738. This is close to the growth target price. Currently, the price is $7,520, and the market is still bullish. The first conclusions about the continuation or the end of the growth can be made by the candle shape after it closes.
The MACD indicator works out the third falling peak with a consecutive rise in the price, at the moment its indicators indicate a continuation of growth.
Stay with us and subscribe to the channel!
Macdivergence

O que será que as Bandas de Bollinger irão fazer a seguir?!No gráfico com velas de 4 horas, estou reparando uma indicação de baixa no MACD, ao passo que as Bandas de Bollinger estão se estreitando, e o preço está usando a Média Móvel (linha vermelha central das bandas azuis) como suporte!
Sempre que as Bandas de Bollinger se estreitam de forma convergente como está acontecendo, é sinal de que um movimento relativamente grande está prestes a acontecer!
Vou manter o olho aberto pra ver o que acontece nas próximas 12-24 horas, especialmente porque o MACD do gráfico com velas diárias está indicando força de alta!
Pra que direção vocês diriam que o movimento do preço tem mais probabilidade de seguir?
AVISO LEGAL: conteúdo com proósito de informação, e não deve ser considerado conselho financeiro.

The Pink Super MoonIs extreme volatility what you're looking for?
Perhaps the Pink Super Moon will bring you, your dream fulfillment to catch that dip one more time before we launch off into halving!

Análise da IBOVESPA em meio à pandemia COVID-19Olá pessoal
Nesse vídeo eu fiz uma análise da IBOVESPA, comparando a relação entre o MACD e o preço na crise de 2008 e fazendo uma previsão para o que seguirá daqui em diante. Também fiz uma análise da relação do preço com a média móvel de 200 dias.
O mercado brasileiro, na minha opinião, ainda não terminou a sua recessão.
AVISO LEGAL: o conteúdo que eu posto não é conselho financeiro e não deve ser usado como conselho, é direcionado para informação e entretenimento.

TOTAL2 macd divergenceI find it is often good to use different indicators to pick up on things that you might have missed. In this case its a bullish divergence on the macd. This is the weekly chart. Indicators like the macd, rsi are used to identify divergences in trends.

27.02.20 NZD USD H4 ShortNZD USD Timeframe H4. Buy 0.63265 SL 0.62790 TP 0.64415. Daily trend still is downtrend. However, as per current condition, price is hovering around daily resistance area. TF H4 also have falling wedge, MACD divergence and stochastic oversold. TP is based on EMA 200.
Risk to reward 1:2.5
Disclaimer on
May the Pips be with you :)

NASDAQ 100 comparison NOW to Feb-Mar 2000 Dot-com Crash!OANDA:NAS100USD
TVC:NDX
NASDAQ:QQQ
This historical review of the Dot-com crash is instructive to compare to price action now to then.
As noted in my last NASDAQ idea (just posted - see link below), the MACD diverged strongly in Feb-Mar 2000 on the way up before the Dot-com crash began.
MACD is rising with prices now and has not shown any divergence.
This again means the current drop is just a correction and not the start of THE bubble burst/crash.
New highs are coming after the correction is over.
Good luck everyone :)

GOGO - bottoming is almost done?For the last 6 months NASDAQ:GOGO is consolidating in what appears to be bullish flag.
Right now price is close to multiple support levels, and with healthy MACD divergence, reasonable to expect potential bottom around current area soon enough. Thus long entry might be attempted.

short term ETH shortWe may see a correction similar to that of mid january...
price topped out with an RSI and MACD bearish divergence
entry: 223.98
target: 196.02
stop: 233.16
3 R
UIOGD - JMJ
Travis

NZDUSD long trade on MACD divergence NZDUSD trade on MACD divergence. all the requirements of of my strategy were met

Dow Jones buy set upThe price has formed 3 impulsive waves so we are expecting the next two within the guidance of the Fibo extension.
We are expecting the pullback due to the RSI and MACD divergence.
Comment your thoughts

EURUSD Hidden Divergence 4H ChartPrice with higher lows while MACD has lower lows.
Enter long after market opens.

CAD/JPY: Day-Swingtrade-OpportunityHey tradomaniacs,
welcome to another free signal!
Important: Wait for the retracement back to trendline and sell either below neckline or at our entry after rejection.
-----------------------------
Type: Swingtrade
Market Sell: 83,400
Stop-Loss: 83,885
Target 1: 82,770
Target 2: 82,460
Target 3: 82,230
Stop-Loss: 48.5 pips
Risk: 1-2%
Risk-Reward: 2,68
Risk: 1-2%
Risk-Reward: 2,5
-----------------------------
LEAVE A LIKE AND A COMMENT - I appreciate every support! =)
Peace and good trades
Irasor
Wanna see more? Don`t forget to follow me.
Any questions? PM me. :-)

BTCUSD 30M MACD ANALYSIS Here is a simple macd indicator showing the next support and resistance triangulation setup.
Support is showing solid bullish divergence (green line) against a normal looking resistance trend line (red line)
I'm bullish on bitcoin simply because of the mining halving. Doesn't mean the bulls will win here.
But what it does mean is that you can set yourself up for a great entry point - whether you are bullish or bearish - and minimize the risk/exposure zone which is key to being a successful trader.
Fakeouts are always a possibility. So it's vital to find good entries that can allow you to protect your position with minimal negative stop loss.
Set alerts on trend lines and let tradingview work for you


USDCAD LONG IDEAConfirmations for Long.
1. previous demand zone
2. MacD divergence
3. Potential pin bar on the 4H TF, wait for 4H candle to close for final confirmation

Let's Flip a Bitcoin Issue #4 SKHello Ladies and Gentlman,
I am here to present to you all Satoshi's Kode. My latest and likely my most finest signal.
Embedded into the chart there is a secret language that only few know. I am here to provide you a small taste of it's unbelievable functionality.
Using Signal Analysis we are able to decrypt the signal and generate the most probable outcome for the latest formation. Please pass the message onto the next. Satoshi's Kode is fact, it is inevitable, it accounts for specific time key, price, and spacial approximation.
Take Profit: $6,100 Price Per Bitcoin.
Entry: December 20th - 22th, 2019
Exit: January 20th - 2019.
We'll review the results of this trade signal on the premier of our web series: Let's Flip a Bitcoin: Season 2 on 12/31/2019 via Instagram TV.

BTCUSD 4H - HIDDEN S/R DIVERGENCE - MACD ANALYSIS $BTC.X S/R zones based on slow MACD filter. I'm post this update to allow you to compare with my recent more conservative 8H MACD analysis.
Buy Zones are just above support trend lines. Stop loss zones are just under support trend lines.

Let's Flip a Bitcoin Issue #2.5 Extended PlayContract: XBTUSD
Exchange: BitMex
Trade Tag: #LFBTC0001
Trade Signal: Bearish Pennant
_________________
Trade Type: (Short)
Trade #1 single
4-hour time frame UTC -8
Scheduled execution: 8:00 AM
_________________
* Capital: 1-5%
* Leverage: Cross
* Open: ($8,550)
_________________
Single Bid
_________________
Stop Loss: $8590
_________________
Target Points:
_________________
TP 1||$8,000 - (50%)
TP 2||$7950 - (10%)
TP 3||$7900- (15%)
TP 4||$7850 - (20%)
TP 5||$7800- (5%)
Risk Assessment: low
_________________
L.F.B.T.C TM

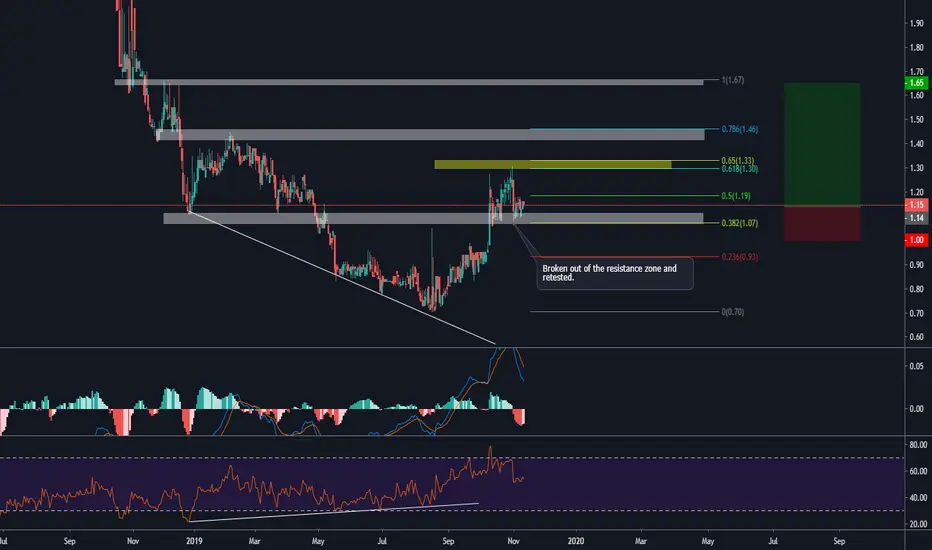
EVOL : Phase 2 of break out strategy Technical analysis on Evolving system. It is looking very good with break out of the previous resistance and retesting it again as the confirmation of support. This is known as the phase 2 of break out strategy (which is a good entry for long position). And if we combine with the fibonacci retracement levels, the key levels such as 78.6 and 38.2 has the alignment with previous swing high or low, the golden pocket region itself acts as a shadow resistance where the previous break out wave topped at this levels with precision.
The target will be around 1.4 and 1.65 with the SL at $1 which will produce the 3.64 Risk to Reward ratio.
ELong
DIVERGENCE ON NZDCAD reversal? o divergence price to momentum
o head and shoulder pattern
o take profit levels are fib levels
o all NZD pairs show weakness and a consolidation
****risk management is essential in making thru this game, we aint like banks, our capital is limited so 2% risk per trade, ladies****

USD/JPY: Daytrade-Opportunity#SELLHey tradomaniacs,
welcome to another free signal of Week 42 Nr. 2
How to trade: Wait for the retest of the trendline and sell after rejection!
Type: Daytrade
Market Sell: 108,737
Stop-Loss: 108,958
Target 1: 108,450
Target 2: 108,315
Target 3: 108,159
-----------------------------
LEAVE A LIKE AND A COMMENT - I appreciate every support! =)
Peace and good trades
Irasor
Wanna see more? Don`t forget to follow me.
Any questions? PM me. :-)

ATOMBTC Bull scenarioChart speaks for itself.
The only invalidation will come is if price action goes below wave 2.
