On the NecklineI thought AVGO already broke through the neckline this morning, but now it's looking like we are right on it, depending on how you draw it. I think we're on it though.
AVGO has been extraordinarily weak, as far as Mag7 go.
META, MSFT, AAPL, also very weak.
I'm not buying puts on this currently, but a clear break of that neckline is compelling. Downside exposure is at least 10-15%.
Mag7

-15% in the next 1-2 monthsAAPL has been messing around in this bear flag for quite a bit.
Most of the Mag7 have broken down aside from Google.
Next major support on AAPL is not until 237....
Looking for the next leg down.
I'm honestly not sure "why" this is happening, which is more frightening long-term. Typically when there is a news event reason, the market prices it in and we continue up.
But, when markets flip without any reason, it means they know the reason but aren't telling the public because they need time to get out of the burning building while you're all eating the cake and getting fat.
If you are buying Mag7 stocks, SPY, QQQ right now.
You are a pig, getting fat, inside a burning building.

AAPL CRACK!AAPL just flashed its first CRACK! of this structure.
AAPL has moved from the upper trendline to the bottom more through time than price.
In my BKC (Bare Knuckle Charting) read, the real tell isn’t the crack… It’s the miss. The previous high couldn’t even tag the upper trendline. That’s subtle, but it’s a big signal of weakening momentum.
Then came the CRACK! at the bottom, confirming it.
Lastly, we have a mini Head & Shoulders formed at the top.
APPL is growing revenues at a rate of 1–2% per quarter, while the stock has been growing at a rate of 5–6% per quarter. That extra 3–4% per quarter is pure multiple & narrative expansion — which is exactly why cracks in charts start to appear.
I urge CAUTION to Bulls!
THANK YOU for getting me to 5,000 followers! 🙏🔥
Let’s keep climbing.
If you enjoy the work:
👉 Drop a solid comment
Let’s push it to 6,000 and keep building a community grounded in truth, not hype.

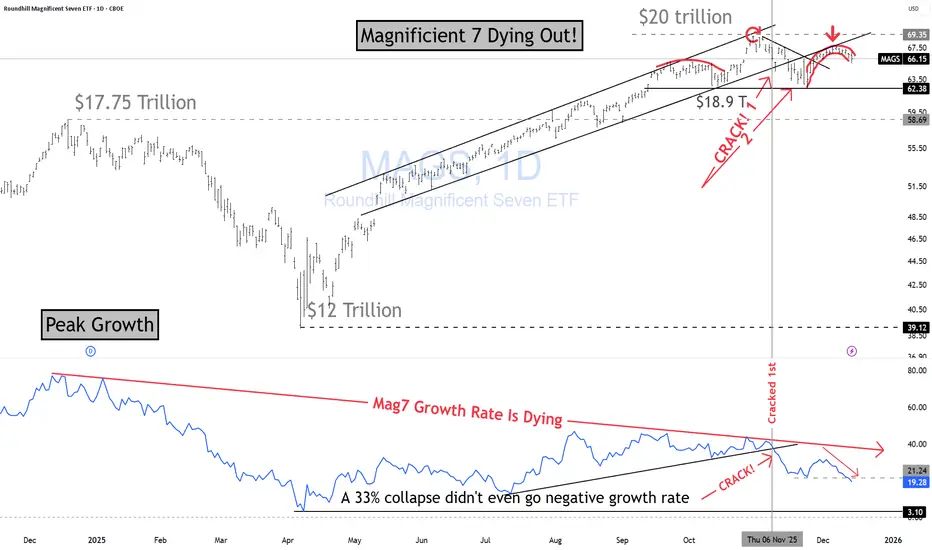
MAG7 Are Dying!Magnificent Seven Are Dying!
Here is why using my BKC method.
$20T in market cap. at $69.35
$18.9T Recent low
$17.7T Prior peak (Dec 24th)
$12T "Liberation Day" LOL! low (Apr 2025)
Growth Rate (Lower Panel)
• Growth rate peaked in Dec 2024 at ~85%.
• Since then, it has steadily deteriorated.
• Hit an all-time low of 3.1% around Liberation Day — even after a 33% drawdown, the rate never went negative! Imagine that! Where will price go when does go negative?
This is classic topping behavior: price making higher highs while growth momentum dies.
Price Structure (Upper Panel)
The Mag7 have been trading in a rising channel while the growth rate trends lower — a divergence setup.
Key structural points:
Head & Shoulders clearly formed at the top of the channel.
Red arrow circle marks the subtle but important failure: price couldn’t even touch the upper boundary of the channel → early weakness signal.
Crack #1: before the major breakdown.
Crack #2: Fri, Nov 7, 2025, confirmed again on Nov 13, 2025.
After that, price has been trading below the rising channel, confirming a structural shift.
Developing boomerang rejection: price returns to the channel underside and gets denied — classic failed-retest behavior.
Growth Rate Confirmation (Lower Panel)
The growth-rate panel confirms the sequence:
• The growth-rate crack showed up before the second price crack → momentum broke first, price followed.
This entire structure points to weakening upside momentum, failed retests, and a maturing top.
If you're still holding these names, ask yourself one thing:
What exactly are you waiting for?
• A 100% gain? That would require a $40T market cap.
• A 50% gain? That’s a $30T market cap.
Be honest with yourself: is that risk/reward realistic?
If you’re going to stay in this game, do it the right way.
Learn how to read a chart properly.
My goal is simple — to help you get better, think clearly, and avoid avoidable damage.
If you can’t see the massive head & shoulders, the major divergence, and the broken uptrend… I don’t know what to tell you.
All I can do is spark your curiosity and push you to do your own analysis.
THANK YOU for getting me to 5,000 followers! 🙏🔥
Let’s keep climbing.
If you enjoy the work:
👉 Drop a solid comment
Let’s push it to 6,000 and keep building a community grounded in truth, not hype.
Even The Most Accomplished Make Mistakes $Goog [Berkshire]Berkshire Hathaway made an entrance into the Mag 7 (Excluding Apple) with its purchase of Alphabet / Google I believe that this was a mistake solely based on the fact that the majority of the tech industry is extremely overvalued. While Googles Valuation at least in my opinion is justified considering how strong Its business model is with its High Margin Reoccurring Subscription models (Google Cloud),(YouTube Premium),(Google Workshop),(Google Play) to name a few and how Dominate it is in Ads with YouTube / Chrome. It also Dominates Web Search let alone the majority of people saying they will "Google something" it sounds stupid but its a good mental metric on how people think of search. Google has built Search / web ecosystem to complement each other and force you to use there services in one way or another you are using there web ecosystem everyday from Google maps, to Google Docs or Gmail, they made you dependent on there services, Especially the younger generation (GenZ) is growing very dependent on Google Maps which may be free but shows you the grip they have on peoples web use. The Primary issue I have with Berkshire Hathaway entering at these prices is generally the markets are indiscriminate if the mag 7 or tech industry has a red day no matter how strong Google may be that will bring them down too.
-----------------------
My Personal Thesis on Google:
I am very bullish on several areas of Alphabet Including but not limited to Google Cloud, YouTube, Its subscription Services, Its high Margin software business model. Most Importantly to me is There Robotics Section Deepmind and Gemini Robotics. Robotics is underappreciated and my personal belief is that it is the Next AI like boom but we are very early to this. Robotics has use cases in every industry from Solving lack of labor issues and an aging workforce / population especially in western countries Robots can easily pick up this slack and they will greatly benefit from Artificial intelligence Google / Alphabet has the money and cashflow to heavily invest in this area maybe not creating the physical humanoid robots but they can definitely excel in the software section of it. Segments like Waymo are also interesting and bullish. Google is also massively profitable has very little debt, and an extremely solid balance sheet.
-----------------------
Risks:
I Believe the biggest Risk for Alphabet once again is that The American Tech Sector is extremely Overvalued, I Also See moderate amount of risk being that Google is such a monopoly that leaves it open for Antitrust Suits.
-----------------------
Business Model:
Google Is Vertically Integrated its Business was closely tied to the AI Boom being one of the Big 3 with its AI spending. People Disregard its extremely impressive moat it possesses having one of the strongest moats in tech let alone in the history of business.
-----------------------
Fundamentals:
Cash: US$98.50b
Debt: US$26.60b
Equity: US$386.87b
Total Liabilities: US$149.60b
Total assets: US$536.47b
Net Margins: 32.23%
-----------------------
Metrics:
Return On Equity: 32.1%
Return On Assets: 22.5%
Return On Capital Employed: 28.8%
-----------------------
Valuation:
Price to Sales: 8.9x
Price To Earnings: 27.7x
Price To Book: 8.9x
-----------------------
Disclaimer: I am not Initiating buy, Sell or Hold Opinions. I Only make these posts for Conversation. I am not a financial Expert or an Analyst.
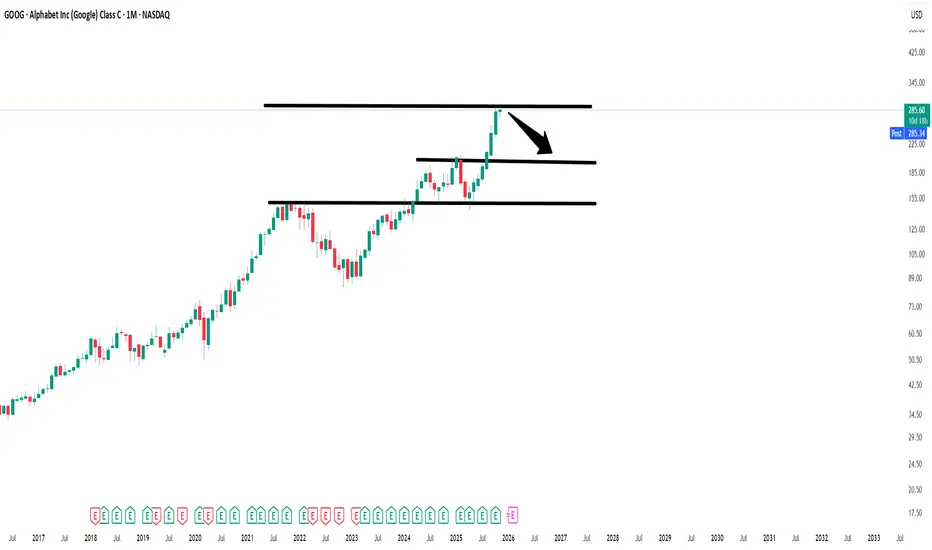
$GOOG – Post-Earnings High Tight Flag SetupGoogle ( NASDAQ:GOOG ) is setting up a high tight flag after blowout earnings, and it’s easily one of the strongest charts in the entire Mag 7 lineup right now.
🔹 The Setup:
Earnings were outstanding — strong revenue growth and margin expansion.
Price has been tightening up perfectly post-earnings, riding above all major moving averages.
The pattern has that classic high tight flag look — clean, compact, and primed for continuation.
A breakout over $290 is the trigger that could send this higher.
🔹 Why It Stands Out:
Relative strength vs. the rest of the Mag 7 — while others are chopping, NASDAQ:GOOG is leading.
Tight range = low risk, high clarity.
Volume has contracted nicely post-earnings — ideal pre-breakout behavior.
🔹 My Trade Plan:
1️⃣ Position: Holding $290 calls for next week’s expiration.
2️⃣ Trigger: Watching for a breakout through $290 with volume confirmation.
3️⃣ Stop: Will cut the position if price breaks under the 9 EMA on the daily chart.
Why I Like It:
Best relative strength among large-cap tech.
Textbook high tight flag structure.
Earnings-driven setup with clear risk management — everything lines up clean.

20+ Stocks for November: Your Ultimate Investing Radar📅 October is wrapped up, and a new month always means a new chapter on the charts.
Monthly closes reveal which breakouts are real, not temporary spikes, but clear signs that investors are willing to pay higher prices than before.
📊 I’m looking for those moments where the market proves it has changed its mind — when former resistance finally turns into support, and timing starts creating an edge.
That’s one of the biggest strengths of technical analysis: we don’t hope it moves, we see the action on the chart.
-----------------------------------
🔍 Over the past days, I’ve done another full round of research:
I scanned through both the Nasdaq 100 and S&P 500 , and also handpicked a few strong setups from Europe.
In total, you’ll find 20+ stocks today — each with its own description and plan.
I know that sounds like a lot, but there are quite a few of you here already 🙏, and every investor has a different strategy.
So don’t feel you have to study everything… just scan the names: if something catches your eye, stop and dig in.
If not, scroll on. You don’t need to cover them all.
📣 The purpose of my work is simple:
"to give you good, technically correct ideas — ones that avoid the classic mistakes that come from buying at the wrong time."
…and when you combine that with your own fundamental homework, your success rate might turn out surprisingly green.
-----------------------------------
🧭 November radar
In today’s post, you’ll find both breakout setups and corrections that have reached strong support zones.
I’ll also go through the major indices, explaining:
“why it might be smarter to take half positions instead of going all in.”
☕ So grab your coffee… and let’s kick off with 10 breakout ideas!
👇
Amazon (AMZN)
No need for a long introduction here. When a member of the Magnificent Seven delivers a clean breakout, it’s a signal you don’t want to ignore.
📈 For those who regularly add to their Mag7 holdings or rotate between them monthly, Amazon would be my pick this time.
While META’s recent correction isn’t a bad zone either, technically speaking, AMZN shows the stronger setup right now.
-----------------------
Dell Technologies (DELL)
Dell Technologies is one of the largest IT companies in the U.S., providing computers, servers, and cloud infrastructure solutions.
Over recent quarters, Dell has gained solid momentum — especially from AI server demand, which helped lift margins thanks to its higher-value infrastructure products.
Revenue also came in above expectations in the latest report, boosting investor confidence and pushing the stock to new highs.
📈 From a technical perspective, the breakout is clear:
The $150 resistance, which had held for almost a year and a half, finally gave way in October.
The structure is now open to the upside, and the chart shows clear strength.
The decision is simple: enter now, wait for a deeper retest, or just keep it on your radar — your call.
-----------------------
Nokia (OMXHEX: NOKIA)
A few weeks ago, I mentioned that Nokia was setting up for a potential breakout, and look at that, it actually did.
The company announced a collaboration with NVIDIA, which triggered the long-awaited move higher, breaking through its previous resistance zone.
The €5.5 level mentioned earlier is now history, and the monthly close above it confirms the breakout’s validity.
Whether you enter immediately, wait for a retest, or skip it because it doesn’t fit your style — again, your call. Technically valid!
-----------------------
Steel Dynamics (STLD)
Steel Dynamics ranks among the largest steel producers in the U.S., known for using recycled steel and low-emission production methods.
With a P/E of 20 (forward ~12), the company benefits from U.S. infrastructure investments and the broader manufacturing uptrend.
Recent quarterly results have been steady, the balance sheet is strong, and cash flow remains solid, supporting potential future growth.
📈 Technical setup:
This chart checks every box of a classic breakout play:
..........
🧭 Full radar and extended notes are available on my main page — you’ll find it easily.
All the best,
Vaido

Peak Tech Earnings Wrapped Up: Here Are the Winners and LosersWe're past that time when we all get glued to the dual-monitor setup and watch the titans of tech parade their financials.
Last week was the Super Bowl of earnings season, with Meta NASDAQ:META , Microsoft NASDAQ:MSFT , Alphabet NASDAQ:GOOGL , Apple NASDAQ:AAPL , and Amazon NASDAQ:AMZN all reporting in the span of just a couple of days.
The result? A mixed bag of profits, promises, and expenses, all revolving around the familiar AI growth story. Some soared. Others sank. And everyone was reminded that in Big Tech , growth costs money — a lot of it.
Let’s unwrap what happened in the most influential week of the earnings calendar .
🥴 Meta: The Spending Spree Continues
Meta NASDAQ:META suffered the most bruising showing. On paper, revenue looked great — $51.2 billion, up 26% year over year and above estimates. But earnings per share? A brutal $1.05, far below the expected $6.72, after a nearly $16 billion one-time charge tied to President Trump’s “Big Beautiful Bill.”
Without that charge, net income would’ve jumped to $18.6 billion. Instead, the headline number showed $2.7 billion — not exactly inspiring. But the real story wasn’t the miss. It was the spending.
Meta now plans to splurge $71 billion this year, up from $69 billion, mainly on AI data centers and a hiring binge in its research division. The stock dropped 11% on Thursday.
🧠 Alphabet: Ads Strong, Cloud on Fire
If Meta NASDAQ:META stumbled, Alphabet NASDAQ:GOOGL strutted. The Google parent beat on everything : earnings per share at $2.87 vs. $2.26 expected and revenue hitting a record $102.3 billion, up 16% year on year.
The company took a $3.5 billion fine from the European Commission — but even with that, margins looked healthy. Excluding the fine, the operating margin would’ve hit 33.9%. Not bad for a firm still making 85% of its money from ads.
The real fireworks were in Google Cloud, where sales rose 34% and profit margins improved to 24% from 17% last year. Alphabet stock jumped 2.5% Thursday.
🧩 Microsoft: Cloudy with a Chance of Heavy Capex
Microsoft NASDAQ:MSFT delivered classic consistency — and then some. The company reported earnings per share of $4.13, beating estimates, on $77.7 billion in revenue. Azure, the star of the show, grew 40%, topping expectations.
Yet shares dipped 3% the day after as investors fixated on capital spending. Microsoft shelled out $34.9 billion last quarter and warned that capex growth in 2026 will exceed 2025.
🍏 Apple: New Phone Who Dis?
Apple NASDAQ:AAPL is back, everyone. The company posted record revenue of $102.5 billion , slightly above expectations, and hinted that the holiday quarter will be even juicier.
CFO Kevan Parekh said sales could rise 10–12%, led by a “double-digit” surge in iPhone 17 upgrades. After years of lukewarm demand, Apple’s upgrade cycle looks hot again.
One blemish: China sales dipped, underscoring the company’s ongoing battle in its second-largest market. But services revenue — now over $100 billion annually — continues to shine as Apple quietly transforms into a subscription empire disguised as a hardware company.
The stock erased a 3% Friday gain to dip into the red.
🚀 Amazon: AI, Efficiency, and a Holiday Boom
Then there was Amazon NASDAQ:AMZN , the comeback kid of this earnings season. The e-commerce giant’s revenue soared 13% to $180 billion , and profit surged 39% to $21.2 billion. Solid.
Amazon Web Services grew 20%, its fastest clip since 2022, as AI demand turned into real money. CEO Andy Jassy said data center expansion will remain a top priority heading into 2025.
The company managed to sprinkle in some “efficiency” — laying off 14,000 employees, a move expected to cost $1.8 billion now but save plenty later.
Amazon’s stock shot up 10% in pre-market Friday, and held on to the increase, proving that just a select few companies can pivot from layoffs to record profits with such finesse.
🧾 The Takeaway
So, what did we learn from Peak Tech Week?
America’s highflyers are spending big to secure their AI future. The underlying theme is that AI costs a fortune, but not investing in it could cost even more.
In short — the future is bright, the bills are bigger, and the market’s message is clear: keep growing, but try not to spook traders while you do it. The earnings show continues with AMD NASDAQ:AMD and Palantir NASDAQ:PLTD reporting this week.
Off to you : Are you looking to scoop up some NASDAQ:META or sell some NASDAQ:AMZN ? Share your thoughts in the comments!

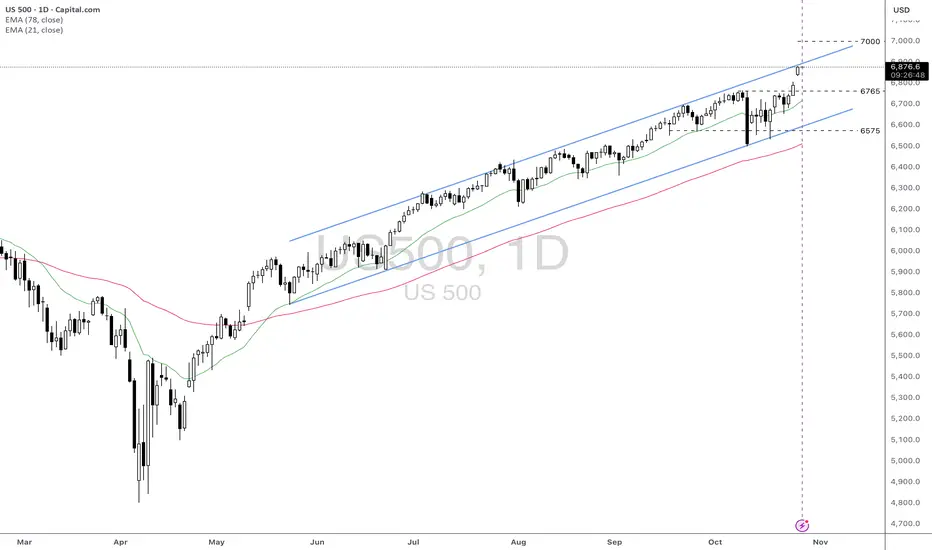
US500: Strong Upward Momentum Approaching 7000 LevelFundamental approach:
- The US500 advanced this week, propelled by strong earnings momentum from tech giants and robust performance in select sectors. Among top movers, Qualcomm rose over 11% following upbeat earnings guidance, while Alphabet and Tesla also rallied ahead of their highly anticipated quarterly results. W.R. Berkley Corporation and Welltower Inc. were notable gainers, reflecting sector rotation and risk-on flows in the index.
- Earnings from the 'Magnificent Seven', including Microsoft, Alphabet, and Meta, drove sentiment, with over 86% of S&P 500 companies reporting results above consensus expectations so far this quarter. Tesla's performance was mixed, while Amazon is set to announce slightly lower profits, but the broader group is still outpacing the rest of the market in earnings growth.
- Tech earnings and the upcoming FOMC decision are key catalysts that may influence future US500 moves. Broad sector participation and ongoing AI investment could sustain upward momentum if macroeconomic conditions remain supportive.
Technical approach:
- US500 created a new all-time high this week after breaching the key level at around 6765. The index showed an urgency in moving upward, creating a gap that remains unfilled. US500 is well above the diverging EMAs, indicating a strong upward momentum. However, the index is approaching the upper bound of the ascending channel, which may limit the price movement.
- If the current gap remains unfilled, the US500 may continue to move upward and test the psychological resistance at 7000.
- On the contrary, rejecting the channel's upper bound may prompt a correction and fill the gap around 6790, retesting the broken level at 6765.
Analysis by: Dat Tong, Senior Financial Markets Strategist at Exness
SANTA RALLY OR BLACK FRIDAY ..... ZOOMThis is a zoom into the 1hour detail up til the predicted November low (dead cat bounce zone)

SANTA RALLY OR BLACK FRIDAY ...... THOUGHTS?This is this weekend's whiteboard projections for the next 6months.
This shows a slight reclaim this week but a continuation of lower highs and lower lows.
Then a drop to the bottom of the narrower channel when China tariffs & rare earth restrictions are reflected in earnings guidance as Mag7 reports Q3 results.
Dead cat bounce into Thanksgiving after the market pullback on guidance.
Then only a Trump tweet can give us a Santa Rally, otherwise the other shoe falls and we get a Black Friday/Monday after Thanksgiving.
Followed by a controlled selloff through Q4/Q1 earnings & poor guidance.
Chart forecasts finding a bottom in April 2026.
Please share your charts/forecasts into April 2026. (I am pretty new to this if you can't tell by my charts)

EUR USD AUD NVDA MSFT AVGO S&P500 BTC XRP Weekly InsightsIn this video, we dive into the key market movements and outlooks for major financial instruments over the past week. Highlights include:
Analysis of currency pairs: EUR/USD and AUD
Trends and technical setups for leading tech stocks: NVDA, MSFT, AAPL, AVGO
The S&P 500’s performance and what it suggests about broader market direction
Developments in cryptocurrency, with a focus on BTC and XRP
Whether you’re a trader, investor, or just interested in macro markets, this video gives you a consolidated, data-driven snapshot of where things stand and what to watch next.

S&P Correction Window is official - VOLATILITY AHEADIt's that time of year where the pre-summer push wraps and the summer lull and potential
pause gets underway.
July 31 finished on a bit of a sour note with over 67% of stocks declining today and US indexes finishing RED despite the big gaps and bullish pops on MSFT and META post earnings.f
SPX Key Levels
-watch the 21 day moving average
-watch the 50 day moving average
-more dynamic support in the 100/144/200 moving average cluster
I'll be taking bites at the 5/10/15% correction levels with options and looking for this dip
to be bought by retail and institutions.
Will August 1 US Tariff Deadline matter? After Japan and Eurozone came in and said a deal is being done, I was thinking this would be a dud. BUT, Dr. Copper says "maybe" on the global
tariff deadline with the largest single day move in history (bearish). Being the perfect time of year for a correction (the other being Feb-Apr), and the technicals looking so clean for an
orderly pullback, VIX may float higher and make things more interesting in the next 30-60 days.
Strategies matter, I'll be trading risk defined, but there are great opportunities ahead. A pullback is sure better than literally watching all-time highs every single day.
Thanks for watching!!!

$MSFT: A Teflon stock turning hot, will it catch fire? Before you wonder why we call it a Teflon stock please check my blog on 27 April 2025.
NASDAQ:MSFT : A 'Teflon' stock refusing to budge under pressure for NASDAQ:MSFT by RabishankarBiswal
I pointed out the reason why this stock refused to go down below critical levels and held onto some impressive gains. And since then, we have rallied 33% from the lows of 360 and reached an ATH of 480 $. The buying pressure on the stock has pushed it above our upward sloping parallel channel which we have been following for more than 2 quarters. We always argued that the stock has support around 350 $ and is unlikely to break the support. We bounced back exactly 350 $ with 25 RSI indicating oversold conditions.
Currently with stock price above 480 $ the RSI looks over bought at 73. But in my opinion the bull run can continue for some more time unless we see a double top in the RSI just like in 2022 and 2024. Double tops usually result in breakdown. But until then there is a lot of runway ahead of us. If we plot the Fib extension levels from the top before Liberation Day to the bottom after the liberation day, then we see that the next level on the chart is 1.612 Fib level with a price of 542 $. NASDAQ:MSFT is a Teflon stock which is hot but might not catch fire and go to the moon. 😊
Verdict: More potential upside in $MSFT. Near term target 542 $.

Nasdaq All-Time Highs, S&P Close, Blast Off or Breakdown?What an incredible melt-up since April 7 lows in the US markets.
Trump vs Musk - ignored
Iran vs Israel - ignored
High Valuations - ignored
FED Pausing - ignored
The US economy is resilient and it's a good thing because the world is performing really well (EX-US). Europe/China/India/Emerging Markets are outperforming the US by 15-16% YTD
The USD is having one its worst years ever in 2025
Gold, Silver, Bitcoin are great diversifiers in my opinion for 2025
Oil prices are incredibly volatile and energy stocks and commodities in turn are showing
volatility and big swings
As we near end of month and end of Q2, I have to believe the market is due for a small pause or pullback sooner rather than later - but we'll see
Thanks for watching!!!

S&P Melt-Up, FOMC, Gold, Bitcoin - Key Levels and OutlooksHappy Saturday!!!
I just finished a live roundtable session so charts and analysis was fresh on the mind.
S&P just closed 9 consecutive days higher
S&P Futures 9 green candles
The melt-up has been slow and steady, but persistent
Markets are now "repaired" back to or above the US Liberation Day break levels
on April 2/April 3
I see some near-term resistance in the S&P with FOMC coming this week. There
are some reasonable gaps lower for some pullbacks, but the PAIN trade persists.
The "pain" trade now is higher highs because sentiment is so bearish.
The "pain" trade if we see all-time highs would be a bull trap.
FED is likely staying paused for May and June per the FED Watch Tool and the first rate
cut may start in July 2025. But I'm watching US Yields to see if they persist higher because
that may ruin the FED's plan and power and 40+ year correlations.
Eyes wide open and small risk. Short-term strategies are doing well in this environment.
I'll continue to grind.
Thanks for watching!!!

$MSFT : A 'Teflon' stock refusing to budge under pressureI promised multiple times that a detailed analysis of NASDAQ:MSFT will be published. Its time, today we analyze the levels to watch for and the future price points in this stock.
A large cap stock like NASDAQ:MSFT is a difficult ship to navigate. During the recent turbulence the stock lost almost 33% of its value. Even during these times, it never broke below the prior cycle highs of 345 $ in contrast to other MAG7 stocks like NASDAQ:TSLA which then led to more than 50% downturn in the stock. But as the headline says NASDAQ:MSFT is Teflon stock with resistance to go down. In the weekly chart we see that the stock never broke below the midpoint of the upward sloping regression band channel which is @ 375 $.
Now where does the stock go from here? If we plot the Fib levels on NASDAQ:MSFT we see that it is firmly at 0.382 which lies at 392 $. Next level is at 415 $, and we have an earning catalyst upcoming for NASDAQ:MSFT and if the stock closes above 425 $ then we can easily touch 422 $.
Verdict : NASDAQ:MSFT keep on DCAing. Earnings quality with low volatility.

$MAGS Repeating History? - Nasdaq Oscillator Flashes Caution📉 CBOE:MAGS (MAG 7 ETF) is showing striking similarities to its previous top, right before a 30% drop. Both price action and the Nasdaq Oscillator are echoing that same setup.
🔍 Key Observations:
Price has rallied into a confluence of resistance near the previous breakdown zone.
The Nasdaq Oscillator has returned to a historically high reading – the last time this happened, MAGS topped and dropped hard.
A similar structure could suggest a -30% move, targeting the $32–$33 range.
⚠️ Caution: We’re in a potential bull trap zone. Unless we break cleanly above the red trendline and consolidate, this rally may be short-lived.
🧠 Smart money may already be unloading into this strength.

MAG7 MODEL Rally is going to be in the form of ABC up The chart posted is the Mag 7 .I feel strong that the super cycle Top in the mag 7 was seen like January 2000 in the internet Bubble . I am counting a clean 5 waves down and see a strong ABC rally phase like that in 2000 then we dropped about 30% in the first leg down followed by a huge Bearish rally back up first leg up moved to the 50% retracement and then had a abc down for wave b of B to be followed up to .618 of the decline to form THE B Wave TOP . I am looking forward in my work and my models to see a near prefect rematch in the formation . I stated in my dec 8th forecast How the market will unfold based on the Wave structure and cycles and the DATA . We are now set for that abc rally . next turn date in spirals in 3/28 best of trades WAVETIMER

$NAS100 approaching correction territoryWe are again back from a short winter flu. I think the index NASDAQ100 is also coughing showing signs of a flu. Pun indented. The tech heavy NASADQ100 does not look particularly healthy on a daily and weekly basis. In this weekly chart we can see that even if we find ourselves in the structural bull market the index has lost more than 5% from its peak. The internally also do not look good with MIL:MAG7 also bleeding and off their peaks. The PEPPERSTONE:NAS100 is almost approaching its 200-Day SMA. If the index loses another 3 % then it will land @ the 200 Day SMA which it @ 20200. In the upcoming weeks there are multiple events which might put pressure on the indexes. We have tariffs upcoming on Tuesday and we must watch out for the inflation and unemployment numbers.
But we must also look at the other side of the coin. A 10% pull back is normal in a secular bull market. In all the bull markets this kind of skittishness is normal. In my assessment PEPPERSTONE:NAS100 will be a good buy @ 200 Day SMA. My lowest level in this small correction phase is 19000 which is 0.618 Fib Retracement level on the upward sloping Fib channel I have plotted and an indicative of a secular bull market. I will keep visiting this chart in the future.
Accumulate PEPPERSTONE:NAS100 between 20200 and 19000.

US100 Trade LogUS100 setup: Long position with "1:4 RRR" and "0.5% risk" based on accumulation and gap fill breakout.
- Entry within the "1H FVG" , targeting a push towards the "daily Kijun" .
- Structure confirms a potential continuation move, though risk remains controlled.
- Powell’s recent remarks and market liquidity shifts may fuel volatility.
- Stops placed below the accumulation zone; aiming for an extended move if momentum holds.

AAPL 1.22.2025 IdeaMy assessment is a fair price on the stock of $230 per share. AAPL now sitting at $222.5, I believe there is a high probability for a 5% up move within a few months.
Entry would be favorable if AAPL =< $220. I would enter direct shares here.
AAPL is of those companies that will be affected by tariffs. However, AAPL has benefitted from expanding its services economy. In other words, AAPL is not reliant on iPhone sales to drive their FCF. This opportunity is one for those looking for a discount on a MAG 7. Just be patient! But be flexible and anticipate further disruptions.

META - Undervalued and breaking out!NASDAQ:META is still undervalued!
Llama, Metaverse, Wearables, and the worlds go to Social Media platforms. It's a no brainer!
My Earning Prediction: Double Beat & Raise💪
Weekly chart is breaking out!
Measured move is $705 🎯
Not financial advice
