COMPUSDT Short TermBreak out downtrend Channel ,We see the general trend within an uptrend channel.
I am waiting for the Targets
According to the 6% Stop loss, I recommend Spot.
Margin

Additional! Sell TESLA at 850$ to 786$ price targetLook to linked related ideas to find main idea to short from 880$ to 786$.
NASDAQ:TSLA
Also have ideas about DIsney, GS, Etsy, AirBnb, Roku, Shopify. Make note what's stock you'r interest
[ NYSE:DIS NYSE:GS NASDAQ:ABNB NASDAQ:ETSY NASDAQ:ROKU NYSE:SHOP NYSE:SHOP ]


ADA/BTC 1D (Binance Spot) Falling wedge on support#Cardano is getting ready for reversal here since the support seems to be holding so far.
It's too early to call for a breakout, but at least a pump to wedge resistance is highly probable!
You can trade it on Spot or in Margin but be careful with liquidation price if you decide to do so...
Current Price= 0.00000673
Buy Entry= 0.00000678 - 0.00000642
Take Profit= 0.00000737 | 0.00000824 | 0.00000919
Stop Loss= 0.00000596
Risk/Reward= 1:1.2 | 1:2.56 | 1:4.05
Expected Profit= +11.67% | +24.85% | +39.24%
Possible Loss= -9.70%
Fib. Retracement= 0.236 | 0.5 | 0.786
Margin Leverage= 1x | 3x | 5x
Estimated Gain-time= 1080h

GBPCHF H1 - Long UpdateGBPCHF H1 - Pulling away from that retest price again every so slowly, 1:1 from the entry price identified. Need to break the zone/price marked to continue upside momentum.

GBPUSD H4 - Long BiasA little more detail via video analysis summarizing cable and potential upside moves as long as we are sitting above that key psychological 1.30 handle, not just a whole number, a more significant zone than that, multiple confluences stacking up here too which is great.

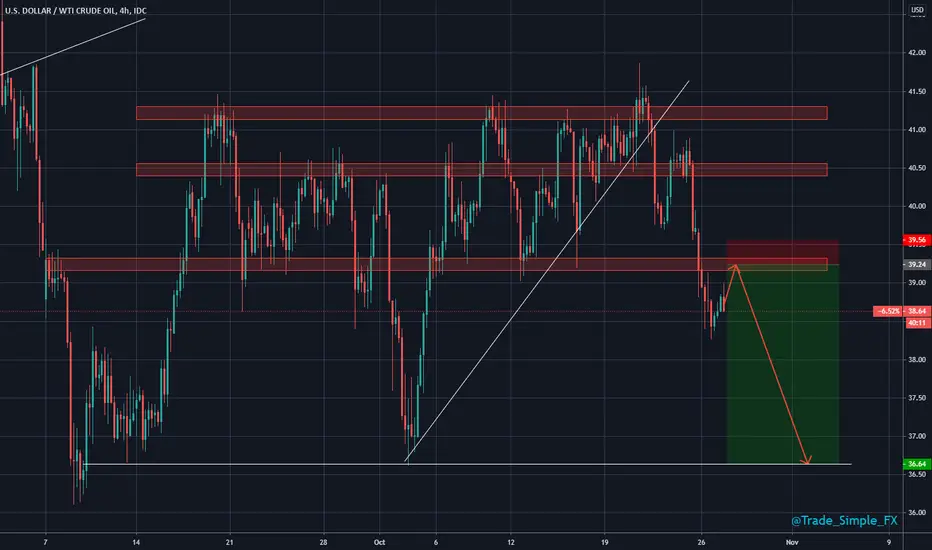
USDWTI H4 - Short SetupUSDWTI H4 - Monster RR on this one if we can find resistance on the support zone we have just broken... WTI is more impulsive than confirmative, so often very fast moves are seen without 2 stage or multiple retests. 618 to 786 ties in nicely with corrective fibs from week open down to current price (resistance retest point).
0049 - Short DASH on MarginPrecio de Entrada: 63.45 USD
Stop-Loss: 71.60 USD
Objetivo Mínimo: 42.30 USD
Objetivo Máximo: 33.00 USD
Nivel de Riesgo: 1%
Razonamiento:
- Setup super sencillo. Precio de entrada justo por debajo del soporte señalado en los $65. La operación seria ejecutada con una orden stop-sell al precio indicado. Estaríamos operando un breakdown.
- Stop-loss por encima del ultimo swing high. Ahí se invalidaría la idea. Sin misterios ni complicaciones.
- Objetivo mínimo: El low del 12 de Marzo. Nos brinda una R:R bastante razonable.
- Objetivo máximo: El low del 13 de Marzo que, a su vez, es el low del 2020. Seria el primer retest desde entonces. Esperen demanda allí.
-

0045 - Short Ethereum on MarginPrecio de Entrada: 359.60 USD
Stop-loss: 403.30 USD
Objetivo Mínimo: 256.95 USD
Objetivo Máximo: 220 USD
Nivel de Riesgo: 1%
Razonamiento:
- Precio de entrada es venta a mercado. Mientras publico el precio se aleja un poco. Disculpen eso. La entrada se activa por cierre de vela diaria por debajo del open de la anterior (12-Sep). Adicionalmente, invalido con rapidez breakout del setup previo a 4H (ver idea relacionada). Espero ruptura del mínimo de la vela que acaba de cerrar (13-Sep) para pasear en modo dump.
- Stop-loss bastante sencillo: Por encima del swing high recientemente marcado. Ligeramente por arriba.
- Objetivo mínimo: Nivel invertido siguiente alrededor en los 254 USD. El objetivo esta un poco antes.
- Objetivo máximo: Siguiente nivel invertido alrededor de los 220 USD.
Sin misterios. Hecho simple. Entendible.
PD: Vamos en corto, pero no olvidar que esto equivaldría a operar la corrección a semanas. Se ajustara el stop sin miramientos cuando sea necesario.

ADA/BTC 2D (Binance Spot) Parabolic curve on supportCardano is looking very promising for mid-term and bull trend should resume soon.
Also, 100EMA seems to be holding the price, as long as we are above it we should keep up.
You can operate it on Spot or Margin with low leverage (up to 5x).
Current Price= 0.00001030
Buy Entry= 0.00001040 - 0.00000966
Take Profit= 0.00001248 | 0.00001443| 0.00001782
Stop Loss= 0.00000807
Risk/Reward= 1:1.25 | 1:2.24 | 1:3.97
Expected Profit= +24.43% | +43.87% | +77.67%
Possible Loss= -19.54%
Fib. Retracement= 0.5 | 0.786 | 1.272
Margin Leverage= 1x | 3x | 5x
Estimated Gain-time= 2160h


Altria Fundamental TrendsThese are the fundamental metrics I'm looking at that support my bullish/bottoming thesis in Altria. Technical chart is linked below.

AUDCAD H4 - Short Trade SetupAUDCAD H4 - Haven't yet seen a retest of our 'zone' but I'll keep an eye on, and watch the resistance zone incase we do pullback a little for a full retest before seeing CAD strength again.


Buy gold 1230-1248 - Sell 1800Hello, This is probably the most daft chart I will ever create.
Buy $1230 - $1248 - Sell $1800 per ounce of Gold.
Might have to wait 3-5 years to TP, keep in mind Interest charges from your broker. Good luck, Chance of retouch of 1180 support also so like I said - Big margin required.
- Divit -

BITCOIN | 10k5 INCOMING???Looking for a entry swing long now with 3 reasons:
- All lows took down.
- H4 Low Swept & Break MS
- H4 Formed Demand

US30 Placed buys at support . I am attempting to capture the retracement to the 61.8 fib level where I will look for sells.


LONG ETH (+21% | +2.6R)Ethereum turned bullish!!
Money flowing in!
Use 8% of your bankroll!
best entry in the blue rectangle

PERL - scalp idea- go longPerl has retraced to a strong horizontal support zone.
Trend line might act as support here.
Bullish divergence on LTF
Chart speaks for itself.

LONG BITCOIN (+3.7% | +2R)10k$ psychological level resisted as support + nice bullflag + my algos are quite bullish here!
target 10500$
stoploss below 9950$

LONG NEO (+28% | +2R)great Breaker Block, tested 2 times and acted perfectly as support!
buy the pullback!
see you at next BB!

RVNUSDT BULLISH POWER CONTINUE Hello guys
At first we are thank all of you for supporting us with liking , following and ...
We think we are ready to go up and reach the target be careful that we are going up but if we break each resistence we are taking our stop loss up up up
Tomorrow or until 3 days later we are going up
This is our prediction
Be aware of take profit
DONT FORGET STOP LOSS
Enjoy your profit very soon
