Bearish Divergence still at playThe momentum hasn't been great on weekly. Multiple bearish divergence were in play, right before tarrif shock and a few after some runners but it just lead to more inconsistent and weak ath.
4h/daily tf shows a bull and bear trap widening pattern. Unfortunately bulls got hurt the most.
I'll be bullish once weekly RSI breaks the divergence.
Market

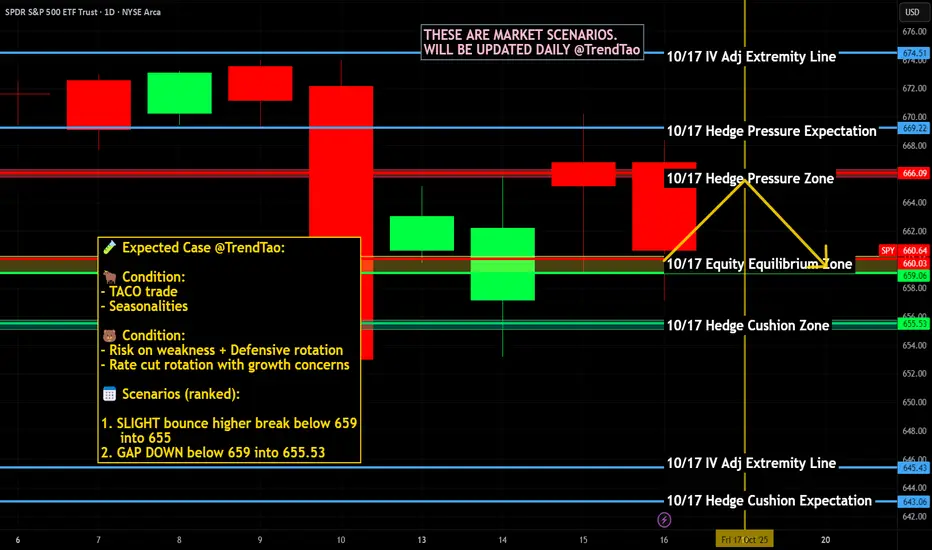
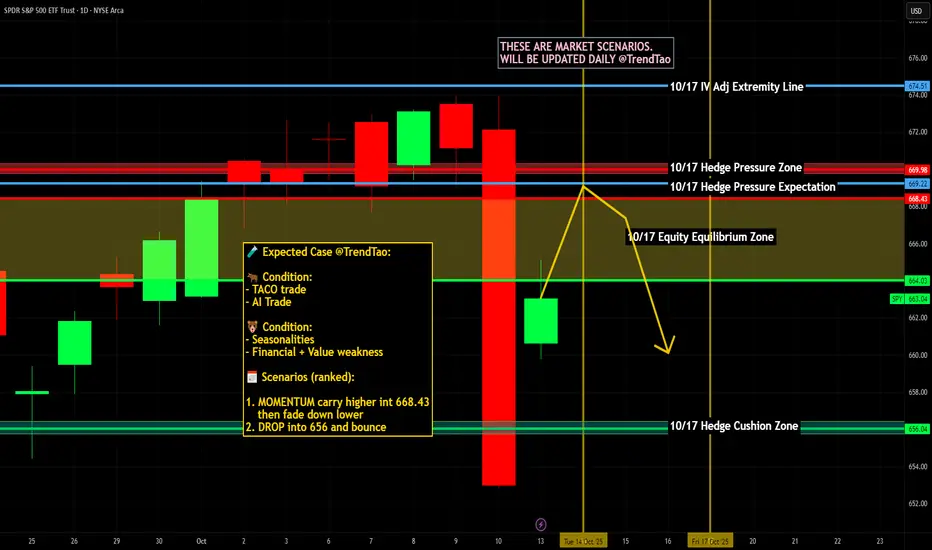
$SPY / $SPX Scenarios — Friday, Oct 17, 2025🔮 AMEX:SPY / SP:SPX Scenarios — Friday, Oct 17, 2025 🔮
🌍 Market-Moving Headlines
🚩 Data blackout risk: Friday was set for key housing and production reports — but the ongoing shutdown means most prints (Housing Starts, Industrial Production, Import Prices) may not be released.
📉 Macro vacuum: With no confirmed data, traders lean on positioning and bond moves to gauge growth sentiment into the weekend.
💬 Earnings carry the weight: Corporate results take the spotlight as macro inputs dry up.
💻 Technical tone: AMEX:SPY and NASDAQ:QQQ watchlist rotation continues — watch volatility pockets if liquidity fades mid-session.
📊 Key Data & Events (ET)
⏰ 8:30 AM — Housing Starts & Building Permits (Sept) — scheduled but may not print
⏰ 8:30 AM — Import Price Index (Sept) — scheduled release
⏰ 9:15 AM — Industrial Production & Capacity Utilization (Sept) — scheduled but may not print
⚠️ Note: Friday wraps a quiet macro week dominated by missing data and Fed commentary. Expect a headline-driven close with limited participation ahead of weekend risk.
⚠️ Disclaimer: Educational / informational only — not financial advice.
📌 #trading #stockmarket #SPY #SPX #housing #IndustrialProduction #ImportPrices #Fed #bonds #economy #shutdown #yields #equities
100% UPSIDE Precious Metals Playbook — Gold, Silver & Miners ETF🏛️ Precious Metals Playbook — Gold, Silver & Miners ETFs
🔑 Executive Summary
• We combine the 2026 parabolic metals thesis gold/silver/platinum with leveraged ETF implementation to target triple-digit portfolio upside under view that gold’s bull run continues into 2026 $5,500–$6,500/oz.
• Miners’ torque has been massive in 2025: GDX ~+123% YTD while gold itself is up ~51% YTD; levered miners e.g., NUGT, JNUG, GDXU show ~360–700%+ YTD — confirming high beta to metal.
• Implementation below caps any single ETF at 10% within 10–20% limit and keeps ≥50% of the book in 2×–3× products for upside torque while diversifying across metal vs. miners and gold vs. silver.
________________________________________
🌍 Market View Condensed
• Gold: Momentum + macro easing bias, softer USD, central-bank demand support the “second-leg melt-up” case into 2026; miners’ margin torque can deliver 2–3× metal beta.
• Silver: Structural deficits + PV/EV/datacenter demand have super-charged silver miners in 2025.
________________________________________
📊 2025 YTD Scorecard Key ETFs
• Gold metal (unlevered): GLD +50.9% YTD.
• Gold miners (unlevered): GDX ~+123% YTD.
• Silver miners (unlevered): SIL ~+137% YTD.
• Leveraged miners:
o NUGT (2× miners) ~+361% YTD; JNUG (2× juniors) ~+394% YTD.
o GDXU (3× miners ETN) ~+706% YTD (top performer cohort of 2025).
• Leveraged gold & silver metals: UGL (2× gold) ~+125% YTD; DGP (2× gold ETN) ~+123% YTD; AGQ (2× silver) ~+159% YTD.
________________________________________
🧩 Portfolio Construction Target book: $100,000
Constraints honored: max 10% per ETF, ≥50% allocation to 2×/3× ETFs.
🎯 Target Allocation 60% leveraged / 40% unlevered
Leveraged — 60% total
• 10% GDXU 3× gold miners ETN
• 10% NUGT 2× gold miners
• 10% JNUG 2× junior gold miners
• 10% AGQ 2× silver
• 10% UGL 2× gold
• 10% DGP 2× gold ETN
Rationale: diversify torque across miners vs. metals, 2× vs. 3×, and gold vs. silver to avoid single-product concentration risk.
Unlevered — 40% total
• 10% GDX VanEck Gold Miners
• 10% GLD SPDR Gold Trust
• 10% SIL Global X Silver Miners
• 10% SLV (or) IAU silver or gold bullion, choose per preference
Rationale: ballast and liquidity; preserves exposure if volatility in levered products forces risk-off.
Dollar mapping (@ $100k):
• Each 10% line = $10,000 notional; 10 tickers → $100,000 fully invested.
________________________________________
📈 Scenario Analysis Hypothetical, path-dependent
Gold advances toward $5,500–$6,500 by 2026. We translate that into rough upside bands using historical betas and allowing for daily-reset drag on leveraged products.
• Base case +100% portfolio:
o Gold +40–60% from here; 2× gold funds net ~+70–110% conservative for compounding/decay.
o GDX sensitivity ~2–3× metal → ~+80–150%; 2× miners ~+160–300%; 3× miners can overshoot in trending tapes.
o With 60% in levered assets and 40% in unlevered miners/metals, blended outcome can land near ~+100% if trends persist and volatility stays manageable.
• Stretch case +200% portfolio:
o If the “second-leg melt-up” plays out momentum + flows + central-bank bid and miners’ margins expand, levered miners dominate returns similar to 2025 YTD pattern.
o Portfolio hits ~+200% if miners continue to over-beta the metal and 3× exposure compounds favorably no major whipsaws.
Risk reality check: Leveraged ETFs reset daily; high volatility or choppy reversals can erode returns even if the long-term trend is up. Position sizing 10% lines and diversification across instruments help mitigate single-name decay risk.
________________________________________
🧭 Implementation Notes
• Execution: stage entries over several days reduce gap/vol risk, prioritize liquid hours; use stop-loss/hedge bands on the 3× sleeve.
• Rebalancing: monthly bands ±3–5% per line to defend the 60/40 torque mix.
• Risk budget: expect 3× ETN drawdowns >60% in sharp pullbacks; keep dry powder OR pre-define risk limits.
________________________________________
🗂️ Product Appendix — Quick Stats
• GDXU (3× miners ETN): ~+706% YTD; ER ~0.95%.
• NUGT (2× miners): ~+361% YTD.
• JNUG (2× junior miners): ~+394% YTD.
• AGQ (2× silver): ~+159% YTD.
• UGL (2× gold): ~+125% YTD.
• DGP (2× gold ETN): ~+123% YTD.
• GDX (miners): ~+123% YTD.
• SIL (silver miners): ~+137% YTD.
• GLD (gold): ~+50.9% YTD.
________________________________________
⚠️ Disclosures & Risks
Leveraged ETFs/ETNs are short-term trading tools with daily reset/compounding; they can significantly underperform their leverage multiple over holding periods with high volatility or mean-reversion. ETNs (e.g., GDXU, DGP) also carry issuer credit risk. This memo is informational, not investment advice; consider your risk tolerance, liquidity needs, and tax/ETN suitability.

$SPY / $SPX Scenarios — Thursday, Oct 16, 2025🔮 AMEX:SPY / SP:SPX Scenarios — Thursday, Oct 16, 2025 🔮
🌍 Market-Moving Headlines
🚩 Big macro day — if it happens: Retail Sales & PPI headline the morning, but both reports may be delayed under the ongoing shutdown. Markets will trade on expectation and reaction instead of prints.
📈 Consumer + price pulse: These two data points were expected to test the “soft-landing” narrative — inflation vs. spending resilience.
💬 Fed-speak heavy: Barkin, Waller, Bowman, and Miran dominate the lineup; tone on inflation stickiness may shape yields.
🏠 Housing check: Homebuilder Confidence offers a softer read on the real-economy drag from higher mortgage rates.
📊 Key Data & Events (ET)
⏰ 8:00 AM — Tom Barkin (Richmond Fed) remarks
⏰ 8:30 AM — Retail Sales (Sept) & PPI (Sept) — scheduled but may not print
⏰ 8:30 AM — Initial Jobless Claims (Oct 11) — scheduled release
⏰ 9:00 AM — Stephen Miran & Christopher Waller (Fed Govs) speeches
⏰ 10:00 AM — Michelle Bowman (Fed Gov) remarks + Homebuilder Confidence (Oct)
⏰ 12:45 PM / 4:30 PM — Tom Barkin (Richmond Fed) speeches
⚠️ Disclaimer: Educational / informational only — not financial advice.
📌 #trading #stockmarket #SPY #SPX #RetailSales #PPI #Fed #Barkin #Waller #Bowman #Miran #inflation #bonds #shutdown #economy #yields #housing

$SPY / $SPX Scenarios — Wednesday, Oct 15, 2025🔮 AMEX:SPY / SP:SPX Scenarios — Wednesday, Oct 15, 2025 🔮
🌍 Market-Moving Headlines
🚩 Growth pulse check: The Empire State Manufacturing Survey kicks off the day — a real-time test of factory sentiment post-summer slowdown.
📘 Fed Beige Book afternoon drop: Key read on regional activity and inflation anecdotes — markets often reposition after release.
💬 Fed parade continues: Bostic, Miran, and Waller keep rate-cut expectations in focus ahead of Thursday’s data risk.
⚠️ Shutdown overhang: Broader data (CPI/PPI/Retail) still paused — traders key off qualitative signals like Beige Book tone.
📊 Key Data & Events (ET)
⏰ 🚩 8:30 AM — Empire State Manufacturing Survey (Oct)
⏰ 12:10 PM — Raphael Bostic (Atlanta Fed) speech
⏰ 12:30 PM — Stephen Miran (Fed Gov) speech
⏰ 1:00 PM — Christopher Waller (Fed Gov) speech
⏰ 🚩 2:00 PM — Fed Beige Book
⚠️ Note: Shutdown continues to delay most federal data releases. Beige Book offers the only official economic snapshot this week — high read-through for inflation, wages, and business conditions.
⚠️ Disclaimer: Educational / informational only — not financial advice.
📌 #trading #stockmarket #SPY #SPX #Fed #BeigeBook #EmpireState #Waller #Bostic #Miran #bonds #yields #inflation #shutdown #economy
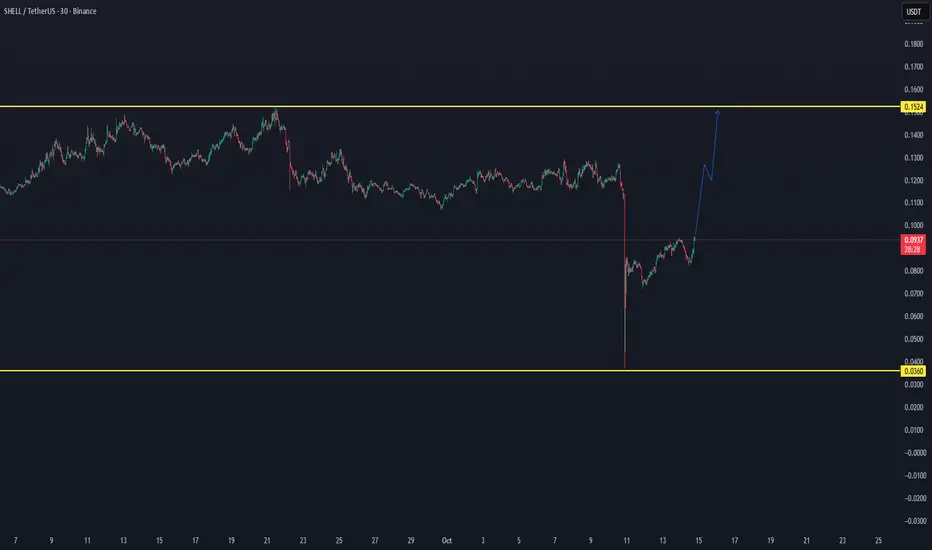
SHELL/USDT — Breakout Setup Building, Eyes on $0.1524SHELL/USDT — Breakout Setup Building, Eyes on $0.1524 🚀
SHELL has formed a clear bottom structure and is now showing early signs of trend recovery after a sharp correction. The price is currently reclaiming strength above the $0.09 level, suggesting a potential shift in short-term momentum.
📊 Technical Overview:
Support zone: $0.0360
Current price: $0.093
Breakout target: $0.1524
A breakout above $0.10–$0.11 could confirm a new upward phase, opening the path toward the $0.1524 zone, which acts as the next significant resistance level.
Momentum indicators and price structure indicate that buyers are gradually stepping in — pointing to a possible continuation move if volume supports the trend.
📈 Bias: Bullish setup forming
🎯 Targets: $0.115 → $0.1524
🕓 Watch for confirmation: A 4H close above $0.10
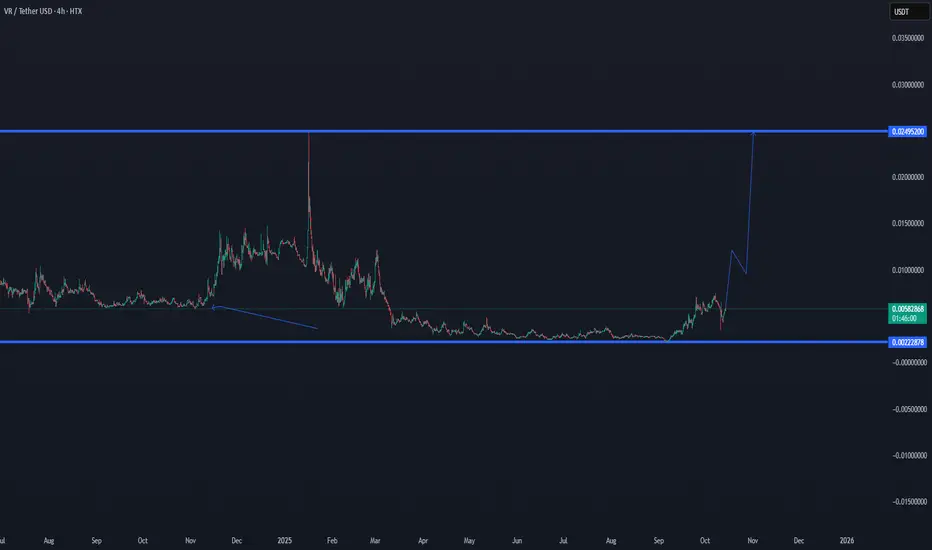
VR/USDT Accumulation Zone Update📊 Market Update — VR/USDT
VR is trading inside a clear range zone. The lower support is around 0.0022, and the top resistance sits near 0.0249.
Currently, VR is holding above the mid-level with solid volume — if it can confirm higher with a 4h close, a move toward 0.01+ looks possible, and later a push into the range high could follow.
✅ Outlook
Still early-stage accumulation, but structure looks bullish as long as price holds above support.
If BTC stays stable or trends up, VR could continue this breakout move.
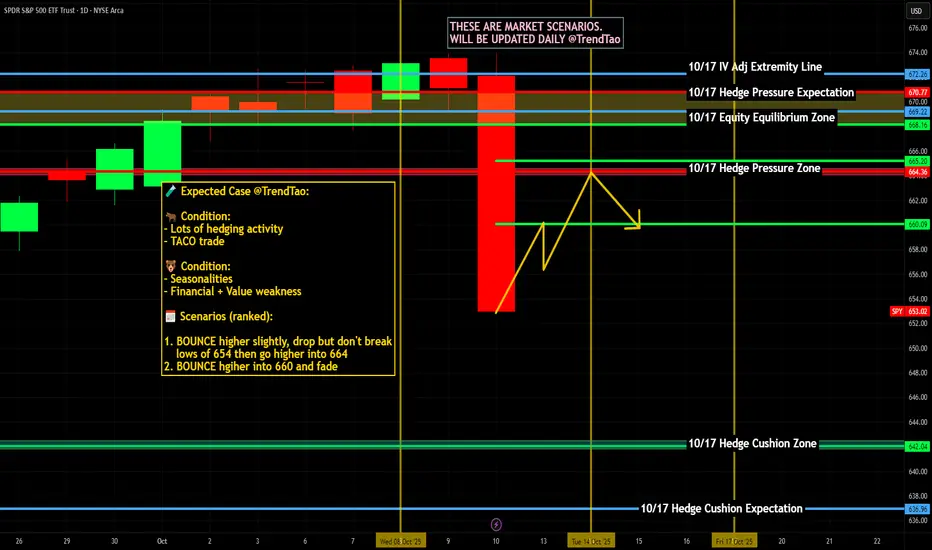
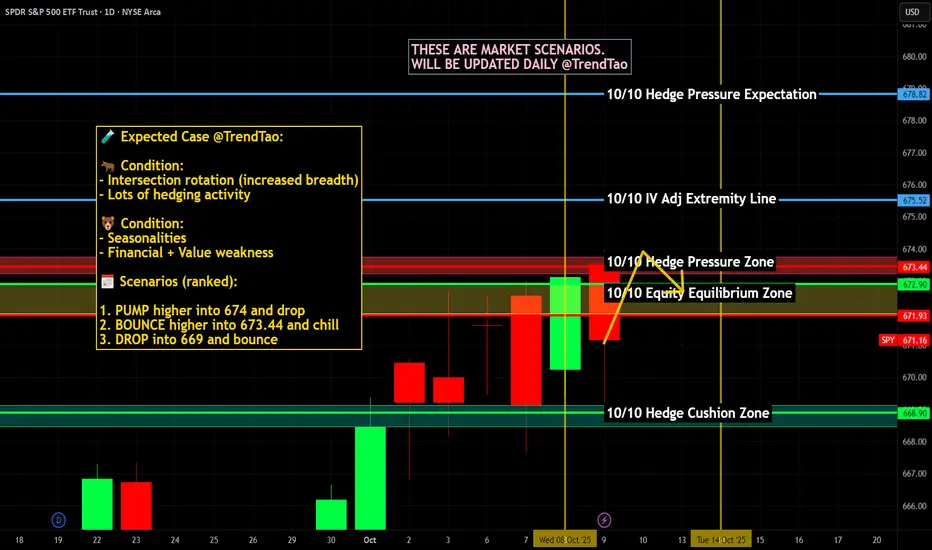
$SPY / $SPX Scenarios — Tuesday, Oct 14, 2025🔮 AMEX:SPY / SP:SPX Scenarios — Tuesday, Oct 14, 2025 🔮
🌍 Market-Moving Headlines
🚩 Powell returns: The Fed Chair’s midday remarks anchor Tuesday — traders watch tone shifts after a light Columbus Day tape.
💬 Fed-heavy lineup: Bowman, Waller, and Collins fill out the day — policymaker divergence could move yields and risk assets.
📈 Small biz sentiment: NFIB optimism opens the day, giving early insight into Main Street labor and inflation pressures.
⚠️ Shutdown overhang: Broader data flow still limited — markets key off Fed speak and earnings momentum.
📊 Key Data & Events (ET)
⏰ 6:00 AM — NFIB Small Business Optimism (Sept)
⏰ 8:45 AM — Michelle Bowman (Fed Gov) speech
⏰ 🚩 12:20 PM — Fed Chair Jerome Powell speech
⏰ 3:25 PM — Christopher Waller (Fed Gov) speech
⏰ 3:30 PM — Susan Collins (Boston Fed) speech
⚠️ Note: No high-tier macro data releases due to shutdown effects — Fed communication and earnings dominate the tape.
⚠️ Disclaimer: Educational / informational only — not financial advice.
📌 #trading #stockmarket #SPY #SPX #Powell #Fed #Waller #Bowman #Collins #NFIB #yields #bonds #shutdown #economy #megacaps
Bitcoin Eyes $116.6K Breakout Confirmation📊 Market Update — Bitcoin (BTC/USDT)
BTC has successfully confirmed the low time frame zone, holding steady above both the support and volume range, which signals continued short-term strength.
Currently, price action is consolidating within the upper boundary of the range — a sign of buyer absorption before potential expansion.
🔹 Key Level to Watch: $116.6K
This level acts as an important confirmation point — a 1-hour (or higher) close above this zone could validate a breakout continuation, opening the path toward the $120K–$125K range.
If BTC sustains this structure, the bullish momentum remains intact, with low time frame structure aligning with higher trend support.
📈 Bias: Bullish Continuation
🎯 Next Targets: $116.6K → $120K → $125K

$SPY / $SPX Scenarios — Week of Oct 13–17, 2025🔮 AMEX:SPY / SP:SPX Scenarios — Week of Oct 13–17, 2025 🔮
🌍 Market-Moving Headlines
🚩 Inflation-heavy week: PPI, Retail Sales, and Industrial Production headline the macro slate — but several may be ⚠️subject to delay due to the shutdown.
💬 Fed circuit overload: 10+ Fed speakers including Bowman, Waller, Bostic, Barkin, and Miran — tone-watching replaces missing data.
📉 Consumer & housing pulse: Retail Sales, Homebuilder Confidence, and Housing Starts offer critical insight into demand — if they post on time.
💻 Earnings meets macro: Early Q3 results from banks + big tech guide sentiment alongside muted macro signals.
📊 Key Data & Events (ET)
📅 Mon, Oct 13 — Columbus Day 🇺🇸 (Bond Market Closed)
⏰ 12:55 PM — Anna Paulson (Philadelphia Fed) speaks
📅 Tue, Oct 14
⏰ 6:00 AM — NFIB Small Business Optimism (Sept)
⏰ 8:45 AM — Michelle Bowman (Fed Gov) speech
⏰ 3:25 PM — Christopher Waller (Fed Gov) speech
⏰ 3:30 PM — Susan Collins (Boston Fed) speech
📅 Wed, Oct 15
⏰ 🚩 8:30 AM — Empire State Manufacturing Survey (Oct)
⏰ 12:10 PM — Raphael Bostic (Atlanta Fed) speech
⏰ 12:30 PM — Stephen Miran (Fed Gov) speech
⏰ 1:00 PM — Christopher Waller (Fed Gov) speech
⏰ 🚩 2:00 PM — Fed Beige Book
📅 Thu, Oct 16
⏰ 🚩 8:30 AM — Retail Sales (Sept) — ⚠️ May be delayed due to shutdown
⏰ 🚩 8:30 AM — Producer Price Index (PPI, Sept) — ⚠️ May be delayed
⏰ 🚩 8:30 AM — Initial Jobless Claims (Oct 11) — ⚠️ At risk of delay
⏰ 9:00 AM — Waller & Miran (Fed Govs) speeches
⏰ 10:00 AM — Homebuilder Confidence (Oct)
⏰ 10:00 AM — Michelle Bowman (Fed Gov) remarks
⏰ 12:45 PM / 4:30 PM — Tom Barkin (Richmond Fed) speeches
📅 Fri, Oct 17
⏰ 🚩 8:30 AM — Housing Starts / Building Permits (Sept) — ⚠️ Possible delay
⏰ 8:30 AM — Import Price Index (Sept) — ⚠️ Possible delay
⏰ 🚩 9:15 AM — Industrial Production & Capacity Utilization (Sept) — ⚠️ Possible delay
⚠️ Shutdown Watch:
Several economic reports (Retail Sales, PPI, Jobless Claims, Housing, Industrial Production) depend on agencies like the Census Bureau, BLS, and BEA — if the shutdown persists, these will be postponed until government funding resumes.
Expect headline-driven trading, Fed-speak sensitivity, and lighter macro liquidity through the week.
⚠️ Disclaimer: Educational / informational only — not financial advice.
📌 #trading #stockmarket #SPY #SPX #Fed #Powell #Bowman #Waller #Bostic #Barkin #Miran #RetailSales #PPI #BeigeBook #inflation #bonds #shutdown #economy #housing #earnings #macro
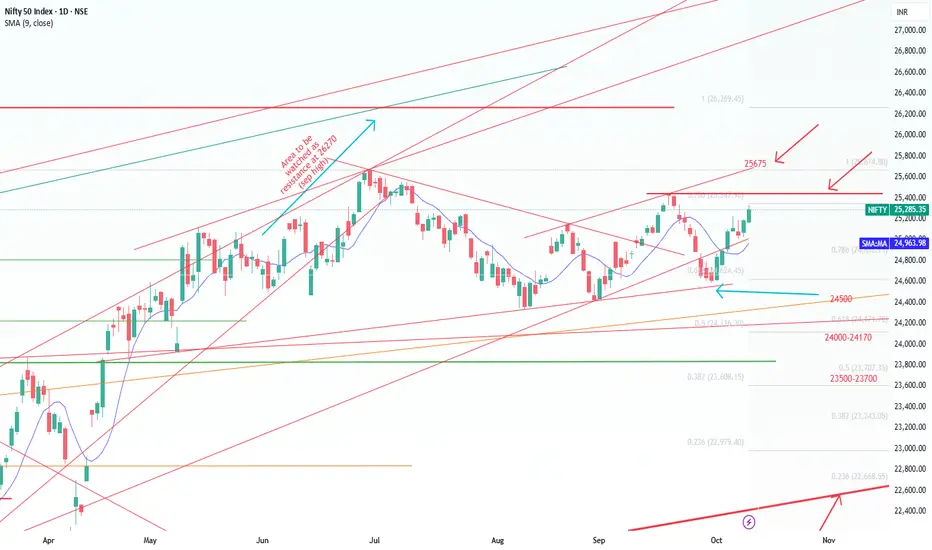
Nifty Short & Medium Term Support&Resistance_13-Oct to 17-Oct-25Nifty Short & Medium Term Support&Resistance_13-Oct to 17-Oct-25
Nifty 24894
As predicted last week, Nifty very well hold the 24500 Support and currently moved near to the first resistance 25000.
One more positive decisive break above Ist Short Term Resistance as given below in order market to move up.
Quarterly result started coming out slowly, TCS posted average result, Warree Renewables posted vgood results (PE is very high) .
Qtrly Results and Tariffs deal will decide the future path of the Nifty. Since it is a Volatile situation SIP route or buy in multiple parcel route with a goal of 3-5 years will workout.
Recent 100% additional tariff on China got severe effect on US market on Friday, it will affect global other trade markets too on Monday. Mainly due to the uncertainty prevailing over.
However, for India though initial drop market tend to move up to 25670 ( Jun 2025 all time high).
Repo and FD rate reduction by RBI, people may have to choose Debt/Commodity/Equity as alternate in order to beat the inflation.
Apart from that Low Cost ULIPs (2.5 L Limit per person) as one of the option to save the tax- ICICI & HDFC ULIPs are doing well, ULIPs are simplified and charges are lesser compared to MFs in terms of long term, Various fund option including passive funds are introduced.
Market was on decline/ Consolidation mode recently because of new Tariff's imposed by Trump mainly on Pharma and IT - H1 B Visa and Tax for Outsourcing IT and the recent pharma tarrifs imposition.
GST 2.0 is a reform which can aid in Auto/ FMCG / Home Appliances sales will get a boost due to the festival season.
Since market is volatile, use the dips (Opportunity) and buy through SIP or through multiple parcel in these uncertain times with a goal of 3-5 years.
Nifty Short Term Supports:
1. 24500 (Trend Line as shown)
2. 24000-24170 (Fibonacci Retracements Supports- Two Supports in this zone 24116 & 24171 as shown)
Medium Term Support:
3. 23500-23700 (Fibonacci Retracements Supports- Two Supports in this zone 23608 & 23707 as shown)
4. 23000
Resistance ( Multiple Resistances are there between 25000-25650):
1. 25000
2. 25200 ( 25154 Aug 2025 high)
3.25350 ( Fibonacci resistance shown )
4.25450 ( 25442 is the Aug 2025 high)
3. 25500 ( 25441 Sep 18th 2025 High )
Medium Term:
1.25670 ( Jun 2025 High) Should cross this resistance in short term decisively inorder to move up.
2.26269 ( Sep 2024 High)
Friday - the day the market shows its true faceEveryone loves chasing moves early in the week - Monday, Tuesday, news, data drops. But if you look closer, the most honest market signals usually appear on Fridays. By that time, the fight between buyers and sellers is settled, and the price reveals who really has control.
When big funds and banks are confident about direction, they don’t rush to close positions before the weekend. The market often ends the week at its highs - and Monday continues the same move. But if selling pressure picks up late on Friday, it’s usually a warning sign: traders are nervous and prefer not to hold risk over the weekend.
Friday’s close isn’t just another candle - it’s the verdict for the entire week. A close near the top of the range means demand is strong; near the bottom means fear and profit-taking are taking over.
Retail traders often close everything before the weekend to “stay safe.” But smart money uses those thin Friday hours to shake out weak hands and grab liquidity. That’s why the real moves often begin right after those late-week impulses.
What to keep an eye on:
1. Watch where the price closes within the weekly range - it sets the tone for Monday.
2. Check volume during the last trading hours - it tells you who’s really in control.
3. A strong Friday move with no news? Often that’s the setup for next week’s trend.
Friday’s action is rarely random. It’s the final scene before the next act of the market drama.
$ETH market update 5-10-2025📊 Ethereum Market Update (on request)
Right now, there’s nothing major happening for Ethereum. It continues to consolidate in a range between the ATH at $4800 and the $3800 level, because of this massive bearish divergeance.
On the daily chart, the MACD is bullish and the Stochastic RSI is supportive, but momentum looks exhausted. There isn’t much conviction in this move. Bitcoin is the real superstar, while Ethereum is fading in its shadow.
From my analysis, we might still have about one more week of growth, potentially pushing to a new ATH — but don’t expect a parabolic rally. This looks more like a technical follow of BTC rather than genuine investor interest.
⚠️ That means the probability is high that we see a dump back below $4000, likely testing $3800 as support.
If bulls regain control and Bitcoin rotation restarts, ETH could resume its rally. Otherwise, we may see deeper consolidation, possibly down to $3400, before finding the energy to push again toward a new ATH.
#Ethereum #ETH #EthereumPrice #Crypto #CryptoNews #CryptoMarket #Bitcoin #BTC #Altcoins #Trading #TechnicalAnalysis #CryptoUpdate #MACD #StochasticRSI #ATH #CryptoTrading #Investing

A healthy consolidation should dip lowerA healthy consolidation should dip lower (around $6,648 or even better $6,000) before bouncing.
But will the billionaires manipulating this market have the patience — or will they fire their money into the air too soon?
Hopefully, we get a deeper correction for a solid long setup by the end of the week and a strong rebound next week.
Patience is key. 🕒
Bear market has startedThe End of the Bull Cycle. Why I'm Selling Everything and Won't Buy Again Until September 2026.
For the last year and a half, I have said that we are in a bull market. I never once changed my opinion. But all things come to an end. The time has come.
September 13, 2025, the date I have been mentioning across my social media, was, in my opinion, the peak of this market cycle. As painful as it may sound, the bull market is over.
"Altseason" is a Scam. It's Time to Grow Up
Let's be honest. The "altseason" that everyone was dreaming of never happened. Yes, there were pumps on selective, mostly new coins. But the old guard, for the most part, showed nothing.
Therefore, I want to officially declare: I will never use the word "altseason" again. It's a meme from 2017. There are now over a million coins on the market. Liquidity is so diluted that pumping everything is impossible. Instead of "altseason," we have, and always will have, "selective pumps" driven by interested players. Our job is to learn how to find them, not to wait for a mythical wave that will lift all boats.
Why Now? The Classic Signs of a Top
I wouldn't be so certain if I didn't see the classic signs of euphoria that always appear at the top of a cycle:
- Universal Optimism: Governments are embracing crypto, creating reserve funds.
-Corporate Buying: Public companies are massively buying Bitcoin and Ethereum.
-Positive News: The media is filled with only positive news; no one wants to sell and is waiting for $200k, $300k, $500k.
When the crowd rushes into the market, smart money begins to exit. I prefer to be with the latter.
My Personal 2-Year Plan. Maximum Transparency
I'm not just saying the market will fall. I am publicly sharing my plan of action:
1. I am exiting the market into stablecoins NOW. I am locking in my profits.
2. I will NOT be buying the first correction. When Bitcoin drops to $90,000, most people will be buying, thinking it's a discount. I will not.
3. I plan to start actively buying again in September 2026.
Why so long? Because those who buy at the $90-100k mark risk sitting through two years of psychological and financial drawdown just to break even. I am not willing to pay that price. I won't disconnect from the market; I'll keep my finger on the pulse, but I don't plan on making any active buys.
Cycles Work. My Technical Rationale
My decision is not based on emotion but on cycle theory, which I have tested for years. The cycle consists of ~151 weeks of growth and ~51 weeks of decline. We have just completed the growth phase. The period between September 13 and October 6 is the exact reversal zone after which a decline should begin.
I could be wrong. No one can be right all the time. Perhaps the cycle theory will break this time. But I trust my system.
Conclusion: What's Next? The Long-Term View
I have not become a bear forever. I believe Bitcoin will hit $300,000. But not in the coming months. It will be worth that in 2.5 years, after a healthy 50-60% correction from the peak.
From this moment on, my bias is bearish. On strong upward bounces, I might even open short positions. A new game is beginning, with new rules. My job is to preserve my capital and multiply it in the next cycle. What about yours?
Why bear market started now Proofs:
Best regards EXCAVO

$SPY / $SPX Scenarios — Friday, Oct 10, 2025🔮 AMEX:SPY / SP:SPX Scenarios — Friday, Oct 10, 2025 🔮
🌍 Market-Moving Headlines
🚩 Consumer pulse check: UMich prelim sentiment drops back into focus — inflation expectations will steer bond yields & risk tone.
📉 Shutdown drag: Budget data may stay delayed — leaving traders to anchor on Fed commentary & macro positioning.
💬 Fed watch: Goolsbee’s remarks could frame how policymakers interpret slowing sentiment versus resilient inflation.
💻 End-week flows: Re-balancing pressure + light liquidity could magnify afternoon swings in AMEX:SPY and $QQQ.
📊 Key Data & Events (ET)
⏰ 9:45 AM — Austan Goolsbee (Chicago Fed) opening remarks
⏰ 🚩 10:00 AM — UMich Consumer Sentiment (Prelim, Oct) — Forecast 60.4 | Prior 53.5
⏰ 2:00 PM — Monthly U.S. Federal Budget (Sept) subject to delay due to shutdown
⚠️ Disclaimer: Educational / informational only — not financial advice.
📌 #trading #stockmarket #SPY #SPX #Fed #Goolsbee #UMich #sentiment #budget #shutdown #bonds #Dollar #economy #megacaps
$SPY / $SPX Scenarios — Thursday, Oct 9, 2025🔮 AMEX:SPY / SP:SPX Scenarios — Thursday, Oct 9, 2025 🔮
🌍 Market-Moving Headlines
🚩 Powell spotlight: The Fed Chair’s morning remarks set the tone for risk sentiment — traders watching for policy bias hints.
💬 Fed overload: Bowman, Kashkari, Barr, and Daly dominate the docket — expect intraday rate-path chatter.
📉 Shutdown shadows: Jobless Claims* and Inventories* may face data delays; market liquidity remains headline-driven.
💻 Macro rotation: AMEX:SPY trades tightly to yield moves; tech leadership faces cross-currents as real rates stay firm.
📊 Key Data & Events (ET)
⏰ 🚩 8:30 AM — Fed Chair Jerome Powell opening remarks
⏰ 🚩 8:30 AM — Initial Jobless Claims (Oct 4) subject to delay
⏰ 8:35 AM — Michelle Bowman (Fed Vice Chair for Supervision) welcoming remarks
⏰ 8:45 AM — Michelle Bowman speech
⏰ 10:00 AM — Wholesale Inventories (Aug)* subject to delay
⏰ 12:45 PM — Neel Kashkari + Michael Barr discussion
⏰ 3:45 PM — Michelle Bowman speech
⏰ 4:10 PM — Mary Daly (SF Fed) speech
⏰ 9:40 PM — Mary Daly evening remarks
⚠️ Disclaimer: Educational/informational only — not financial advice.
📌 #trading #stockmarket #SPY #SPX #Fed #Powell #Bowman #Kashkari #Barr #Daly #joblessclaims #bonds #Dollar #shutdown #economy #megacaps
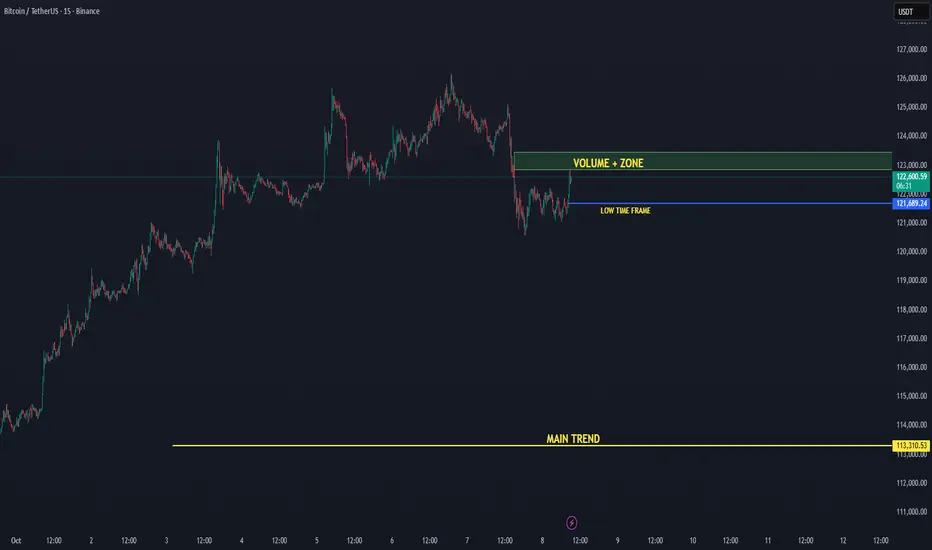
BTC/USDT — Low Time Frame Recovered, Eyes on Volume 08-10-2025Bitcoin has reclaimed its low time frame level near $121.6K, signaling renewed short-term strength. Price is now pushing upward toward the +Volume Zone, an area where increased buying activity could trigger a breakout continuation.
📈 Low Time Frame Reclaimed: BTC has stabilized above the local structure, confirming short-term bullish momentum.
🔊 Volume Zone Target: The next resistance sits around $123K, where increased trading activity could accelerate a move higher.
🟢 Main Trend Active: The primary uptrend remains strong as long as BTC holds above the $113K main trend support.
Technical Levels:
🟢 Main Trend Support: $113K
🟡 Low Time Frame Support: $121.6K
🔊 Volume Zone Resistance: $123K
🎯 Next Target: $125–$126K
Outlook:
Bitcoin is showing healthy recovery momentum, reclaiming short-term structure and heading into the Volume Zone. If it sustains above $121.6K and breaks $123K with volume confirmation, a continuation toward $125K+ becomes likely.
📊 Bias: Bullish continuation
📈 Focus: Volume reaction at $123K
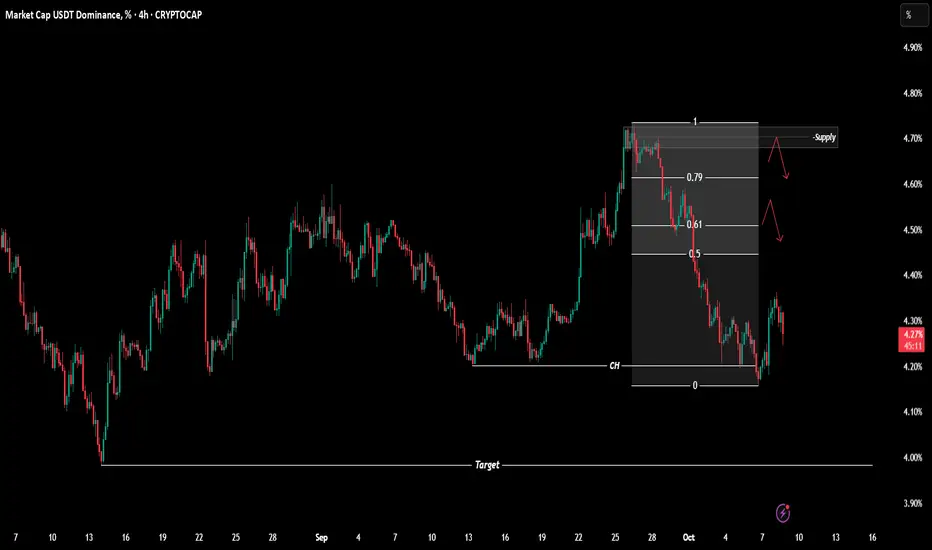
$USDT.D Analysis - Oct 8 | 4H Time FrameCRYPTOCAP:USDT.D Analysis - 4H
Hello and welcome to another analysis from the Satoshi Frame team!
I’m Abolfazl, and today we’re going to analyze Bitcoin on the 4-hour timeframe.
USDT dominance has shown a trend reversal on the 4-hour timeframe and has turned bearish.
The OTE zone and the marked supply area could act as potential rejection zones if dominance makes a short-term pullback upward.
On the other hand, we could also see another drop from the current level, moving toward the lower support area near the recent low.
The main target (4%) is already marked on the chart.
See you in the next analyses!
Stay tuned with the Satoshi Frame team...
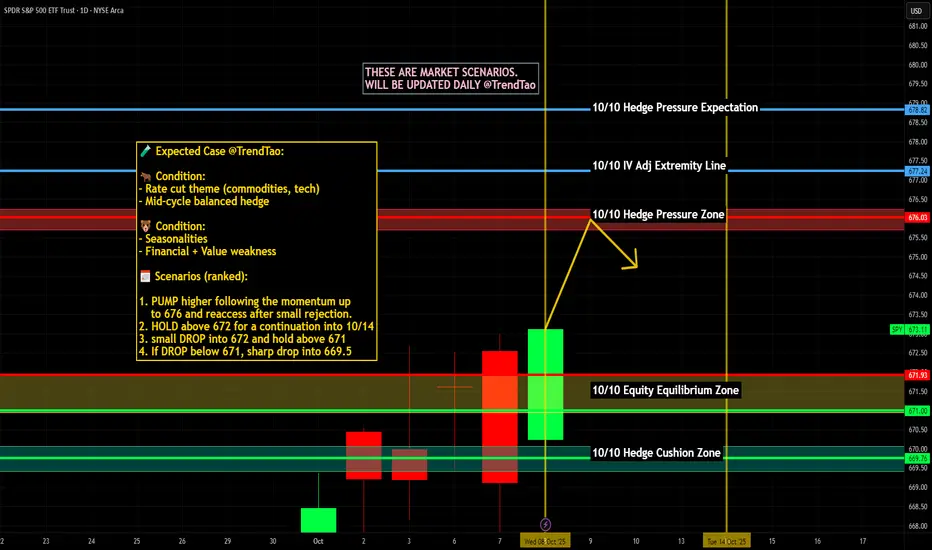
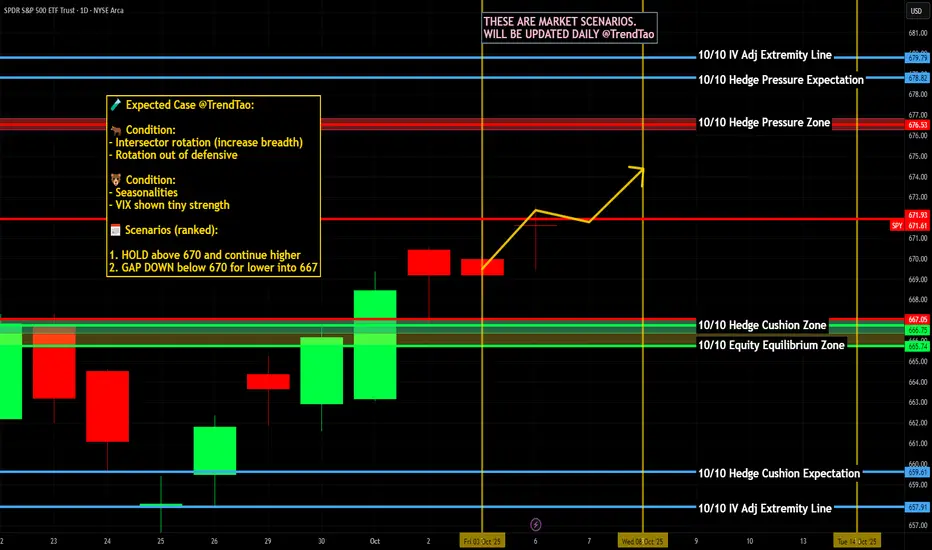
$SPY / $SPX Scenarios — Wednesday, Oct 8, 2025🔮 AMEX:SPY / SP:SPX Scenarios — Wednesday, Oct 8, 2025 🔮
🌍 Market-Moving Headlines
🚩 FOMC Minutes drop: Traders zero in on the Fed’s tone around balance sheet runoff and rate-cut timing clues.
📉 Macro sentiment reset: Bond yields + USD volatility remain key — equities tracking real-rate shifts post-minutes.
💬 Fed chorus continues: Barr, Kashkari, and Goolsbee headline a dense speaker lineup shaping policy narrative.
💻 Tech leadership check: Mega-caps face another liquidity test as macro dominates tape action.
📊 Key Data & Events (ET)
⏰ 9:20 AM — Alberto Musalem (St. Louis Fed) remarks
⏰ 9:30 AM — Michael Barr (Fed Governor) speech
⏰ 🚩 2:00 PM — FOMC Minutes (September Meeting)
⏰ 3:15 PM — Neel Kashkari (Minneapolis Fed) speech
⏰ 5:45 PM — Michael Barr (Fed Governor) remarks
⏰ 7:15 PM — Austan Goolsbee (Chicago Fed) speech
⚠️ Disclaimer: Educational/informational only — not financial advice.
📌 #trading #stockmarket #SPY #SPX #FOMC #Fed #Powell #Barr #Kashkari #Goolsbee #minutes #bonds #Dollar #economy #megacaps

BTC HOLDS LEVELS FOR MORE..BTC/USDT — Main Trend Holds Strong at $112K, Confirmation Near
Bitcoin is currently trading just below the low time frame zone around $124.5K, showing slight resistance before a potential confirmation breakout. Despite this minor pullback, the main trend remains firmly intact around $112K, which continues to act as the key structural support.
⚙️ Main trend updated to $112K: This level defines Bitcoin’s long-term bullish structure — as long as BTC stays above it, momentum remains positive.
📉 Below low time frame: BTC is temporarily consolidating under local resistance, but proximity to this level suggests a potential re-test and confirmation soon.
🚀 Upside target: Once the low time frame confirms, Bitcoin could aim for the next resistance zone near $132K.
Technical Outlook:
🟢 Main Trend (Support): $112K
🟡 Low Time Frame Resistance: $124.5K
🎯 Next Target: $132K (upon confirmation)
Summary:
BTC remains structurally bullish above the $112K main trend. While still slightly below the short-term confirmation zone, it’s positioned well for a potential continuation — provided support holds and price regains momentum above $124.5K.
📊 Bias: Cautiously Bullish
📈 Key Levels: Support $112K | Resistance $124.5K | Target $132K

$SPY / $SPX Scenarios — Tuesday, Oct 7, 2025🔮 AMEX:SPY / SP:SPX Scenarios — Tuesday, Oct 7, 2025 🔮
🌍 Market-Moving Headlines
🚩 Shutdown overhang: The U.S. Trade Deficit release remains at risk; traders lean on Fed commentary for macro tone.
📉 Rates + dollar watch: Treasury yields stay elevated ahead of FOMC Minutes (Wed); AMEX:SPY sensitivity to TVC:DXY remains high.
💬 Fed parade: Five speakers on deck — market parsing for any shift in post-Powell narrative.
💻 Tech + liquidity: $AAPL/ NASDAQ:MSFT flows continue driving AMEX:XLK rotation amid tightening liquidity backdrop.
📊 Key Data & Events (ET)
⏰ 🚩 8:30 AM — U.S. Trade Deficit (Aug)
⏰ 10:00 AM — Raphael Bostic (Atlanta Fed) speech
⏰ 10:05 AM — Michelle Bowman (Fed Vice Chair for Supervision) remarks
⏰ 10:45 AM — Stephen Miran (Fed Governor) speech
⏰ 11:30 AM — Neel Kashkari (Minneapolis Fed) speech
⏰ 3:00 PM — Consumer Credit (Aug)
⚠️ Disclaimer: Educational/informational only — not financial advice.
📌 #trading #stockmarket #SPY #SPX #Fed #Powell #Bostic #Bowman #Kashkari #Miran #tradebalance #shutdown #bonds #Dollar #megacaps #economy
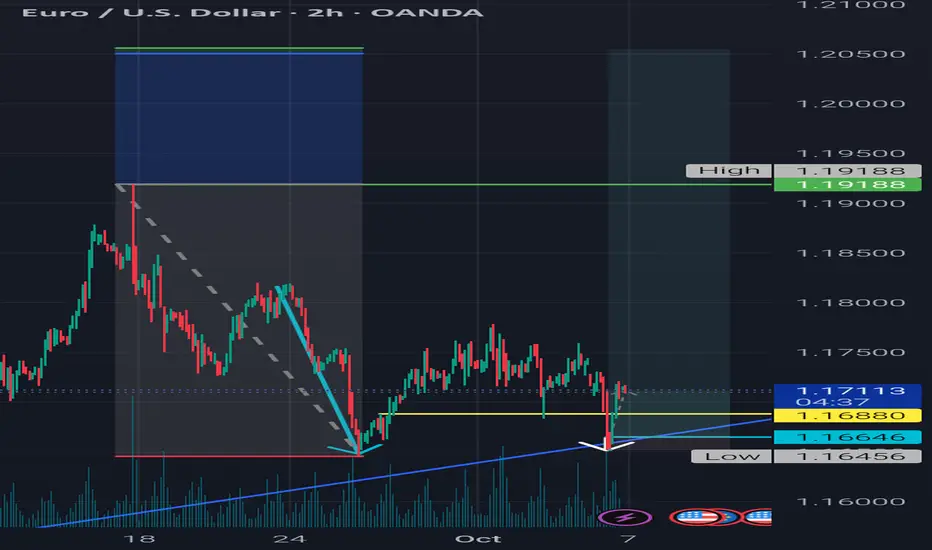
Momentum-Backed Retracement + Volume Retest | BadgerFX 📊 This setup establishes directional bias from the monthly chart (Current Bias: 📈 Bullish). The trade idea integrates momentum-driven retracements in line with this bias and validates continuation through structure and volume on the 15m.
📍 1.16880 confirmed the shift in structure, supported by volume, reinforcing alignment with the monthly trend. Final execution 🎯 relies on candlestick precision for entry timing.
⚠️ Disclaimer: The information shared here is for educational and entertainment purposes only and should not be considered financial advice.
BadgerFX 🦡 – Honey Badger Don’t Care