marketreview Greetings, traders.
I’d like to comment on the current crypto market situation to clarify why there has been little analysis published in the group recently.
In my opinion, the market is currently in a state of indecision — it lacks a clear directional bias. Consequently, there are no clean charts or structures that would hint at the future trend.
For now, we are simply moving sideways with occasional price spikes up and down. However, this volatility is chaotic, and trading it is, in my view, a lottery.
I have seen this before, and the only correct decision is to wait for better conditions. This market phase is not eternal; the longer it lasts, the closer its end.
I scan the market daily looking for a high-probability setup. But if I don't find anything — I won't publish anything. Better to stay flat than to force a bad trade.
The Traders House
Marketanalysis

USD/CAD Forecast: Bearish Momentum Builds on Data ReturnThe Tide Turns
The USD/CAD exchange rate is losing bullish momentum. Trading near 1.3765, the pair struggles to find direction amidst a broader U.S. Dollar stall. A pivotal shift is underway as the holiday-induced lull ends. Domestic Canadian data is returning to the driver's seat. The market must now account for this potential decoupling from broad USD trends.
Macroeconomics: The Data Resurgence
The macroeconomic landscape is shifting focus back to Canada. The recent lack of domestic news forced the Loonie to follow the Greenback’s lead. This dynamic ends now. High-impact Canadian releases, including PMIs and trade figures, are imminent. Friday’s employment report stands as the critical catalyst. Recent data shows Canadian economic resilience. If upcoming numbers confirm this strength, the Canadian Dollar will likely outperform its U.S. counterpart.
Technical Analysis: Algorithmic Hesitation
Market technology and technical patterns signal exhaustion. Algorithmic trading models are struggling to push prices higher. The short-term setup appears neutral to mildly bearish. The rebound from December lows is officially losing steam. Intraday price action reveals significant hesitation rather than a clean bullish extension. The 1.3810 resistance level serves as a critical ceiling that defines the current upper bound.
Geostrategy and Industry Trends
Canada’s export-heavy economy remains sensitive to global trade currents. The upcoming trade figures will reveal the health of cross-border commerce. A strong trade surplus reinforces the Loonie’s geostrategic value. Conversely, U.S. economic strength appears priced in. The divergence between a resilient Canadian export sector and a stalling U.S. dollar rally creates a distinct market dynamic. Commodity-linked currencies like the CAD are poised to capitalize on any U.S. weakness.
Leadership and Monetary Policy
Central bank management drives long-term valuation. The Bank of Canada (BoC) and the Federal Reserve are entering a divergent phase. Previous better-than-expected Canadian data empowers the BoC to maintain a firm stance. In contrast, the Fed faces questions about the durability of U.S. growth. This policy divergence favors the CAD. Data will directly impact the forward guidance from Canadian policymakers.
Conclusion: A Drift Lower?
The path of least resistance currently points lower for the pair. If Canadian data reasserts itself and the broader U.S. dollar rally continues to fade, the exchange rate likely faces downward pressure. The focus remains on whether the pair can hold current support levels or if the bearish momentum will drive a deeper correction.

LINKUSDT: long setup from daily resistance at 13.355Regarding BINANCE:LINKUSDT.P the level of 13.355 (formed on Dec 5) has been identified. Look at how precisely the price hit it today.
However, the asset has already covered nearly twice its average daily range compared to the last two weeks. Due to this, the probability of a breakout drops slightly — the asset might simply lack the energy to break through.
Nevertheless, the clear confirmation of this level means it is definitely worth watching. If a clean entry point forms, specifically with low volatility right in front of the level, that will be a signal for a Long.
The scenario I expect:
Volatility contraction on approach
Momentum stall at the level
Prolonged consolidation │ Довга консолідація
Closing near the level
Closing near the bar's extreme
The chart displays negative factors:
Yesterday's bar closed far from the level
Was this analysis helpful? Leave your thoughts in the comments and follow to see more.

TAKEUSDT: short setup from daily support at 0.11000This case study highlights the critical significance of the asset's Listing Price level. At a minimum, it acts as a strong psychological barrier. At best, after 118 days of trading, we witnessed a pixel-perfect retest of this exact level — just look at how powerful the subsequent drop was.
I prioritize such setups because they heavily tilt the scales from a standard 50/50 toss-up to a solid statistical advantage in my favor. Several other confluence factors also strengthened this scenario, boosting the trade's profitability above the baseline. Clean charts like this are a rarity.
Relative to the 72% crash, the BINANCE:TAKEUSDT.P displays zero intent to correct, at least for now. The longer the accumulation continues above this support, the higher the likelihood of a breakdown. This market anomaly signals either a total vacuum of buyers or overwhelming selling pressure.
The scenario I expect:
Price void / low liquidity zone beyond level
Asset decoupled from the market (relative strength/weakness vs. BTC)
Momentum stall at the level
No reaction after a false break
Closing near the level
Closing near the bar's extreme
The chart displays negative factors:
Lack of consolidation
Was this analysis helpful? Leave your thoughts in the comments and follow to see more.

XAUUSD Buy Setup | Strong Support + Bullish Structure📌 Trade Plan:
🔓 Entry: 4455 - 4460
❌ Stop Loss: 4440
🎯 Target: 4480 NEXT Target 4500
Gold (XAUUSD) is showing bullish strength after holding a key demand zone, and price action suggests buyers are stepping in from support. A buy position is considered in the 4455–4460 zone with a well-defined stop loss below 4440 to manage risk. If bullish momentum continues, the first upside target is 4480, while the final target is placed near 4500, aligning with the next resistance area. Trade is based on structure, support validation, and controlled risk management.

DEC.21,2025 ANALYSIS- DXY, BTC, NAS100, SPX500, XAUUSD & XAGUSDDXY CAUTION BEARISH: Weekly closing with a strong Bullish hammer candle suggests resistance block as shown could be broken for further upside. However due a hidden bearish divergence on RSI supported by the 21 EMA crossover resistance zone gives Bears an equal opportunity for reversal. I am personally watching a 5 wave pattern to bring the dollar index to a target around 96.961 This will ultimately close the gaps that occurred on October 5th to October 7th which also corresponds to the daily chart double tops target.
BITCOIN: STILL BEARISH, BTC has consolidated for the last 4 weeks now in a channel consolidation suggesting a bearish continuation rather than an accumulation for reversal. On the daily chart price has now exited the Bearish Flag pattern and I think based on the daily double tops rejection of the fib 0.382 retrace level within the bear flag formation, this week price action could gains momentum for the downtrend to test the liquidity zone of $80,524 and put the next target around $74k zone.
NAS100 & SPX500 WIDE RANGE TRADE: Both indices closed last week with a strong Bullish candles. Whiles our lower targets from last week wasn't achieved we got close enough. The setup this week spells caution as the gaps from last week's trade could now be filled as price is poised to test the all time high resistances again.
GOLD & SILVER ALMOST TOPPING: Gold on the weekly chart has hit a perfect double top with divergences on indicators like RSI and MACD. However, we still closed the week with a green candle suggesting that price could move towards $4,475 before getting rejected. The divergences don't give me a comfortable long position and so I will stay on the sideline and wait for confirmations for pullback trade towards the weekly 21 EMA.
Silver is still in a last wave and also ending so there is not much reward for the risk. My up target is about $68.38 before the major pullback. There are already divergences on the both daily and weekly chart but these divergences don't make the risk reward attractive for a long trade.
I hope my publications are helpful to your own analysis and perspective. Thank you and please show your support for these analysis with a boost or comment so it's shown to other traders and gets featured on Trading View editors desk. Have a great and profitable trading week and remember risk management is your first job as a trader. Cheers!!

EURUSD ANALYSIS & FORECAST | Wave Structure That WORKSEURUSD MARKET ANALYSIS & FOREX FORECAST: Wave Structure Breakdown
Complete market analysis using wave structure methodology. High-probability sell entry executed with 2:1+ risk: reward targeting break below momentum low.
📊 TOP-DOWN MARKET ANALYSIS:
Recent High: 1.18042 (Tuesday, 17th December 2025)
Since making this momentum high, EURUSD has been attempting to complete its bearish secondary trend (pullback/correction phase).
🌊 1HR CHART WAVE STRUCTURE:
Wave Count Analysis:
Price has printed two momentum lows:
Wave 1 Momentum Low ✓
Wave 3 Momentum Low @ 1.17024 ✓
Current Position: Wave 4 (Bullish Pullback)
The current bullish run is Wave 4, a pullback from Momentum Low 3 to a structural point. This wave should terminate below Wave 2 (trend invalidation point).
🎯 FOREX FORECAST - What's Next:
Expected Move:
Once Wave 4 completes, we expect a break below Momentum Low 3 (1.17024) to form Wave 5 and complete the larger bearish structure.
💡 Why This WORKS - Objectivity Through Structure:
This market understanding and price behaviour analysis allows us to be:
✅ Objective - No emotion
✅ Clear - No guessing
✅ Strict - Follow the rules
We know exactly what we're looking for and when to act.
🔬 ADVANCED EXECUTION - Internal Wave Analysis:
Method: Isolating the minor wave within the major swing
Focus Area: Wave 4 → Wave 5 (final leg of this Wave 4 structure)
Fractal Nature Applied:
Counted the internal bars based on fractal, what WORKS on big timeframes WORKS on small timeframes. This is the beauty of understanding the wave structure.
💼 TRADE EXECUTION:
Entry: Internal Wave 5 completion @ 1.07454
Why This WORKS:
This timing is a key component of the WavesOfSuccess methodology because it provides:
✅ High-probability entries
✅ Low-risk execution
✅ Optimal entry at reversal point
Stop Loss: 1.1763 (17.6 pips risk)
Target: Break below 1.1703 (72.4 pips potential)
Risk:Reward: >2:1 (2.05:1 minimum, potential for more)
Key Principle:
Wave structure provides the roadmap. Fractals ensure consistency across timeframes. Precision timing creates asymmetric risk: reward opportunities.
This is market analysis that WORK, it is mechanical, objective and repeatable.
👍 Boost if this market analysis helps
👤 Follow for continued EURUSD FOREX FORECAST updates

XAUUSD Bullish Continuation SetupXAUUSD – H1 Timeframe Bullish Analysis
Overall Trend
XAUUSD is respecting a bullish trendline, which confirms that the market is still in an uptrend.
Price is forming higher lows, indicating that buyers are in control of the market.
As long as the bullish trendline holds, the market bias remains bullish.
Demand Zone
The confluence of the demand zone and the bullish trendline strengthens the probability of upward continuation.
Buyers are likely to defend this zone.
Triangle Pattern
Price is forming a symmetrical / ascending triangle.
This pattern usually acts as a continuation pattern in an uptrend.
Price compression inside the triangle indicates that a strong breakout is likely.
Breakout Expectation
A clean H1 candle close above the triangle resistance will confirm a bullish breakout.
After the breakout, price is expected to move toward the next all-time high (ATH) at 4420.
MACD Indicator
MACD is showing bullish momentum stabilization.
The contraction of the histogram suggests that momentum is building and an expansion may follow soon.
A bullish MACD crossover or expansion above the zero line will further support the upside move.
Trade Plan (Bullish)
Buy Entry: now 4327 or after the triangle breakout.
Stop Loss: 4305
Take Profit:
TP1: Previous high 4355
TP2: Next resistance 4390
Final Target: ATH 4420
Disclaimer
This chart is for educational purposes only and does not constitute financial advice. Trading involves high risk; always conduct your own research and use proper risk management.

WETUSDT: : short setup from daily support at 0.17900BINANCE:WETUSDT.P has been falling practically since its listing. Today, the price hit the all-time low formed 2 days ago, and it is noteworthy that it hit the 0.179 level precisely. This level is now confirmed. All that remains is to wait for the market to be ready for its break. It is important to wait for the signals listed below, in a list format, before taking any short, as the asset is new and not entirely predictable.
Key factors for this scenario:
Global & local trend alignment
Price void / low liquidity zone beyond level
Volatility contraction on approach
Immediate retest
Repeated precise tests of the level
Closing near the level
Closing near the bar's extreme
Factors that contradict this scenario:
Lack of consolidation
Was this analysis helpful? Leave your thoughts in the comments and follow to see more.

1000LUNCUSDT.P: short setup from daily support at 0.04315BINANCE:1000LUNCUSDT.P , following a strong rally, consolidated briefly and then started returning to where it came from, as is often the case. We currently have a local level at 0.04315, above which the price is consolidating. The crucial criterion in this situation will be to wait for the daily bar close (UTC). If the close is near the level and close to the day's low, these will be good signals for a short position.
Key factors for this scenario:
Price void / low liquidity zone beyond level
Volatility contraction on approach
Immediate retest
Closing near the level
Closing near the bar's extreme
Factors that contradict this scenario:
Lack of consolidation
Was this analysis helpful? Leave your thoughts in the comments and follow to see more.

XAUUSD BUY SETUPGOLD — Trade Setup
📈 Bias: Bullish
🎯 Entry: 4315 / 4325
🛑 Stop Loss: 4305
🎯 Target: 4355
📊 Technical Reasoning:
Gold is maintaining bullish momentum after holding above a key support zone. The entry area is positioned where buyers are expected to defend price and continue the move higher. The stop loss is placed beyond the invalidation level to manage downside risk, while the target is aligned with a higher liquidity objective and continuation structure.
📌 Execution Plan:
* Buy from the marked entry zone
* Apply disciplined risk management
* Monitor price behavior as it approaches the target
❌ Invalidation:
A clear break and close below 4305 would invalidate this bullish setup.
💬 Do you expect continuation toward 4355, or consolidation before the next leg up?
⚠️ This analysis is for educational purposes only. Not financial advice.

MASSIVE RALLY OR MASSIVE CRASH...In this video we will talk about if the markets are in store for a MASSIVE RALLY OR MASSIVE CRASH...
NASDAQ:QQQ AMEX:SPY AMEX:IWM

XAUUSD 📊 GOLD UPDATE — Key Levels in Focus! 🔥
Gold is reacting from a significant zone, and current structure suggests a possible move toward the upside if price holds above support. Market reaction near these levels will define the next direction.
📌 Trade Levels:
• 🔓 Entry: 4277
• ❌ Stop Loss: 4244
• 🎯 Target: 4301
Price behavior near resistance will be important — confirmation and risk management matter.
💬 What’s your bias from here — continuation or pullback?
👍 Like & comment to support the idea and share your perspective.
⚠️ Disclaimer: This analysis reflects personal market observation and is shared for informational purposes only.

Why Traders Lose More Money on Monday MorningsWhy Traders Lose More Money on Monday Mornings
A trader opens a position at 9:35 AM on Monday. An hour later, closes with a stop loss. Same trader, same strategy, but Wednesday afternoon. Opposite result.
Coincidence? No.
The market changes not just in price. It changes in mood, speed, and aggression of participants. And this depends on time.
Monday Morning: When Emotions Rule
The weekend is over. Traders have accumulated news, opinions, fears. The first hour of trading resembles a crowd at a sale. Everyone wants to enter first.
The problem is decisions are made on emotions, not analysis. Volatility spikes. Spreads widen. False breakouts happen more often.
Research shows: Monday brings traders the highest proportion of losing trades for the week. Psychology works against you from the start.
Asian Session vs American
At 3 AM Moscow time, Tokyo opens. Movements are smooth, predictable. Ranges are narrow.
Then London joins. Speed increases. Volumes triple.
New York adds chaos. From 4:30 PM to 6:00 PM MSK, the market becomes a battlefield. US news overlaps with European position closures.
Different sessions require different psychology. Asia loves patience. Europe demands speed. America tests nerves.
Friday Afternoon: Trap for the Greedy
By Friday, traders are tired. More decisions made than the entire week. Willpower reserves are depleted.
After lunch, many just want to close the week. Mass position closing begins. Trends break. Patterns stop working.
But the most dangerous thing: the desire to "recover for the week." A trader sees the last chance to fix results. Enters risky trades. Increases lot size.
Broker statistics confirm: Friday after 3 PM MSK collects more stop losses than any other time.
Ghost Hours
There are periods when the market technically works, but better not to trade.
From 10 PM to 2 AM MSK, America closed, Asia still sleeping. Liquidity drops. One large order can move price 20 pips.
European lunch time (1 PM-2 PM MSK) is also treacherous. Volumes freeze. Price marks time. Then suddenly shoots in any direction without reason.
Trading these hours resembles fishing in an empty pond. You can sit long and catch nothing.
How Time Affects Your Thinking
Fatigue accumulates. In the morning you analyze each trade. By evening you just click on the chart.
Biorhythms dictate concentration. Peak performance for most people falls at 10 AM-12 PM. After lunch comes a decline. By 5 PM, risk assessment ability drops 30%.
Add caffeine, sleep deprivation, personal problems. Your state changes perception of the same situation on the chart.
Wednesday: The Golden Middle
Statistics say: Wednesday gives the most stable results.
Monday emotions passed. Friday fatigue hasn't arrived yet. Market works in normal mode without surprises.
Most professional traders concentrate activity right in the middle of the week. Less noise, more patterns.
Find Your Time
No universal recipe exists. Some trade Asian session excellently. Others catch New York volatility.
Keep a journal not just on trades, but on time. Mark when you make the best decisions. When you make impulsive mistakes.
After a month you'll see a pattern. Perhaps your brain works clearer in the evening. Or Mondays really bring only losses.
Adapt your schedule to biology, not to the desire to trade 24/7.
Time as a Filter
Experienced traders use time as an additional entry filter.
Good setup on Monday morning? Skip it. Same setup on Wednesday? Take it.
Buy signal at 11 PM? Wait for Tokyo opening. No point risking with low liquidity.
Time doesn't cancel strategy. But it adds probability in your favor.
What the Numbers Say
Data from thousands of accounts show clear patterns:
Monday: minus 2-3% to average profitability
Tuesday-Thursday: stable results
Friday: minus 1-2% after 3 PM
Night sessions: unprofitable for 78% of traders
London-New York overlap: maximum profit for scalpers
Numbers don't lie. Psychology is real.
Final Word
You can have the best strategy in the world. But if you trade at the wrong time, results will be average.
The market doesn't change. People trading in it change. Their fatigue, fear, greed, inattention.
Time of day and day of week determine who is in the market now and in what state. And this determines how price will move.
Choose trading time as carefully as you choose entry point. Many traders add time filters to their strategies or use indicators that help track session activity.

GOLD UPDATE📈 GOLD UPDATE — Levels on Watch!
Gold is reacting around a key price zone, and this move could get interesting from here 👀✨
🔓 Entry Level: 4,291
❌ Stop Loss: 4,248
🎯 Target: 4,320
Market momentum is being closely watched at this level. A sustained move could open the way toward the target zone.
What’s your view on Gold from here?
Bullish or bearish?
Share your thoughts below — let’s get a discussion going! ⬇️💬
Your support helps this reach more traders 👍
Disclaimer: This is not financial advice; it reflects only my personal market analysis. Please do your own research before trading.

USOIL UPDATE📊 USOIL UPDATE — Key Levels in Focus! 🔥
Price is testing an important zone, and traders are closely watching for the next move. Momentum around these levels could indicate short-term strength or weakness in the market.
🔓 Entry Level: 57.48
❌ Stop Loss: 56.91
🎯 Target: 58.03
Keep an eye on how price reacts here — structured levels like these help spot potential opportunities while managing risk effectively.
💬 What’s your outlook on USOIL?
Bullish or bearish? Share your thoughts below and join the discussion! ⬇️
Your engagement helps this post reach more traders and boosts visibility on feeds 👍
Disclaimer: This post is for educational and informational purposes only. It reflects personal chart observation and is not financial advice. Please do your own research before trading.

US30 UPDATE📈 US30 UPDATE — Levels on Watch!
Price is reacting around an important zone, and this setup could get interesting from here 👀🔥
🔓 Entry Level: 48,467
❌ Stop Loss: 48,174
🎯 Target: 48,727
Market reaction at this level will be key. If momentum builds, price may extend toward the target zone, while risk remains defined below the stop.
What’s your take on US30 from here?
Bullish or bearish?
Share your thoughts below — let’s get a discussion going! ⬇️💬🔥
Your like/support helps this reach more traders 👍
Disclaimer: This is not financial advice; it reflects only my personal market analysis. Please do your own research before trading.

DEC.14,2025 ANALYSIS- DXY, BTC, NAS100, SPX500, XAUUSD & XAGUSDDXY BEARISH: Weekly closing with a strong bearish candle for continuation to the downside after a small bounce to about 98.186 from the support zone of 97.820 or most likely sideways consolidation for this coming week. Ultimately, the gaps that occurred on October 5th to October 7th will be filled putting our next fall target to about 97.200 which also corresponds to the daily chart double tops target.
BITCOIN: STILL BEARISH, BTC has consolidated for the last 3 weeks and I think based on the daily double tops rejection of the fib 0.382 retrace level within the bear flag formation, this week actually gains momentum for the downtrend to resume with initial target at the liquidity zone of $80, 524 and a clear breakdown of the Bear flag trend line will put the next target around $74k zone.
NAS100 & SPX500 BEARISH: Both indices closed last week with a strong bearish engulfing candles. This confirms the retrace towards the highs is now completed and next leg down to targets of about $23,169 for Nas100 and $6,418 for SPX500 is highly probable this week.
GOLD & SILVER SIDEWAYS: Gold on the weekly chart has hit a double top with divergences on indicators like RSI and MACD. With a green closing candle on the weekly it's likely the tops of $4,381 could be tested before the pullback. Momentum is flat hence price could stays sideways first before the pullback. However, the daily chart is giving us a rejection candle from the previous high so I think a double tops could form unless a clear breakout occurs. Silver is in a last wave and also ending so there is not much reward for the risk. My up target is about $68.38 before the major pullback. There are already divergences on the both daily and weekly chart but these divergences are not confirmed until next week's candle print.
I hope my publications are helpful to your own analysis and perspective. Thank you and please show your support for these analysis with a boost or comment so it's shown to other traders and gets featured on Trading View editors desk. Have a great and profitable trading week and remember risk management is your first job as a trader. Cheers!!

GOLD UPDATE📉 SELL SETUP ACTIVE — Levels on Watch!
Price is reacting around an important zone, and this setup could get interesting 👀🔥
🔓 Entry Levels: 4239 / 4242
❌ Stop: 4378
🎯 Target: 4286
What’s your take on this move?
Bullish or bearish from here?
Share your thoughts below — let’s get a discussion going! ⬇️💬🔥
Your like/support helps this reach more traders 👍
⚠️ Disclaimer: This is not financial advice. Always do your own research and manage your risk.

An Urgent Warning to ALL Traders & InvestorsWhat in the world just happened to the market today? NASDAQ:QQQ AMEX:SPY AMEX:IWM
That’s exactly what we’re breaking down—calmly, logically, and from an investor’s perspective.
In this video, I walk through the major indexes ( NASDAQ:QQQ , AMEX:SPY , and AMEX:IWM ) across multiple timeframes to explain the pullback, what *could* be driving it (macro fears, rates, inflation/GDP concerns), and the two paths the market may take next.
We also cover the VIX spike (but still at relatively low levels), COR3M/market stress, and what I’m seeing in crypto (BTC and ETH) as part of the broader “risk-on/risk-off” puzzle.
The key takeaway: this is a choppy “kangaroo market.” I lay out the bullish bounce scenario vs. the bear structure scenario, and the specific levels that would confirm either direction—so you can stay prepared, not emotional.
Not Financial Advice - DYOR

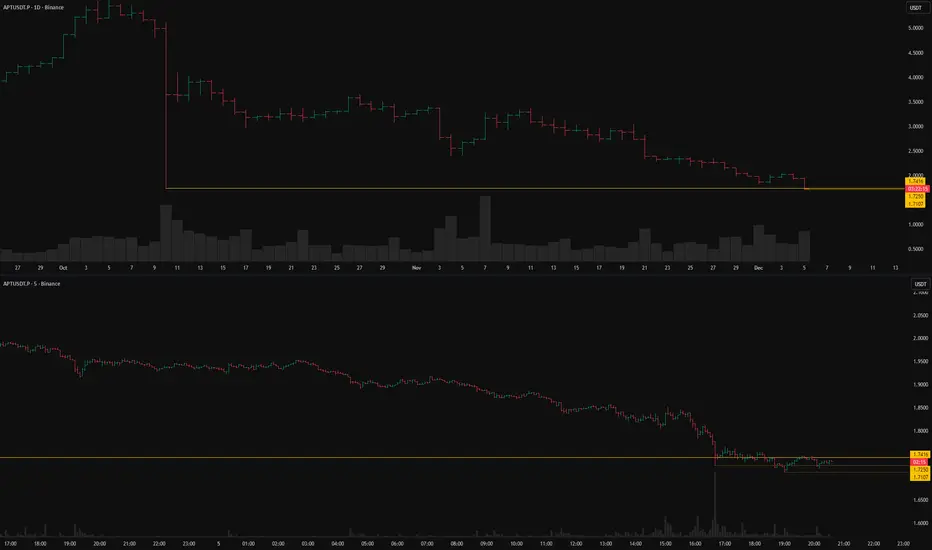
APTUSDT: short setup from daily support at 1.7416BINANCE:APTUSDT.P has approached a strong level at 1.7416. Today we are seeing a breakout attempt, but the lack of impulse suggests it might be a false break. However, we are also missing the sharp rejection (bounce) typical of a defended level. Instead, the price is "sawing" around the level. Therefore, it is prudent to either wait for a clear entry point from a newly formed local level or wait for the daily bar to close below the level and near its absolute low. Such a close would confirm price acceptance and the major players' intent to push the asset further down.
Key factors for this scenario:
Global & local trend alignment
Price void / low liquidity zone beyond level
Correlation with the market
No reaction after a false break
Closing near the level
Closing near the bar's extreme
Factors that contradict this scenario:
Yesterday's bar closed far from the level
Lack of consolidation near the level on the working lower timeframe
Was this analysis helpful? Leave your thoughts in the comments and follow to see more.
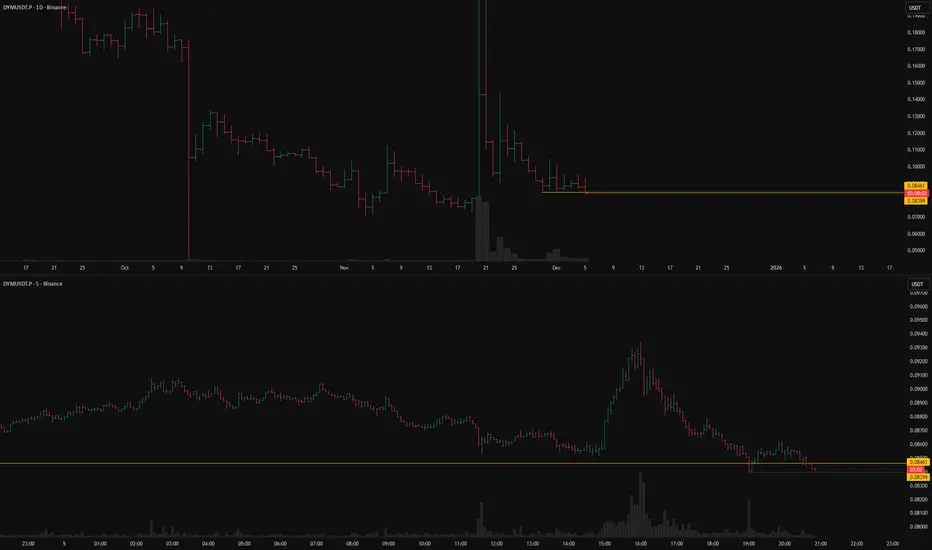
DYMUSDT: short setup from daily support at 0.08461BINANCE:DYMUSDT.P has been holding above the level for nearly a week, confirming it multiple times. Recently, we saw a test via a false breakout, followed by only a shallow correction, and now the price is approaching the support again. This weak reaction from buyers is a good signal. In my opinion, a solid short setup is forming here from the local level at 0.08399.
Key factors for this scenario:
Global & local trend alignment
Correlation with the market
Volatility contraction on approach
Immediate retest
No reaction after a false break
Was this analysis helpful? Leave your thoughts in the comments and follow to see more.
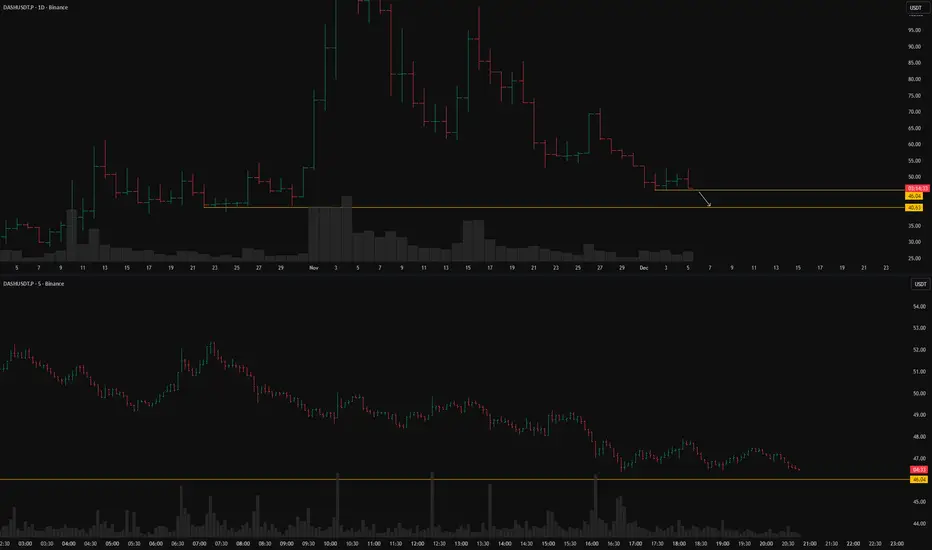
DASHUSDT: short setup from daily support at 40.63BINANCE:DASHUSDT.P is consolidating on the lower timeframe right above the level. This is a strong signal, although ideally, I would prefer to see at least one clear test (a price touch) of the level. However, perfect setups are rare, so I consider the overall situation very promising. On the Daily timeframe, the asset has been holding above support for 5 days, confirming the level multiple times. Given the general bearish trend of the market, we have all the prerequisites for a solid short trade. All that remains is to wait for the entry trigger.
Key factors for this scenario:
Correlation with the market
Volatility contraction on approach
Immediate retest
Prolonged consolidation
Factors that contradict this scenario:
Yesterday's bar closed far from the level
Was this analysis helpful? Leave your thoughts in the comments and follow to see more.