CURRENT MARKET CONTEXT I SEP/18/2025🧭 CURRENT MARKET CONTEXT
- After FOMC, gold spiked to 3699 before dropping sharply to the support zone at 3645–3656.
- The H1 structure was slightly broken but has not yet formed a clear lower high → the market may still be in accumulation.
- Val zone ~3670, PoC ~3681, and Swing VaH ~3699 remain key resistance areas.
- The medium-term uptrend still has potential as long as 3645–3650 support holds.
🟢 SCENARIO 1 – BUY at Demand Zone 3645–3650 (H1 Wick + Trendline)
✅ Reason for entry:
Confluence of H1 & H4 wick
Previous uptrend line
Post-FOMC rejection
This is a technical pullback zone after the news-driven drop → short-term BUY on rebound.
🎯 Trade details:
Entry: 3645–3650
SL: below 3636
🟡 SCENARIO 2 – QUICK BUY at 3660–3665 (Val + Trendline)
✅ Reason for entry:
Important Val zone recently broken → could be retested.
If price reacts positively around 3660–3665 → potential for short-term rebound.
🎯 Trade details:
Entry: 3660–3665
SL: below 3645
🔴 SCENARIO 3 – SHORT SELL at 3680–3685 (PoC + Trendline Retest)
✅ Reason for entry:
Trendline was broken → retest at PoC + old trendline may provide a technical SELL point.
If price rises to 3680–3685 but fails to hold → likely rejection and continuation down.
🎯 Trade details:
Entry: 3680–3685
SL: above 3695
⚠️ SCENARIO 4 – WAIT FOR SELL BREAKDOWN below 3645
✅ Reason for entry:
If price breaks firmly below 3645 → major support lost → medium-term bearish signal.
Potential target at old Demand zone ~3630 or deeper toward 3617.
🎯 Trade details:
Entry: SELL after 3645 breaks and failed pullback
SL: above 3660
Marketanalysis

BTC Price Action: Bulls vs BearsBitcoin has shown a gradual recovery after a prolonged corrective phase, with market structure leaning toward a constructive buildup. Fundamentally, sentiment is influenced by global macro conditions—investors are watching U.S. monetary policy signals, while stable demand from institutions and long-term holders continues to provide a supportive backdrop. On-chain activity remains steady, with balanced exchange inflows and outflows suggesting no extreme directional pressure in the near term.
From a technical perspective, the market has shifted momentum from bearish flows into a developing bullish sequence. The recent break of structure on the 4H timeframe highlights strengthening upside intent, though price is still moving within a broader accumulation phase. Current flows suggest the possibility of a short-term dip for liquidity before continuation to higher levels, aligning with the overall constructive weekly outlook.

Can Britain's Stock Market Survive Its Own Streets?The FTSE 100's recent 10.9% year-to-date outperformance against the S&P 500's 8.8% return masks deeper structural vulnerabilities that threaten the UK market's long-term viability. While this temporary surge appears to be driven by investor rotation away from overvalued US tech stocks toward traditional UK sectors, it obscures decades of underperformance: the FTSE 100 has delivered just 5.0% annualized returns over the past decade, compared to the S&P 500's 13.2%. The index's heavy weighting toward finance, energy, and mining, combined with minimal exposure to high-growth technology firms, has left it fundamentally misaligned with the modern economy's drivers of growth.
The UK's economic landscape presents mounting challenges that extend beyond market composition. Inflation rose to 3.8% in July, surpassing forecasts and increasing the likelihood of sustained high interest rates that could dampen economic activity. Government deficits reached £20.7 billion in June, raising concerns about fiscal sustainability, while policy uncertainty under the new Labour government creates additional investor hesitation. Geopolitical instability has shifted risk appetite for 61% of UK institutional investors, with half adopting more defensive strategies in response to global tensions.
Most significantly, civil unrest has emerged as a quantifiable economic threat that directly impacts business operations and market stability. Far-right mobilisation and anti-immigration demonstrations have resulted in violent clashes across UK cities, with over a quarter of UK businesses affected by civil unrest in 2024. The riots following the Southport stabbing incident alone generated an estimated £250 million in insured losses, with nearly half of the affected businesses forced to close premises and 44% reporting property damage. Business leaders now view civil unrest as a greater risk than terrorism, requiring increased security measures and insurance coverage that erode profitability.
The FTSE 100's future hinges on its ability to evolve beyond its traditional sectoral composition while navigating an increasingly volatile domestic environment where political violence has become a material business risk. The index's apparent resilience masks fundamental weaknesses that, combined with the rising costs of social and political instability, threaten to undermine long-term investor confidence and economic growth. Without significant structural adaptation and effective management of civil disorder risks, the UK's benchmark index faces an uncertain trajectory in an era where street-level violence translates directly into boardroom concerns.

Mastering Market Rhythm Through Adaptation👋Welcome, everyone!
In my previous post, I shared “The Secret Formula: Time + Structure = 80% Win Rate!” – a powerful way to increase your trading accuracy. But here’s the truth: even the best formula won’t work if you apply it blindly to every situation.
That’s why today I want to dive deeper into the next key lesson:
👉 Mastering Market Rhythm Through Adaptation
Why is this important?
The market has its own rhythm. Sometimes it trends strongly, sometimes it ranges, and other times it becomes extremely volatile. If you try to force one strategy on every scenario, you’ll be out of sync – and out of money.
By adapting, you will:
Know when to trade aggressively and when to scale down.
Choose the right strategy for the right market phase.
Most importantly: protect your capital and survive long enough to thrive.
How to adapt in practice
- Identify the market condition: Trend – Range – High Volatility.
- Adjust your strategy:
Clear trend → trend-following.
Range-bound → trade support and resistance.
High volatility → reduce lot size, focus on risk control.
- Multi-timeframe analysis: H1 may look sideways while H4 shows a clear trend.
- Always prepare a Plan B: If the market shifts, you won’t be caught off guard.
Real-world examples
XAUUSD: Fed cuts rates → gold rallies → follow the trend.
EURUSD: Pre-news uncertainty, ranging between 1.0850 – 1.0950 → range trading.
BTCUSDT: ETF approval sparks huge volatility → cut position size, wait for stability.
Final thoughts
There is no “holy grail” in trading. The real edge comes from knowing how to dance in sync with the market’s rhythm . The formula Time + Structure shows you where and when, while market adaptation shows you how long you can stay in the game.
👉 Would you like me to share a live case study on XAUUSD , applying both Time + Structure and Market Condition Analysis step by step?

Can Innovation Survive Strategic Drift?Lululemon Athletica's shares plummeted 18% in premarket trading on September 5, 2025, following a dramatic reduction in annual sales and profit guidance that marked the second guidance cut of the year. The company's stock has declined by 54.9% year-to-date, resulting in a market capitalization of $20.1 billion. This drop in stock value comes as a reaction from investors to disappointing Q2 results, which showed only 7% revenue growth, reaching $2.53 billion. Additionally, there was a concerning 3% decline in comparable sales in the Americas, despite strong international growth of 15%.
The perfect storm hitting Lululemon stems from multiple converging forces. The Trump administration's removal of the *de minimis* exemption on August 29, 2025, eliminated duty-free treatment for shipments under $800, creating an immediate $240 million gross profit headwind in fiscal 2025 that's projected to reach $320 million in operating margin impact by 2026. This policy change particularly damages Lululemon's supply chain strategy, as the company previously fulfilled two-thirds of its U.S. e-commerce orders from Canadian distribution centers to bypass duties, while relying heavily on Vietnam (40% of manufacturing) and China (28% of fabrics) for production.
Beyond geopolitical pressures, Lululemon faces internal strategic failures that have amplified external headwinds. CEO Calvin McDonald acknowledged the company had become "too predictable with our casual offerings" and "missed opportunities to create new trends," which led to prolonged product life cycles, especially in lounge and casual wear, accounting for 40% of sales. The company is facing increasing competition from emerging brands such as Alo Yoga and Vuori in the premium segment. At the same time, it is dealing with pressure from private-label imitations that provide similar fabric technology at much lower prices. This trend is especially challenging in markets where consumers are more price-sensitive.
Despite maintaining an impressive portfolio of 925 patents globally, protecting unique fabric blends, and investing in next-generation bio-based materials through partnerships with companies like ZymoChem, Lululemon's core challenge lies in the disconnect between its robust intellectual property and innovation capabilities versus its inability to translate these strengths into timely, trend-setting products. The company’s future strategy requires decisive actions in three key areas: refreshing our products, implementing strategic pricing to counteract tariff costs, and optimizing the supply chain. All of this must be done while navigating a challenging macroeconomic environment, where American consumers are cautious and Chinese consumers are increasingly opting for local brands over premium foreign alternatives.

MARKET HOLDING SUPPORT-CAN BULLS BREAK 4,700RESISTANCEhi trader's
The market is currently holding near the support area of 4,250 – 4,350, showing signs of accumulation after a recent downtrend. This zone is acting as a base for a possible bullish move.
First Support (4,350): Price already tested and respected this level, showing strength from buyers.
Second Support (4,250): If the market dips further, this will be the next key area to watch for a bounce.
Risk Level (4,060): Below this level, bullish momentum weakens, so traders must stay cautious.
Resistance (4,700): If the price breaks above this barrier, a strong upward push toward the supply zone is likely.
Supply Zone (4,900): This is the main target area where sellers may re-enter the market.
👉 Based on the structure, if the market holds above support levels and breaks 4,700 resistance, there is potential for a move toward 4,900. However, if the market breaks below 4,060, then further downside risk opens
Do you think buyers have enough momentum to break the 4,700 resistance and push toward 4,900 supply zone?”
For more safe chart updates and learning-based signals, you can follow my profile and stay updated with fresh analysis

Technical Analysis for US500 (S&P 500)Closing Price: 6447.8 (16th Aug 2025, 12:50 PM UTC+4)
Analysis Methods: Japanese Candlesticks, Harmonic Patterns (ABCD, M/W), Elliott Wave, Wyckoff, Gann Theory (Time/Square of 9/Angles), Ichimoku, RSI, Bollinger Bands, VWAP, Moving Averages (MA/EMA/SMA/WMA).
---------------------------------------------------------------------------------------------
1. Long-Term Trend (Weekly/Monthly)
Elliott Wave:
US500 is in Wave 5 of a bull cycle (Wave 3 peak: 6500, Wave 4 dip to 6200).
Target: 6600–6700 (1.618 extension of Wave 1).
Gann Price Forecasting:
Square of 9: √6447.8 ≈ 80.30 →
Key resistance: 81² = 6561, support: 80² = 6400.
Break above 6561 targets 6724 (82²).
Ichimoku (Monthly):
Tenkan/Kijun: Bullish crossover (Tenkan: 6300 > Kijun: 6200).
Cloud: Price above Senkou Span (6100–6250) – bullish structure.
Moving Averages:
Weekly SMA(200): 6100 (major support).
Swing Outlook: Bullish but extended. Final Wave 5 targets 6600–6700.
2. Medium-Term Swing (4H/Daily)
Harmonic Patterns:
Bearish ABCD on Daily:
A: 6500 → B: 6350 → C: 6450 → D: 6470–6490 (1.272 BC extension).
Bullish Gartley (M Pattern) near 6350 (0.786 XA retracement).
Wyckoff Phase:
Distribution above 6450:
Upthrust at 6470 (16th Aug) on fading volume.
Lack of demand above 6460.
Gann Theory:
Time Window: Aug 19–22 (Square of 9 reversal cluster).
Price-Time Squaring: 6447.8 aligns with Aug 16 – consolidation likely.
Gann Angle: 1x1 support at 6420.
Indicators:
RSI(14) + Bollinger Bands (Daily):
RSI: 66 (neutral-bullish).
Price hugging upper BB(20,2) at 6475 – band expansion signals volatility.
VWAP (Weekly): 6380 (swing support).
Swing Trade Setup:
Short near 6470–6490 → Target 6400. Stop-loss: 6520.
Long near 6350 → Target 6500. Stop-loss: 6300.
3. Intraday Outlook (5M–4H)
Key Levels:
Resistance: 6460 (Gann 1x1), 6475 (daily high), 6490 (ABCD target).
Support: 6440 (VWAP), 6430 (Ichimoku cloud), 6420 (Gann angle).
Indicators:
Ichimoku (1H):
Tenkan: 6445, Kijun: 6435 → Price above both (weak bullish).
Cloud: Thin bullish (6425–6435) – intraday support.
RSI + Bollinger Bands (1H):
RSI(14): 59 (neutral).
Price testing mid-BB(20,2) at 6445 – break below signals bearish shift.
VWAP + MAs:
VWAP: 6442 (intraday pivot).
EMA(20): 6448 (resistance).
Candlestick Patterns:
4H Bearish Engulfing at 6465 → Reversal signal.
1H Evening Star at 6460 → Confirms weakness.
Gann Intraday Squaring:
Time Cycle: 14:00–16:00 UTC+4 (NY open) for volatility.
Price Harmony: Close below 6445 targets 6430 → 6420.
Intraday Trade Plan:
Sell below 6445 → Target 6430 (VWAP) → 6420 (Gann support).
Buy above 6465 only if RSI <65 → Target 6475.
Stop-Loss: 10–15 points.
Summary of Key Signals
Time Frame Bias Entry Target Stop-Loss
Intraday Bearish <6445 6440-6445 6420-6430 6455
Swing Bullish 6350-6370 6450-6500 6300
Swing Bearish 6470-6485 6400-6420 6520
Critical Events:
Gann Reversal Window: Aug 19–22 (watch for Fed minutes/Nvidia earnings).
Daily Close >6500 invalidates bearish patterns and targets 6561.
Risk Note: US500 is highly sensitive to tech earnings and Fed policy. Use tight stops during events.
Disclaimer: Technical analysis reflects historical patterns, not guarantees. Fundamental catalysts can override signals. Always use risk management.
For those interested in further developing their trading skills based on these types of analyses, consider exploring the mentoring program offered by Shunya dot Trade .( world wide web shunya dot trade )
I welcome your feedback on this analysis, as it will inform and enhance my future work.
Regards,
Shunya.Trade
world wide web shunya dot trade
⚠️ Disclaimer: This post is educational content and does not constitute investment advice, financial advice, or trading recommendations. The views expressed here are based on technical analysis and are shared solely for informational purposes. The stock market is subject to risks, including capital loss, and readers should exercise due diligence before investing. We do not take responsibility for decisions made based on this content. Consult a certified financial advisor for personalized guidance.

Potential Double Top on AUS200 — 4HPotential Double Top on AUS200 — 4H 📉
I’m watching the AUS200 index closely for a potential short setup.
The pattern in focus is a double top forming on the 4-hour timeframe.
#GTradingMethod Tip: Always manage your risk first before dreaming about the profits.
Trade Details:
📊 Risk/Reward: 3.9
🎯 Entry: 8 906.3
🛑 Stop Loss: 8 941.8
💰 Take Profit 1 (50%): 8 788.9
💰 Take Profit 2 (50%): 8 726.2
Please note: This is not financial advice. This content is to track my trading journey and for educational purposes only.

NASDAQ (CASH100) is Approaching KEY ResistanceSince 15 May, the Cash100 has been trading within an upward channel.
It’s now approaching diagonal resistance — will it hold, or break higher?
On the chart, I have marked every time NAS has tested the diagonal resistance and failed to break through.
I’ll be watching this area closely for shorts.
What do you think: will NAS continue climbing, or is a reversal coming?

LLY Is Overbought ---$615 Put Play**💊 LLY WEEKLY TRADE IDEA — BEARISH PRESSURE BUILDING**
📉 **Sentiment:** Strong bearish lean (70% confidence) — low RSI, high volume distribution.
📊 **Institutional Flow:** 1.7x weekly volume, puts stacking near key strikes.
⚠ **Risk:** Gamma risk + oversold → expect high volatility.
**🛠 Setup:**
* **Direction:** PUT (Short bias)
* **Strike:** \$615
* **Expiry:** 2025-08-15
* **Entry:** \$2.20 – \$2.40
* **PT:** \$3.30 (50-100% gain target)
* **SL:** \$1.20 (\~40-50% loss cap)
📌 **Why?**
* Daily RSI \~20, Weekly RSI \~33 → both falling
* Institutional selling pattern confirmed
* Bearish volume + neutral C/P ratio tilt
💡 *Timing is key — oversold = possible dead-cat bounce before breakdown to \$605 support.*

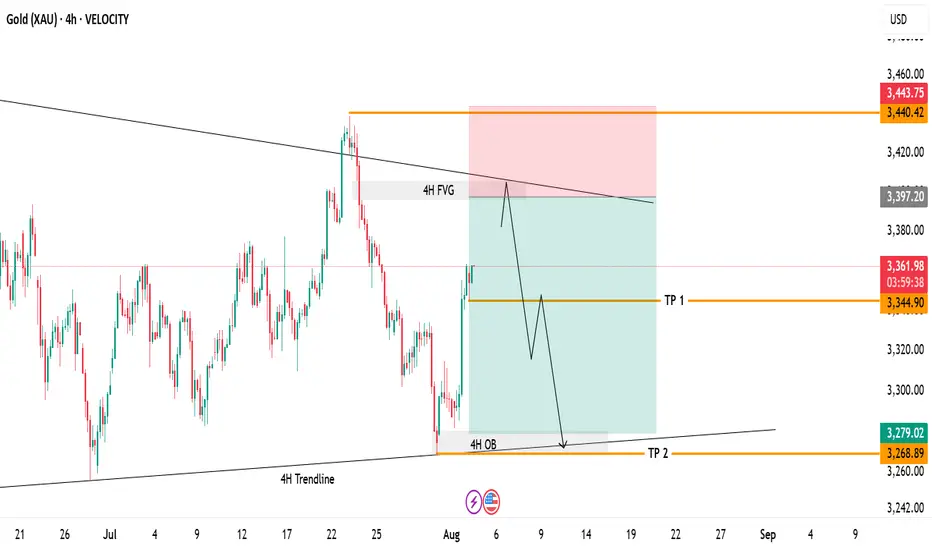
Gold 4H Swing Trade Setup!Currently watching price action as it approaches the 4H Fair Value Gap and descending trendline resistance. Price has not tapped this zone yet, and a move higher into this area could set up a potential reversal.
Setup Highlights:
4H FVG: 3,397–3,400 – Main area of interest.
Trendline Resistance: Confluence zone to watch for rejection.
Plan: Waiting for price to fill the imbalance and test the resistance before considering short entries.
Targets if Rejection Occurs:
TP1: 3,344 – First partial target.
TP2: 3,268 – 4H OB retest.
Invalidation:
A clear breakout and hold above 3,440 would invalidate the bearish scenario.
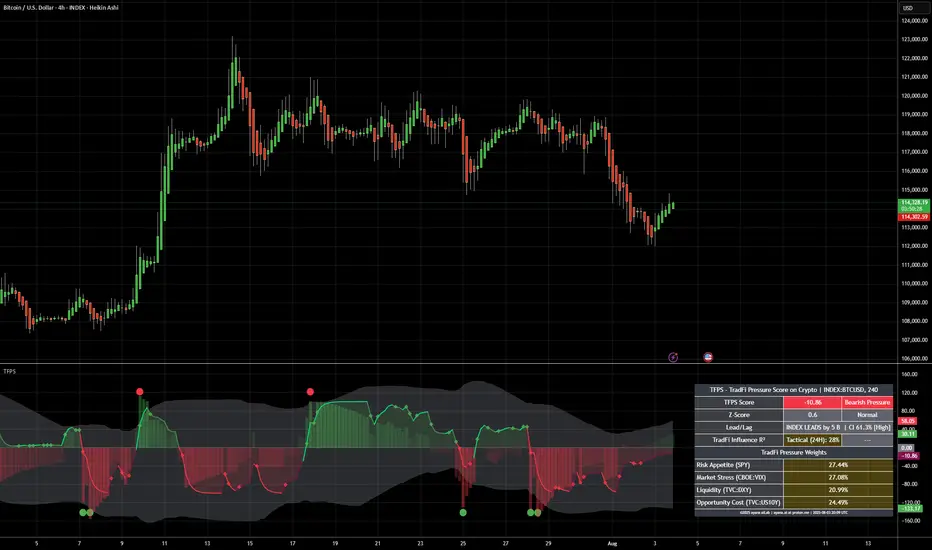
[ayana] Crypto Weather AI - 2nd test - do you like this?TFPS - TradFi Pressure Score on Crypto | INDEX:BTCUSD, 4H
Market Context Timestamp: 2025-08-03 21:50:47 UTC
TradFi Market Status: Closed
Reason (if closed): Weekend
Additional Notes: US futures are also closed. The dashboard reflects market sentiment from Friday's close.
TFPS Analysis: 2025-08-03
CORE RECOMMENDATION & NARRATIVE
The current market narrative is characterized by a shift in leadership: while TradFi markets exert slight bearish pressure, the movement is driven by internal crypto factors. The weak R² signal and the Lead/Lag indicator, which suggests the crypto asset is leading TradFi markets, point to a phase of internal crypto dynamics.
The Story: The TradFi environment shows a balanced bearish bias, with no single component dominating. However, the index (BTCUSD) is leading TradFi markets by 2 bars on the 4H chart. The TradFi correlation to price (R²) is weak at 20%, indicating that internal crypto catalysts are driving the price movement.
The Implication: This is a 'crypto-first' environment. The focus should shift from TradFi macro indicators to on-chain data and crypto-specific news. The TFPS is currently serving as a lagging indicator, confirming crypto action retroactively.
Primary Observation Signal: INDEX LEADS. The leadership of the crypto asset is the key signal. The strength and direction of the next crypto move are not predicted by TradFi but must be derived from internal crypto data.
### DATA SNAPSHOT & DECODING
| Metric | Dashboard Value | Interpretation (Based on TFPS v63 Logic) |
| :--- | :--- | :--- |
| TFPS Score | -12.66 | Bearish pressure originating from TradFi markets. |
| Z-Score | 0.53 | Normal. The current score is not statistically extreme ($$\lvert z \rvert < 2.0$$). An immediate mean reversion is not expected. |
| Lead/Lag | INDEX LEADS by 2 B CI 60.65% | The BTCUSD index is leading TradFi markets by 2 bars on the 4H chart. The high correlation confidence (> 0.50) makes this a very reliable signal. |
| TradFi Influence R² | Tactical (24H): 20% | Weak correlation. Only 20% of the price movement can be tactically explained by the TFPS. The market is currently driven mainly by internal crypto factors. |
| Top Weight: SPY | 27.98% | Non-dominant, but largest weighting factor. Represents market risk appetite. |
| Second Weight: VIX | 27.59% | Non-dominant, but second largest weighting factor. Represents market stress and fear. |
ACTIONABLE STEPS (LOW-EFFORT / HIGH-IMPACT)
🚀 MONITOR THIS FIRST: Focus on the price action of the BTCUSD chart itself. Since the INDEX LEADS signal is active, traditional TradFi charts (SPY, DXY, VIX) are currently lagging indicators. Look for chart formations, volume anomalies, or key support/resistance levels in the crypto market.
⏱️ ANTICIPATE MOVES: The INDEX LEADS indicator gives you a potential window of up to 8 hours (2 bars on the 4H chart) to observe TradFi markets after the Monday open. If the BTCUSD price rises or falls significantly before the US markets open, there is a high probability that the TradFi indices will follow.
🔍 VALIDATE THE THESIS: The weak tactical R² value of 20% confirms that TradFi correlation is low at the moment. Therefore, your trading decisions at this time should be based on approximately 80% crypto-internal data (on-chain, liquidity, news) and only 20% on macro data. If the R² value rises above 40% again, shift your focus back to TradFi.
#Bitcoin #BTC #CryptoTrading #TechnicalAnalysis #MarketAnalysis #TradFi #AITrading #TFPS #MarketNarrative
BTC Hits Premium Zone – Bearish Reversal Loading? BTC Hits Premium Zone – Bearish Reversal Loading?
🧠 Technical Breakdown:
🔹 1. Previous Market Structure & CHoCH
The chart shows a clear shift in structure (CHoCH) on the left, which marked the start of the bearish leg.
Break of Structure (BOS) confirms continuation of lower highs and lower lows until recent liquidity grab near the $112,551 zone.
Equal highs and liquidity above were taken out, making the move into the Premium Order Block zone highly significant.
🔹 2. Liquidity and Fair Value Gap (FVG) Zones
A major Liquidity + FVG zone was left unmitigated between $113,000–$112,000, and price is likely to revisit it.
This aligns with the target zone at $112,890, which is highlighted as a magnet for price to rebalance the inefficiency.
🔹 3. Order Block & Premium Supply Zone
A well-defined Order Block is marked just below the resistance zone near $115,166–$116,021.
Price is currently retracing into this zone, suggesting a potential reaction point for smart money to re-enter shorts.
Volume is expected to pick up here, and a reversal could initiate if price fails to break above this supply.
🔹 4. Volume Profile and Market Imbalance
Volume clusters are heaviest near the $114,000–$114,300 range, indicating high activity and previous accumulation/distribution.
Thin volume near the $112,551 zone further confirms price may drop quickly if rejection happens.
🔹 5. Support & Liquidity Sweep
Support zone around $112,551 is a previous liquidity pool and weak low that has not been fully cleared.
Price is likely to revisit this zone in the short term to clear liquidity and complete market rebalancing.
🔐 Institutional Narrative:
Smart money engineered a liquidity sweep to the downside, then caused a retracement into premium.
Now, BTC/USD is positioned in a high-risk zone where sell-side institutions may enter to push price lower.
If this order block holds, expect a rejection toward $112,890, followed by possible deeper continuation into the liquidity void below.
📌 Key Levels:
Level Price (USD)
Strong Resistance Zone 115,166 – 116,021
Order Block (Sell Area) 114,800 – 116,000 (approx.)
Immediate Support 113,000 – 112,551
Target (Liquidity Zone) 112,890
Weak Low (Final Sweep) 112,000
📉 Trade Outlook & Strategy:
🔺 If price reacts bearishly at Order Block:
Look for lower timeframe BOS/CHoCH confirmation.
Entry: Short on rejection at or near $115,000–$115,500
Target 1: $112,890
Target 2: $112,000 (extended liquidity sweep)
Stop-loss: Above $116,200 (invalidates bearish OB)
🔻 If price breaks and closes above $116,021 with momentum:
Structure flips bullish, and the OB is invalidated.
Look for long setups on retracement to $114,000 zone.
🧭 Conclusion:
BTC/USD is currently trading within a Premium Zone, testing a strong Order Block below key resistance. Price may face a bearish reaction, targeting the liquidity zone at $112,890. Smart money footprints suggest a potential trap for breakout buyers, and if momentum fades, we can expect a downside reversal to sweep remaining liquidity.

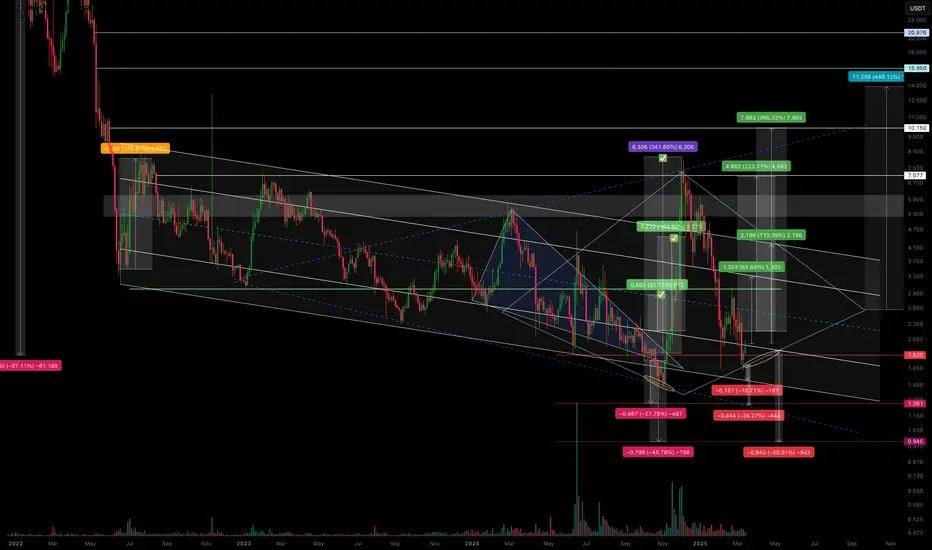
CVX/USDT – Is the scenario repeating? Continuing to work.The previous trading idea has played out with 3 out of 4 marked zones reached.
We saw a false breakout from the descending channel, followed by a pullback in line with the overall market—returning to the channel’s support zone.
I’ve noticed a potential formation of either a diamond pattern or an expanding triangle, but we’ll see how it plays out further.
Regarding declines and support zones:
-10.71% drop to the support of the descending channel.
-26.27% drop to the anticipated support of the expanding triangle.
-50% drop, likely as a squeeze under extremely negative news.
Regarding growth and resistance zones:
+65% rise to the resistance of the internal channel.
+110% rise to the resistance of the external channel (and if a diamond pattern forms, then its boundary).
+246% rise as a second attempt to break out of the descending channel.
+440% rise as a potential realization of diamond pattern pricing (if it forms).
All of this should be factored into your trading strategy, even the less likely scenarios.
I'll share the execution of the previous trading idea in my TG. I've also marked it on the chart.
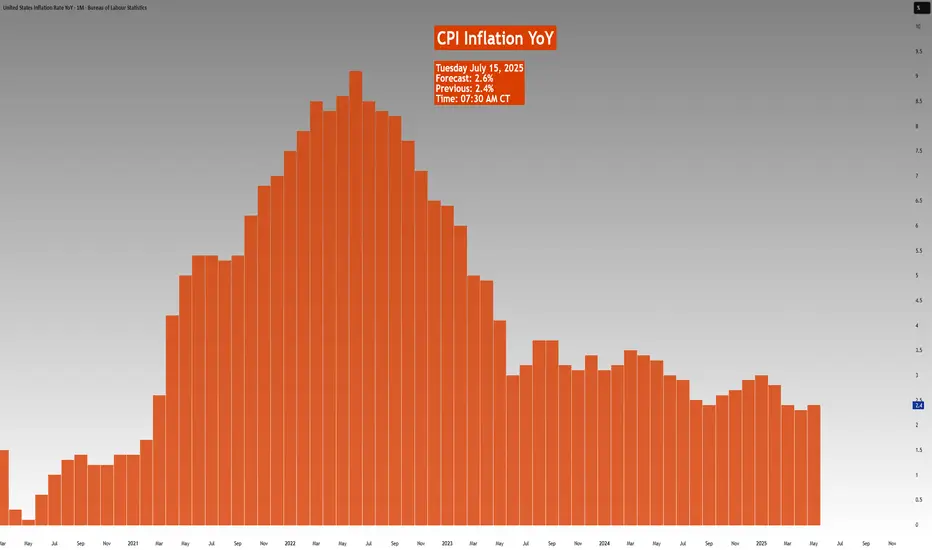
Weekly Macro Brief: Chinese Economic Data, US Inflation, Tariff CME_MINI:ES1! CME_MINI:NQ1! COMEX:GC1! CME:BTC1! CME_MINI:RTY1! COMEX:SI1! CME_MINI:MNQ1! NYMEX:CL1! CME_MINI:M6E1! CBOT:ZN1! CME_MINI:MES1!
Highlights this week include Chinese economic data points, UK CPI, US CPI, PPI, and Retail Sales. Inflation data is key, as it comes ahead of the Fed's meeting on July 30th, 2025.
Market participants, including institutional investors and futures brokers like EdgeClear, will be scrutinizing these data points closely to monitor global growth and underlying inflation pressures.
Fed speakers are scheduled throughout the week. With increasing calls for Fed Chair Powell voluntary resignation and impeachment, the US administration desiring lower rates, the Fed’s independence and credibility to carry out its dual mandate is at risk. It will be interesting to monitor who folds first. Last week’s FOMC minutes revealed a divided Fed on the interest rate outlook, affirming its June dot plot.
On the fiscal policy front, we are already witnessing a shift in global trade policies, with many nations making concessions to negotiate trade deals with the world’s largest economy. In our analysis, the inflation impact of tariffs may not show up until Q4 2025 or early 2026, as tariff threats are mostly used as a lever to negotiate deals. While effective tariff rates have increased, as Trump reshapes how tariffs are viewed, cost pass-through to consumers will be limited in Q3 2025, as companies’ front-loaded inventory helps mitigate the risks of increased tariff exposure.
So, what we have is an interesting development shaping up where, while inflation may rise and remain sticky, it is yet to be seen whether slowing consumer spending will weaken enough to the point where companies have to start offering discounts, which would nullify the tariff risk to the end consumer and result in companies absorbing all tariffs. This scenario will see reduced earnings margins leading into the last quarter and early 2026. However, it will materially reduce risks of higher inflation.
In summary, the complex interplay between tariffs, inflation, and consumer behavior presents critical considerations for traders. EdgeClear, as a dedicated futures broker, remains focused on equipping clients with the insights needed to help navigate this evolving macroeconomic environment.
Overnight Data Recap:
• Chinese Trade Balance (CNY)(Jun) 826.0B (Prev. 743.6B)
• Chinese Trade Balance USD* (Jun) 114.77B vs. Exp. 109.0B (Prev. 103.22B)
• Chinese Imports YY* (Jun) 1.1% vs. Exp. 1.3% (Prev. -3.4%)
• Chinese Exports YY* (Jun) 5.8% vs. Exp. 5.0% (Prev. 4.8%)
Key Economic Releases:
• MON: EU 90-Day Retaliatory Pause Ends
• TUE: OPEC MOMR, Chinese House Prices (Jun), Retail Sales (Jun), GDP (Q2), EZ Industrial Production (May), German ZEW (Jun), US CPI (Jun), NY Fed Manufacturing (Jul), Canadian CPI (Jun)
• WED: UK CPI (Jun), EZ Trade (May), US PPI (Jun), Industrial Production (Jun)
• THU: Japanese Trade Balance (Jun), EZ Final HICP (Jun), US Export/Import Prices (Jun), Weekly Claims, Philadelphia Fed (Jul), Retail Sales (Jun)
• FRI: Japanese CPI (Jun), German Producer Prices (Jun), US Building Permits/Housing Starts (Jun), Uni. of Michigan Prelim. (Jul)
China GDP / Retail Sales/ Housing (TUE):
• Q2 GDP is expected to slow to 5.1% Y/Y (vs 5.4% in Q1) and 0.9% Q/Q.
• Retail sales have been resilient, but industrial production and investment show signs of weakness; deflation and labor market concerns persist.
• Property prices continue to decline, fueling stimulus speculation; policymakers remain cautious, with only modest easing expected (LPR and RRR cuts in Q4).
US CPI (TUE)
• June CPI expected at +0.3% M/M headline and core, suggesting a modest rebound from May’s subdued figures.
• Inflation impact from tariffs seen as temporary; Fed officials maintain a cautious stance with possible rate cuts only if price pressures stay benign.
• Markets are pricing near-zero odds for a July rate cut, but still expect two 25bps cuts by year-end in line with Fed guidance.
US Retail Sales (THU):
• Headline June retail sales expected flat M/M; ex-autos expected to rise +0.3%, showing signs of consumer stabilization.
• BofA data shows mild spending rebound, though discretionary service spending continues to weaken, especially among lower-income households.
• Spending strength remains concentrated in higher-income cohorts; weakness in wage growth limits broader consumption momentum.
US Trade Tensions – Tariffs & Negotiations:
• Trump announced 30% tariffs on EU and Mexican goods effective August 1st, separate from sector-specific tariffs.
• Trump stated the EU is engaging in talks and South Korea is also pursuing a trade deal.
Mexico Response:
• President Sheinbaum expects a deal before August 1st but reaffirmed Mexican sovereignty is non-negotiable.
• Mexico’s Economy Ministry is negotiating to protect domestic firms and workers, aiming for an alternative resolution.
EU Response:
• European Commission President von der Leyen warned that 30% tariffs would disrupt key transatlantic supply chains.
• The EU will extend suspension of countermeasures until early August but is prepared to respond proportionally if needed.
• The EU prefers a negotiated solution and dropped plans for a digital tax, seen as a concession to US tech interests.
• Separately, the EU is drafting a broad corporate tax on firms with turnover above EUR 50 million to support its budget.
EURJPY ANALYSIS After seeing the previous weekly candle close bullish and the past few weeks pushing to the upside we could expect the momentum to continue into weekly highs of 175.000

Range Bound consolidation going on in the market. Range bound consolidation is going on in the market. As you can see in the chart there is consolidation going on before a substantial up or down move happens. Mostly it looks like Tariff negation deadline will be extended or India might end up getting the tariff deal sealed. all eyes on Trump and TCS results tomorrow. TCS has been reeling close to an year now after making a high of 4592 everything depends on the result tomorrow. The result can give direction to the market as TCS has good weightage (Around 6.09% in Nifty and 7.43% in BSE Sensex). TCS has 21.93% Weightage in Nifty IT index so the result tomorrow is a must watch. It can give direction to the It index as well.
Supports for Nifty remain at 25413 and 25243. If by chance this level is broken Nifty can fall further towards Mother line which is at 24862 or in worst case scenario towards Father line of daily chart at 24030.
Resistances for Nifty remain at: 25531 and 25710 Closing above which Nifty becomes very strong. After we get a closing above 25710 Nifty can swiftly move towards 25888 or even 26K+ levels.
Disclaimer: The above information is provided for educational purpose, analysis and paper trading only. Please don't treat this as a buy or sell recommendation for the stock or index. The Techno-Funda analysis is based on data that is more than 3 months old. Supports and Resistances are determined by historic past peaks and Valley in the chart. Many other indicators and patterns like EMA, RSI, MACD, Volumes, Fibonacci, parallel channel etc. use historic data which is 3 months or older cyclical points. There is no guarantee they will work in future as markets are highly volatile and swings in prices are also due to macro and micro factors based on actions taken by the company as well as region and global events. Equity investment is subject to risks. I or my clients or family members might have positions in the stocks that we mention in our educational posts. We will not be responsible for any Profit or loss that may occur due to any financial decision taken based on any data provided in this message. Do consult your investment advisor before taking any financial decisions. Stop losses should be an important part of any investment in equity.

Gold To The Basement? Week Ahead with Bearish Bias by PhoenixFX🌟 Welcome to Phoenix FX’s Intraday Pulse! 🌟
Hello, Phoenix FX family! 👋 I’m thrilled you’ve joined us for today’s TradingView chart breakdown. Our focus? Intraday opportunities—spotting those high-probability setups you can enter, manage, and leave to run whilst you concentrate on the things you love doing.
Here’s what you’ll find in this analysis:
Key Levels & Zones: Support, resistance, and Fair Value Gaps that matter on the smaller timeframes.
Price-Action Clues: Exact candlestick patterns and momentum signals to watch for your next entry.
Trade Triggers & Targets: Clear criteria for when to get in, where to take profits, and how to manage your risk.
Whether you’re hunting quick scalps or tactical swing moves, our goal is simple: help you trade with confidence, clarity, and community support. Got a different view or a fresh idea? Drop it in the comments—after all, “each one, teach one.” 😉
Let’s dive into the charts and make today’s market moves count! 🚀📈
Donald Trump’s presidency continues to exert outsized influence on gold through three main channels: trade policy uncertainty, fiscal stimulus (and resulting deficits), and shifts in safe-haven demand. Here’s how each factor has played out—and what it could mean for gold going forward:
1. Trade-War Uncertainty
What’s Happening: The Trump administration’s aggressive use of tariffs—including recent 25% duties on goods from Japan and South Korea—has periodically roiled markets and driven investors into gold as a safe haven. On July 7, gold pared losses after tariff news, as traders sought refuge despite a firm dollar.
Looking Ahead: If further tariff escalations or retaliations emerge, expect renewed spikes in gold. Conversely, any de-escalation or trade-deal breakthroughs could sap that safe-haven bid.
2. Fiscal Stimulus & Deficits
What’s Happening: Senate Republicans recently passed a Trump-backed tax‐and‐spending package projected to add $3.3 trillion to the U.S. deficit. Larger deficits—especially when financed by the Fed—tend to stoke inflation expectations, which bolsters gold’s appeal as an inflation hedge.
Looking Ahead: Continued large-scale stimulus or fresh tax cuts without offsetting revenue measures could keep real yields low (or negative), a classic tailwind for gold.
3. Safe-Haven Flows & Investor Positioning
What’s Happening: Despite peaking at record highs earlier this year, gold remains up roughly 30% since November, driven largely by investor fears around Trump’s policy unpredictability and geopolitical tensions.
Looking Ahead: Should Trump-era uncertainty persist—whether around trade, foreign policy, or domestic turmoil—gold is likely to retain its status as a portfolio diversifier and crisis hedge. A sustained drop in U.S. real rates or fresh bouts of market volatility would reinforce that trend.
🎯 Outlook Summary
Bullish Drivers: Ongoing trade-war rhetoric, larger deficits, and any new geopolitical flashpoints.
Bearish Risks: Clear resolution of major trade disputes, a pivot by the Fed toward earlier rate cuts (reducing real‐rate support for gold), or diminished investor fear.
------------------------------------------------------------------------------------------
PhoenixFX price action analysis based on the Daily time frame
🔴 Primary Resistance (Daily)
Zone: $3,348 – $3,400
Why It Matters:
Multiple daily closes have stalled here, leaving a clear Fair-Value Gap (dashed purple). Sellers are likely to defend this range until we see a decisive daily close above $3,400.
📉 Bearish Bias – Short Setups
Short at Resistance
Entry: Bearish daily reversal candle (engulfing, pin-bar) in $3,348–$3,400
Targets:
TP1: $3,290 (50% of Primary Buy Zone)
TP2: $3,250 (Primary Buy Zone low)
TP3: $3,172 (Secondary Buy Zone high)
Stop-Loss: Above $3,420
Breakdown Short
Trigger: Daily close below $3,250 (Primary Buy Zone low)
Entry: On the open of the next daily candle after close below $3,250
Targets:
TP1: $3,172 (Secondary Buy Zone)
TP2: $3,026 (Final Buy Zone 50% level)
Stop-Loss: Above $3,290
🔵 Potential Long Opportunities
Defensive Long (Aggressive)
Entry: Bullish daily rejection candle in $3,250–$3,290
Targets:
TP1: $3,348 (short-term resistance)
TP2: $3,400 (key resistance)
Stop-Loss: Below $3,230
Trend-Reversal Long (Ultra-Conservative)
Trigger: Daily close above $3,400
Entry: Open of the next daily candle after the close above $3,400
Targets:
TP1: $3,450
TP2: $3,500+
Stop-Loss: Below $3,360
📊 Week-Ahead Scenarios
Bearish Scenario (High Probability):
Price remains capped under $3,400.
Look for a bearish signal in $3,348–$3,400 to initiate shorts.
A break below $3,250 extends the move into deeper demand zones ($3,172 → $3,026).
Bullish Counter-Trend (Lower Probability):
Strong daily rejection candle in $3,250–$3,290 could spark a relief rally.
Short-term longs can target $3,348 and $3,400—ideal for quick swing trades.
Only a sustained daily close above $3,400 shifts the bias back to the upside.
Just a Heads-Up:
This is my take on the charts—not gospel, not financial advice, and definitely not a crystal ball 🔮.
Trading is part skill, part patience, and part “what just happened?” 😅
We all see things a little differently, and that’s the beauty of it. So if you’ve got a hot take, wild theory, or just want to drop some chart wisdom—hit the comments!
Let’s grow, learn, and laugh through the madness together. 🚀📈
Each one, teach one.
— Phoenix FX Team 🔥🦅

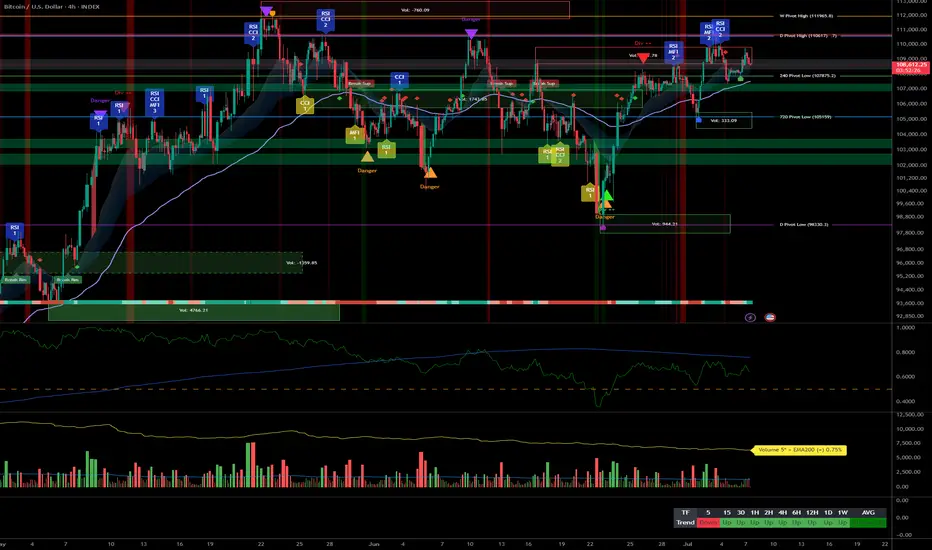
Bitccoin bullish momentum under resistance, key zone at $110k__________________________________________________________________________________
Technical Overview – Summary Points
➤ Momentum: Predominantly bullish on all higher timeframes, momentum slowdown observed on short-term (15min).
➤ Supports/Resistances:
Major resistance: 110,630 – 111,949 (repeated tests on Weekly/Daily pivot high)
Key supports: 107,761 – 106,000 (H4/H12 pivot), weaker pivot zones below 105,054 and 98,133
➤ Volume: Within normal ranges on daily/12H/6H, elevated but not extreme on 15min – potential short-term distribution signal.
➤ Behavioral: No buy/sell climax (ISPD DIV neutral), no panic, Risk On / Risk Off Indicator with strong buy signal up to 1H.
__________________________________________________________________________________
Strategic Summary
➤ Global bias: Mature bullish. Confirmed momentum across timeframes, but caution with short-term timing (frequent traps under resistance).
➤ Opportunities:
Tactical buying on pullback into 107,761–106,000 support zone with confirmed reversal signals (wicks, absorption, incoming volume)
Momentum buying on confirmed break above 110.6–112k, with active stop management below latest pivot
➤ Risk zones:
Invalidation below 105,054, then strong reversal under 98,133
Avoid trading low timeframes if abnormal volume ("liquidity grabs")
➤ Macro catalyst: Few high-impact events expected before FOMC end of July; overall global environment is risk-off but no immediate escalation.
➤ Action plan: “Trend Following” until invalidation, active stop management below key pivots, entries on pullback or clear breakout, flexibility for upside/faulty support.
__________________________________________________________________________________
Multi-Timeframe Analysis
: Strong bullish alignment (“Strong Up”/“Up”), technical support on major pivots 107,761–106,000.
30min : Micro-range compression, recent volume up but no excess – weak immediate opportunity (await breakout or retest of support/pivot zone).
15min : Very high volumes on micro-range, increasing micro-volatility – likely distribution/trap, observation only, no action unless 107.7k support breaks hard.
Risk On / Risk Off Indicator : Strong buy signal daily–1H, neutral on 15min; institutional confidence preserved as long as major range remains intact.
Synthetic summary : BTC market structurally healthy, tactical upside still valid – increased monitoring required for short-term volume flush or first distribution move on key support break.
__________________________________________________________________________________
Strategic bias summary
Mature bullish, low euphoria, institution-driven environment
Prioritize entries on validated support zones, or breakout with agile stop management
Short-term volatility to be handled with care (frequent traps on 5–15min)
__________________________________________________________________________________
Brent Crude Oil Long Swing Setup – Support Break at Key LevelBrent Crude Oil OANDA:BCOUSD has broken to the next key support level after a cease-fire announcement in the Middle East. A long position is considered only if support holds at $69.00.
📌 Trade Setup:
• Entry Zone: $69.00
• Take Profit Targets:
🥇 $73.50 – $76.00
🥈 $79.00 – $83.00
• Stop Loss: Daily close below $67.00
#BrentCrude #OilTrading #ForexTrading #LongPosition #SupportLevel #TradeSetup #CrudeOil #MarketAnalysis #TradingOpportunities #Commodities #OilMarket #Investing #PriceAction #OilPrices #TradingStrategy #ForexCommunity #InvestmentOpportunities #MarketUpdate

AERO Long Swing Setup – Strong Pullback into Fibonacci SupportAERO has shown notable strength in recent months and is now retracing into a key support zone, aligning with the 38.2% Fibonacci level. The $0.75–$0.80 area offers a solid long swing opportunity.
📌 Trade Setup:
• Entry Zone: $0.75 – $0.80
• Take Profit Targets:
o 🥇 $1.04 – $1.32
o 🥈 $1.60 – $2.05
• Stop Loss: Daily close below $0.70

XAUUSD MARKET LAYOUTGold has shown to be bearish following the lower liquidity sweep trend channel just as shown in the analysis.
This trend channel shows a path down to the 3270's and 3260's.
Further updates would be given as the market gains momentum.

GBPUSD Price Action Analysis | Sell Setup Below 1.36106In this GBPUSD market overview, we break down recent price action following yesterday’s strong bullish rally from the momentum low. The session was highly emotional across major forex pairs, which is typical when a major wave structure reaches its end. This often results from incomplete auctions on one side of the market, causing order flow imbalances that drive sharp price movements.
The key price level we're watching on GBPUSD is 1.36326. Price approached this zone with momentum, and the rejection at 1.36267 triggered a classic TCP (Trend Changing Pattern), followed by a single upside break, confirming exhaustion at the highs.
📉 Sell Setup:
According to the Waves of Success execution model, the best short entry is below 1.36106, in alignment with the prevailing bearish structure.
⚠️ Alternative Scenario:
We are not looking for long setups on GBPUSD at this time — our bias remains bearish unless significant structure changes occur.
This analysis combines wave structure, trend confirmation patterns, and institutional price levels for a professional, risk-managed approach.
🔑 Key Levels:
Resistance: 1.36326
Rejection High: 1.36267
Sell Trigger: 1.36106
