Eur/NZd Buy Setup!!Self explanatory . we have a minor structure on h1 being broken so we could see price first grab liquidity on the supply level, break the support for short opportunity
we shall be looking for long setup if price support the liquidity level of the daily support zone at 1.7100
Follow me for more setup!!!
Market Geometry

EURJPY 200 (more) PIPS 🇪🇺🇯🇵After banking a TAKE PROFIT of 150 PIPS, we are going for a LONG position once again.🥳🎉
If you check related ideas ( last time I used geometry on charts ), we banked 185 PIPS. 🤯
So, I basically used the same strategy, but in a different way. 🔥
We've banked over 400 pips so far THIS WEEK, and we will keep the streak. 💥💥
Dont forget to show us some love by following us, If you found our ideas useful.🙏🏾💚

Mega Macro Looking Strong..I haven't done an analysis recently, perhaps time I get back into it.
Here's a "Geometric" technique I like to use. This chart features Weekly Bars. The Bars are colored 1 of 4 ways.
Green = Bullish (HH and HL)
Yellow = Inside (LH and HL)
Blue = Engulfing (HH and LL)
Red = Bearish (LH and LL).
The paler red lines are Quarterly lines. The deeper red lines are Yearly lines. Dotted lines indicate a projection based off of 2 closed timeframes. Dashed lines use the most recently closed timeframe, as well as the currently building timeframe, to make their projection (so they're ... incomplete, not locked in etc).
After our MEGA BULL YEAR in 2017, we've put in two consecutive Inside Years. So consolidation. We've now broken out of the 2018-2019 Projected Resistance, to a significant degree.
Pullback are to be expected, but they're for buying until proven otherwise.
This is a MEGA Macro chart, I will post some other stuff shortly, with more relevant, real-time data.
As always, good luck, have fun, and practice solid risk management.


UNIUSD | EnchanterExperimental pattern derived from chart squared via Thales, drawn from the equilateral formed by unit circles. Hid the "work" layer since this chart will already be too much for most. Watching price action traverse this grid. Note the touch on opening price when back-testing pattern repeat.
Not trading advice.


EURNZDPrice has been dropping for a while. Now, it is still about 90 pips from weekly trend line and 140 pips from strong support level - where we may expect and look for new trade opportunities.


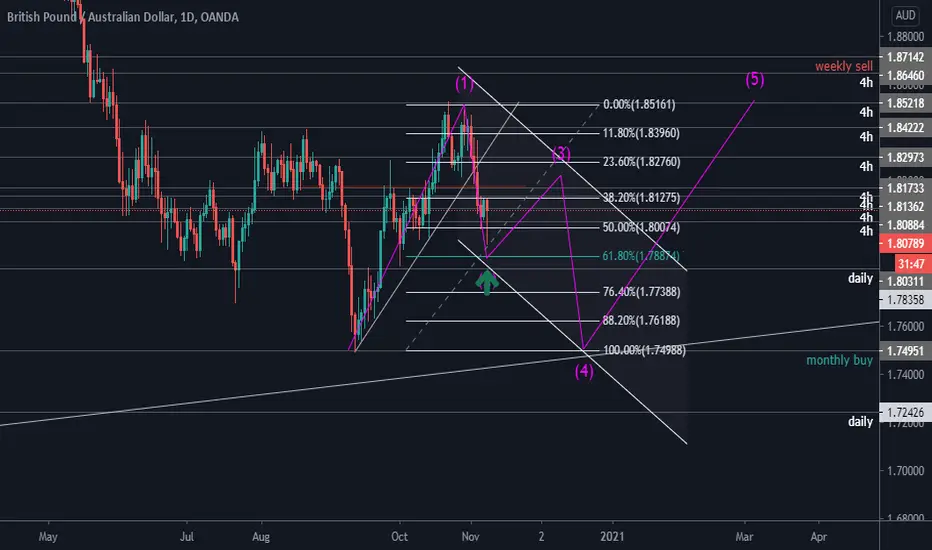
EURAUDUPDATE:
After my previous trade idea, price has broken the zone immediately and it is about 100 pips from daily important zone.


Bitcoin BTC UPDATEAs you can see, compared to initial projections and updates (previous publications), we are right on track. This is a bigger picture look from the original. Looks like $32 - $34K by November 2021. However, a buying frenzy may ensue north of $20K which would allow for reaching target sooner.

UNIUSD | PerspectivesChart squared via Thales to last major LHL swing (left most teal triangle). Right triangle was then replicated and placed at first major dip after the local high, which highlighted the angular trend through October 14. Using Fib Channels you can construct a perspective Gannbox (right most grid formation). Backtested idea by then duplicating and offsetting a second Gannbox (left). Watching how price action reacts to this geometry. Not Trading Advice.


XAUUSDRetested support, trend line and finished move at 76,4% of fib retracement. First target is at 1914.


GBPUSDPrice is approaching support and trend line below. Same as DXY is approaching trend line - depends on the price action. In case of rejection there may be long trade opportunities at GBPUSD.


USDZAR2 option as always - price will break support level and close underneath for future drop or price will rejected to the long side.

EURJPYTriangle and lower and highr time frame. Break of the structure is needed in order to see where price want to go.

SPX500Bullish flag, the last data point has been reached. Here is still option that price will continue dropping until US election is over - 3344 level is important zone of SR. Always have your SL and proper risk and money management.
