Unlocking Potential: Power Finance Corporation Analysis! 💼📈Traders, let's delve into Power Finance Corporation today ! 🌟 In the daily timeframe, we're witnessing a range-bound movement, with the price testing previous swing highs. 🔄 Anticipate a breakout above this level(red box), potentially targeting Rs. 450 and beyond. But before that it may come around at Rs.400 to go up further. PFC appears poised for bullish action! 🚀 Options traders, explore 400 CE or below 400 CE options with ample liquidity. Let's capitalize on this opportunity! 💼📊
Thank you. See you again in the next post!
Best regards,
Alpha Trading Station
Marketinsights

Market Insights with Gary Thomson: 24 - 28 NovemberMarket Insights with Gary Thomson: US Inflation Surprises, Too Dovish RBNZ, and Struggling Canada
In this video, we’ll explore the key economic events and market trends, shaping the financial landscape. Get ready for insights into financial markets to help you navigate the week ahead. Let’s dive in!
In this episode of Market Insights, Gary Thomson unpacks the strategic implications of the week’s most critical events driving global markets.
👉 Key topics covered in this episode:
— US Producer Price Index
— RBNZ Interest Rate Decision
— Canada GDP Growth Rate
— US PCE Price Index
Gain insights to strengthen your trading knowledge.
Disclaimer: This video represents the opinion of the Companies operating under the FXOpen brand only. It is not to be construed as an offer, solicitation, or recommendation with respect to products and services provided by the Companies operating under the FXOpen brand, nor is it to be considered financial advice.

Market Insights with Gary Thomson: 17 - 21 NovemberMarket Insights with Gary Thomson: Fed Rate Cut Chances, UK Markets, NVIDIA Earnings
In this video, we’ll explore the key economic events and market trends, shaping the financial landscape. Get ready for insights into financial markets to help you navigate the week ahead. Let’s dive in!
In this episode of Market Insights, Gary Thomson unpacks the strategic implications of the week’s most critical events driving global markets.
👉 Key topics covered in this episode:
— FOMC Meeting Minutes
— UK Inflation Rate
— UK Retail Sales
— Corporate Earnings Reports
Gain insights to strengthen your trading knowledge.
Disclaimer: This video represents the opinion of the Companies operating under the FXOpen brand only. It is not to be construed as an offer, solicitation, or recommendation with respect to products and services provided by the Companies operating under the FXOpen brand, nor is it to be considered financial advice.

Market Insights with Gary Thomson: 3 - 7 NovemberMarket Insights with Gary Thomson: BoE Interest Rate Decision, Canada Jobs Data & Earnings Reports
In this video, we’ll explore the key economic events and market trends, shaping the financial landscape. Get ready for insights into financial markets to help you navigate the week ahead. Let’s dive in!
In this episode of Market Insights, Gary Thomson unpacks the strategic implications of the week’s most critical events driving global markets.
👉 Key topics covered in this episode:
— BoE Interest Rate Decision
— Canada’s Unemployment Rate
— Corporate Earnings Reports
Gain insights to strengthen your trading knowledge.
This video represents the opinion of the Companies operating under the FXOpen brand only. It is not to be construed as an offer, solicitation, or recommendation with respect to products and services provided by the Companies operating under the FXOpen brand, nor is it to be considered financial advice.

Market Insights with Gary Thomson: 27 - 31 OctoberMarket Insights with Gary Thomson: US and Canada Rate Decisions, Earnings Reports & Trade Tensions
In this video, we’ll explore the key economic events and market trends, shaping the financial landscape. Get ready for insights into financial markets to help you navigate the week ahead. Let’s dive in!
In this episode of Market Insights, Gary Thomson unpacks the strategic implications of the week’s most critical events driving global markets.
👉 Key topics covered in this episode:
— US Interest Rate Decision
— Canada Interest Rate Decision
— Corporate Earnings Reports
— Trade Tensions
Gain insights to strengthen your trading knowledge.
This video represents the opinion of the Companies operating under the FXOpen brand only. It is not to be construed as an offer, solicitation, or recommendation with respect to products and services provided by the Companies operating under the FXOpen brand, nor is it to be considered financial advice.

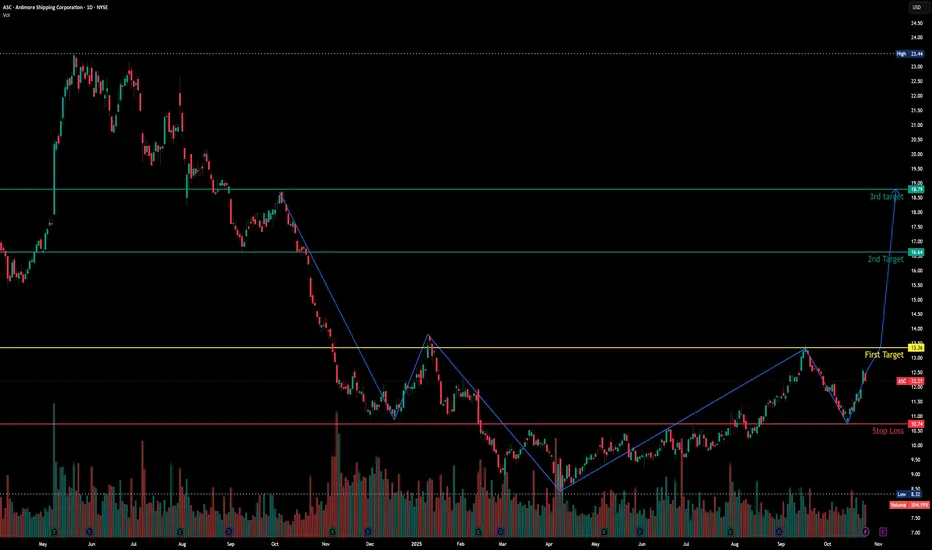
Ardmore Shipping Corp - Exciting Chart Pattern Disclaimer: This post is purely based on technical chart analysis and is not a recommendation to buy or sell. Please do your own research and consult with a financial advisor before making any investment decisions.
Last Year in May 2024, stock price was at nearly $23. from that level it fall to $8.5.
During this fall and rise, stock has made an inverted Head and Shoulder Chart Pattern.
According to my analysis , i have marked some of levels on the chart for reference.
Please share your thoughts.
Best wishes.
Market Insights with Gary Thomson: 20 - 24 OctoberMarket Insights with Gary Thomson: Canada, UK & US Inflation, UK Retail Sales, Earnings Reports
In this video, we’ll explore the key economic events and market trends, shaping the financial landscape. Get ready for expert insights into financial markets to help you navigate the week ahead. Let’s dive in!
In this episode of Market Insights, Gary Thomson unpacks the strategic implications of the week’s most critical events driving global markets.
👉 Key topics covered in this episode:
— Canada’s Inflation Rate
— UK Inflation Rate
— UK Retail Sales
— US Inflation Rate
— Corporate Earnings Reports
Gain insights to strengthen your trading knowledge.
This video represents the opinion of the Companies operating under the FXOpen brand only. It is not to be construed as an offer, solicitation, or recommendation with respect to products and services provided by the Companies operating under the FXOpen brand, nor is it to be considered financial advice.

Market Insights with Gary Thomson: 6 - 10 OctoberMarket Insights with Gary Thomson: FOMC Minutes & Powell’s Speech, Canada Jobs, RBNZ Rate Decision
In this video, we’ll explore the key economic events and market trends, shaping the financial landscape. Get ready for expert insights into financial markets to help you navigate the week ahead. Let’s dive in!
In this episode of Market Insights, Gary Thomson unpacks the strategic implications of the week’s most critical events driving global markets.
👉 Key topics covered in this episode:
— FOMC Minutes and Fed Powell’s Comments
— Canada’s Unemployment Rate
— RBNZ Interest Rate Decision
Gain insights to strengthen your trading knowledge.
This video represents the opinion of the Companies operating under the FXOpen brand only. It is not to be construed as an offer, solicitation, or recommendation with respect to products and services provided by the Companies operating under the FXOpen brand, nor is it to be considered financial advice.

$F: Ford Motor Company – Driving Profits or Stalling Out?(1/9)
Good afternoon, everyone! ☀️ NYSE:F : Ford Motor Company – Driving Profits or Stalling Out?
With F at $10.18, is this auto giant revving up with EVs or sputtering in the market? Let’s shift gears and find out! 🔍
(2/9) – PRICE PERFORMANCE 📊
• Current Price: $ 10.18 as of Mar 18, 2025 💰
• Recent Move: Slight uptick in March, per data 📏
• Sector Trend: Auto sector mixed, EV demand growing 🌟
It’s a road with twists—let’s see where it leads! ⚙️
(3/9) – MARKET POSITION 📈
• Market Cap: Approx $45B (4.4B shares) 🏆
• Operations: Global auto manufacturer, focusing on EVs ⏰
• Trend: EV push with F-150 Lightning, per data 🎯
Firm in its lane, with electric acceleration! 🚗
(4/9) – KEY DEVELOPMENTS 🔑
• Q1 2025 Earnings: Expected soon, EV sales in focus 🌍
• EV Sales: F-150 Lightning gaining traction, per data 📋
• Market Reaction: Stock reflects cautious optimism 💡
Shifting to electric, eyes on the horizon! ⚡
(5/9) – RISKS IN FOCUS ⚡
• Economic Slowdown: Impact on auto sales 📉
• Competition: Tesla, GM, VW in EV race ❄️
• Supply Chain: Geopolitical tensions affecting parts 🛑
It’s a competitive race—buckle up! 🚦
(6/9) – SWOT: STRENGTHS 💪
• Brand Power: Iconic auto brand 🥇
• EV Strategy: F-150 Lightning leading the charge 📊
• Undervalued: Low P/E ratio, strong cash flow 🔧
Got the engine to roar! 🏁
(7/9) – SWOT: WEAKNESSES & OPPORTUNITIES ⚖️
• Weaknesses: Traditional auto sales vulnerable to economic shifts 📉
• Opportunities: Growing EV market, new models 📈
Can it charge ahead or run out of juice? 🤔
(8/9) – POLL TIME! 📢
F at $10.18—your take? 🗳️
• Bullish: $12+ soon, EV boom drives growth 🐂
• Neutral: Steady, risks balance out ⚖️
• Bearish: $9 looms, market stalls 🐻
Chime in below! 👇
(9/9) – FINAL TAKEAWAY 🎯
F’s $10.18 price tags potential value 📈, but volatility’s in the air 🌿. Dips are our DCA fuel 💰—buy low, ride high! Gem or bust?

Market Insights with Gary Thomson: 11 - 15 AugustMarket Insights with Gary Thomson: RBA Rate, US Inflation, UK Jobs & GDP, Earnings Reports
In this video, we’ll explore the key economic events, market trends, and corporate news shaping the financial landscape. Get ready for expert insights into forex, commodities, and stocks to help you navigate the week ahead. Let’s dive in!
In this episode of Market Insights, Gary Thomson unpacks the strategic implications of the week’s most critical events driving global markets.
👉 Key topics covered in this episode:
— RBA Interest Rate Decision
— US Inflation Rate
— UK Unemployment Rate
— UK GDP Growth Rate
— Trade Tensions
— Earnings Reports
Gain insights to strengthen your trading knowledge.
This video represents the opinion of the Companies operating under the FXOpen brand only. It is not to be construed as an offer, solicitation, or recommendation with respect to products and services provided by the Companies operating under the FXOpen brand, nor is it to be considered financial advice.

US10Y: 10-Year Treasury Yield – Safe Bet or Yield Trap?(1/9)
Good morning, everyone! ☀️ US10Y: 10-Year Treasury Yield – Safe Bet or Yield Trap?
With the 10-year yield at 4.358%, is it time to lock in safety or wait for better rates? Let’s break it down! 🔍
(2/9) – YIELD PERFORMANCE 📊
• Current Yield: 4.358% as of Mar 25, 2025 💰
• Historical Context: Above pandemic lows (~1-2%), below early 2000s (5-6%), per data 📏
• Sector Trend: Inverted yield curve signals caution, per economic reports 🌟
It’s a mixed bag—let’s see what’s cooking! ⚙️
(3/9) – MARKET POSITION 📈
• Safe Haven: U.S. Treasuries are risk-free ⏰
• Income Appeal: 4.358% yield draws income seekers 🎯
• Potential Upside: If rates fall, bond prices rise 🚀
Firm in safety, with growth potential! 🏦
(4/9) – KEY DEVELOPMENTS 🔑
• Inverted Yield Curve: 2-year yield higher, hinting at slowdown, per data 🌍
• Fed Outlook: Expected rate cuts later in 2025, per posts on X 📋
• Market Reaction: Investors balancing income with economic risks 💡
Navigating through uncertainty! 💪
(5/9) – RISKS IN FOCUS ⚡
• Interest Rate Risk: If rates rise, bond prices drop 🔍
• Inflation Risk: Erodes real returns if inflation outpaces yield 📉
• Opportunity Cost: Missing higher returns from stocks ❄️
It’s a trade-off—risks are real! 🛑
(6/9) – SWOT: STRENGTHS 💪
• Risk-Free: No default risk, backed by U.S. government 🥇
• Liquidity: Active market for trading, per data 📊
• Tax Benefits: Interest exempt from state, local taxes 🔧
Got solid foundations! 🏦
(7/9) – SWOT: WEAKNESSES & OPPORTUNITIES ⚖️
• Weaknesses: Interest rate and inflation risks, per economic reports 📉
• Opportunities: Capital gains from falling rates, diversification benefits 📈
Can it deliver both income and growth? 🤔
(8/9) – POLL TIME! 📢
US10Y at 4.358%—your take? 🗳️
• Bullish: Buy now, rates will fall soon 🐂
• Neutral: Hold, wait for more clarity ⚖️
• Bearish: Wait for higher yields or better opportunities 🐻
Chime in below! 👇
(9/9) – FINAL TAKEAWAY 🎯
US10Y offers a steady yield with safety, but with an inverted curve, caution is advised. Gem or bust?

$BAJAJAUTO: Bajaj Auto – Wheeling to Wealth or Spinning Out?(1/9)
Good afternoon, everyone! ☀️ $BAJAJAUTO: Bajaj Auto – Wheeling to Wealth or Spinning Out?
With BAJAJAUTO at ₹7,711.25 post-CEO nod and ₹1,500 crore boost, is this two-wheeler titan revving up or stalling? Let’s ride into it! 🔍
(2/9) – PRICE PERFORMANCE 📊
• Current Price: $ 7,711.25 as of Mar 19, 2025 💰
• Recent Move: Up 1.64% on news, below $12,774 high, per data 📏
• Sector Trend: Auto sector steady, with two-wheeler demand in focus 🌟
It’s a smooth ride—value might be in gear! ⚙️
(3/9) – MARKET POSITION 📈
• Market Cap: Approx ₹2.12 lakh crore (web ID: 6) 🏆
• Operations: Two-wheelers, financing via subsidiary ⏰
• Trend: Leadership stability, credit growth, per data 🎯
Firm in its lane, with expansion in sight! 🚴♂️
(4/9) – KEY DEVELOPMENTS 🔑
• CEO Re-appointment: Rajiv Bajaj for 5 yrs from Apr 1, per data 🌍
• Investment: ₹1,500 crore into Bajaj Auto Credit Ltd., per data 📋
• Market Reaction: Stock up, signaling confidence 💡
Revving up leadership and capital! 🛵
(5/9) – RISKS IN FOCUS ⚡
• Market Volatility: Trade tensions, economic shifts 🔍
• Competition: Hero MotoCorp, TVS pressure sales 📉
• Rates: Rising costs could hit demand ❄️
It’s a twisty road—watch the turns! 🛑
(6/9) – SWOT: STRENGTHS 💪
• Brand Power: Two-wheeler leader in India 🥇
• Subsidiary Growth: Credit arm expansion, per data 📊
• Dividend: Steady payouts attract income fans 🔧
Got horsepower to spare! 🏍️
(7/9) – SWOT: WEAKNESSES & OPPORTUNITIES ⚖️
• Weaknesses: Below peak, macro risks 📉
• Opportunities: Two-wheeler demand, financing growth 📈
Can it accelerate or hit a bump? 🤔
(8/9) – POLL TIME! 📢
BAJAJAUTO at ₹7,711.25—your take? 🗳️
• Bullish: ₹9,000+ soon, growth kicks in 🐂
• Neutral: Steady, risks balance out ⚖️
• Bearish: ₹7,000 looms, market stalls 🐻
Chime in below! 👇
(9/9) – FINAL TAKEAWAY 🎯
BAJAJAUTO’s ₹7,711.25 price reflects confidence 📈, but volatility’s in the air 🌿. Dips are our DCA fuel 💰—buy low, ride high! Gem or bust?

$TGT: Target Corporation – Retail Titan or Fading Star?(1/9)
Good evening, shoppers! 🌙 NYSE:TGT : Target Corporation – Retail Titan or Fading Star?
Target’s at $116 on March 4, 2025—is this a golden ticket or a clearance rack trap? Let’s unpack the cart and find out! 🔧
(2/9) – PRICE PERFORMANCE 📊
• Current Price: $ 116 as of Mar 4, 2025 🤑
• Past Peek: Down 20% from $145.65 earlier this month 📉
• Sector Vibe: Retail’s feeling the squeeze, folks 🎮
It’s a bumpy ride, but deals might be hiding! 🛠️
(3/9) – MARKET POSITION 📈
• Market Cap: Roughly $53.15B (458.21M shares) 🏬
• Footprint: Around 1,950 stores, online sales popping 📡
• Trend: Brand loyalty high, but rivals are circling 🛡️
Still a heavyweight in the retail ring! 🏋️♀️
(4/9) – KEY DEVELOPMENTS 🔑
• Retail Scene: Spending’s tight, consumers picky 📅
• Digital Gains: E-commerce up, per past trends 🖥️
• Market Buzz: $116 hints at cautious buyers 🎤
Pivoting fast, but aisles are jammed! 🧭
(5/9) – RISKS IN FOCUS ⚠️
• Rivals: Walmart, Amazon playing hardball 🚨
• Economy: Inflation biting, tariffs looming 💸
• Swings: Retail stocks dance to a wild beat 🎶
Rough waters, but storms pass! 🌪️
(6/9) – SWOT: STRENGTHS 💥
• Name Value: Trendy goods, solid rep 💎
• Reach: 1,950+ stores, wide net 🗺️
• Online Edge: Digital sales climbing 📱
Loaded with ammo for the retail fight! 🔥
(7/9) – SWOT: WEAKNESSES & OPPORTUNITIES 🧐
• Weaknesses: $116 shows hesitation, margins tight 📋
• Opportunities: Push Target Circle, grow e-sales 🚀
Can it snag the prize or just scrape by? 🤷♂️
(8/9) – 📢Target’s $116, retail’s shaky—your call? 🗳️
• Bullish: $130+ soon, undervalued 🚀
• Neutral: Holding steady 🚬
• Bearish: $100 coming, trouble ahead 🕳️
Drop your vote below! 👇
(9/9) – FINAL TAKEAWAY 🎯
Target’s $116 price paints a shaky picture 📈, but its brand’s a rock 🌎. Swings are our playground—dips turn into DCA wins 💰. Buy low, aim high! Hit or miss?

HOME DEPOT ($HD) Q4—HOME FIXES SPARK A SURGEHOME DEPOT ( NYSE:HD ) Q4—HOME FIXES SPARK A SURGE
(1/9)
Good afternoon, TradingView! Home Depot ( NYSE:HD ) is buzzing—$ 39.7B Q4 sales, up 14.1% 📈🔥. Extra week and SRS deal fuel zing—let’s unpack this retail giant! 🚀
(2/9) – REVENUE RUSH
• Q4 Sales: $ 39.7B—14.1% up from $ 34.8B 💥
• Full ‘24: $ 159.5B—4.5% rise from $ 152.7B 📊
• Boost: $ 4.9B from 14th week
NYSE:HD ’s humming—fixer-uppers unite!
(3/9) – EARNINGS GLOW
• Q4 EPS: $ 3.13—beats $ 3.03 est. 🌍
• Net: $ 3.0B—up from $ 2.8B 🚗
• Dividend: $ 2.30—up 2.2%, juicy 🌟
NYSE:HD ’s profit shines—steady cash!
(4/9) – BIG PLAYS
• SRS Buy: Pro segment zaps growth 📈
• Comp Sales: +0.8%—first up in 2 yrs 🌍
• Stores: 12 newbies—expansion zip 🚗
NYSE:HD ’s flexing—home king reigns!
(5/9) – RISKS IN VIEW
• Housing: Rates, $ 396.9K homes—yikes ⚠️
• Inflation: Wallets tighten—sting 🏛️
• Comp: Lowe’s nips—tight race 📉
Hot run—can it dodge the bumps?
(6/9) – SWOT: STRENGTHS
• Lead: $ 159.5B—top dog 🌟
• Comp: +0.8%, 7.6% trans. jump 🔍
• SRS: Pro cash flows—steady juice 🚦
NYSE:HD ’s a retail beast—rock solid!
(7/9) – SWOT: WEAKNESSES & OPPORTUNITIES
• Weaknesses: Housing drag—boo 💸
• Opportunities: Rate cuts, SRS lift—zing 🌍
Can NYSE:HD zap past the risks?
(8/9) – NYSE:HD ’s Q4 surge—what’s your vibe?
1️⃣ Bullish—Growth shines bright.
2️⃣ Neutral—Solid, risks hover.
3️⃣ Bearish—Housing stalls it out.
Vote below! 🗳️👇
(9/9) – FINAL TAKEAWAY
NYSE:HD ’s $ 39.7B Q4 and SRS spark zing—$ 159.5B year hums 🌍🪙. Premium P/E, but grit rules—gem or pause?

CHINA GALAXY ($601881.SS) Q4—STEADY IN CHINA’S STORMCHINA GALAXY ($601881.SS) Q4—STEADY IN CHINA’S STORM
(1/9)
Good morning, TradingView! China Galaxy (601881.SS) is buzzing—$ 35.37B ‘24 revenue, up 2.23% 📈🔥. Q4 hints at grit—let’s unpack this securities star! 🚀
(2/9) – REVENUE HUM
• ‘24 Haul: $ 35.37B—2.23% up from $ 34.6B 💥
• Steady: X says no big dips—brokerage shines 📊
• Edge: Tough market, still ticking
Galaxy’s humming—China’s steady hand!
(3/9) – EARNINGS ZAP
• ‘24 Profit: $ 10.13B—up 45.6% YoY 🌍
• EPS: $ 0.63—beats ‘23 slump 🚗
• Q4 ‘24: X buzzes resilience—details soon 🌟
Galaxy’s profit surges—market maestro!
(4/9) – BIG MOVES
• Lead: Tops brokerage, futures—$ 36.26B 🌍
• No Merge: CICC rumor nixed—solo run 📈
• Cash: $ 115.03B net—loaded vault 🚗
Galaxy’s flexing—steady as she goes!
(5/9) – RISKS IN SIGHT
• China Slow: Demand wobbles—yikes ⚠️
• Regs: Rules tighten—costs nip 🏛️
• Volatility: Trading dips could sting 📉
Hot run—can it dodge the heat?
(6/9) – SWOT: STRENGTHS
• Broker King: $ 36.26B—top dog 🌟
• Profit: $ 10.13B—45.6% zing 🔍
• Cash: $ 115.03B—rock solid 🚦
Galaxy’s a steady beast—built tough!
(7/9) – SWOT: WEAKNESSES & OPPORTUNITIES
• Weaknesses: Slow 2.23%, China lean 💸
• Opportunities: Digital boom, stimulus lift 🌍
Can Galaxy zap past the bumps?
(8/9) – Galaxy’s Q4 buzz—what’s your vibe?
1️⃣ Bullish—Profit shines bright.
2️⃣ Neutral—Solid, risks hover.
3️⃣ Bearish—China stalls it out.
Vote below! 🗳️👇
(9/9) – FINAL TAKEAWAY
Galaxy’s $ 35.37B ‘24 and $ 10.13B profit spark zing—steady champ 🌍🪙. Low P/E, but risks lurk—gem or pause?

XAUUSD - ANALYSIS👀 Observation:
Hello, everyone! I hope you're all doing well. Let me share my personal view on XAU/USD (Gold) with you.
Based on the current market structure, Gold has broken below its key level at 2735.960, indicating potential further downside movement. However, before the decline continues, I anticipate a pullback upward to the 2747.420 level. From this area, I will look for selling opportunities targeting the zones between 2707.905 and 2703.135 .
📉 Expectation:
A pullback to 2747.420 followed by a potential sell-off towards 2707.905–2703.135 .
💡 Key Levels to Watch:
Resistance: 2747.420
Support: 2735.960 (broken), 2707.905–2703.135
💬 What’s your view on the XAU/USD (Gold) this week? Share your thoughts in the comments below!
Trade safe

EURNZD - SELL IDEALast Week price pushed lower with nice intent.
4H structures bearish and price is now making a correction to the upside.
There are some liquidity created resting right below a stacked area of 4h + 1h imbalance,
Waiting for price to swept those equal highs and react from the imbalance.
My target might be some daily equal lows that are in line with 4H structure point.

75: Douglas AG: Is it Time to Accumulate at Current Prices?Douglas, the parfumerie chain, has experienced a significant decline in its stock price since its initial public offering (IPO). With the stock now trading around 50% lower than its IPO price, it appears to be approaching a potential accumulation zone between the price range of 20 and 15 euros. This analysis explores the possibility of this price level being an attractive opportunity for accumulation, provided that market participants agree with this valuation.
Technical Analysis:
- Douglas stock has experienced a sharp decline since its IPO, forming a clear downtrend pattern on the charts.
- The stock is currently approaching a critical support level in the range of 20 to 15 euros, where it has historically found buying interest.
- The Relative Strength Index (RSI) indicator suggests that the stock is approaching oversold conditions, indicating potential exhaustion in selling pressure.
Fundamental Analysis:
- Despite the recent struggles in its stock price, Douglas remains a prominent player in the parfumerie industry, with a significant presence across Europe.
- The IPO proceeds were primarily intended to reduce the company's debt burden, indicating a strategic move towards financial stability.
- Douglas has outlined plans for expansion and modernization, which could potentially drive future growth and value creation.
Market Sentiment:
- The current sentiment towards Douglas stock appears negative due to the substantial decline post-IPO.
- However, there may be a shift in sentiment if market participants perceive the current price level as attractive for accumulation.
- Dealer activity and institutional investor sentiment will be crucial in determining whether the stock finds support in the indicated price range.
The recent decline in Douglas stock price post-IPO presents a potential opportunity for accumulation, with the stock nearing a key support level between 20 and 15 euros. However, investor sentiment and dealer activity will play a vital role in confirming whether this price range indeed serves as a favorable accumulation zone. Traders and investors should closely monitor price action and market dynamics before making any investment decisions regarding Douglas stock.

Seizing Opportunity: Double Bottom Formation in LT!Hello traders,
Let's explore an exciting opportunity today! 🌟 This stock has recently formed a double bottom pattern and surged upwards, consistently breaking previous highs. 🔄 Currently testing its recent peak, there's potential for a pullback before further upside.
Options traders, consider buying 3500 call options in march expiry for optimal leverage. Let's make the most of this opportunity! 💼📊
Thank you. See you again in the next post.
Best regards,
Alpha Trading Station

📈 Vedanta Ltd: Riding the Upward Trend! 🚀Traders, let's focus on Vedanta Ltd today! 🌟 It's cruising within an upward parallel channel , consistently bouncing off support and surging higher. 🔄 Despite today's market turmoil, consider entering cautiously with trendline support. 📉 Options buyers can explore 250 to 270 CE for liquidity. Let's navigate these waters together! 💼📊
Remember, my analysis is a guide. Always conduct thorough research before taking the plunge.
Until our next rendezvous, may the markets be ever in your favor! 🚀📊
See you in the next post!

📈 Bank of Baroda: Riding the Waves of Support and Resistance!Hello Alpha Traders!
Let's delve into Bank of Baroda today. Here's a snapshot:
📊 1-Hour Trend Analysis: NSE:BANKBARODA is currently riding an upward trend in the 1-hour session, showcasing resilience at support levels.
🔄 Support and Resistance Dynamics: Observing a pattern where the stock breaks its resistance, retraces to find support, and then resumes its upward journey.
📈 Current Scenario: With the recent breakout above resistance, the stock is now retesting its support level before potential further upside.
💰 Trading Opportunity: Consider taking a long position in the range of 260 to 240 rupees, with a stop loss placed below the support trend line for risk management.
📌 Stay Vigilant: Always stay alert to market movements and adjust your strategies accordingly.
🚀 Chart Analysis: Dive deeper into the chart analysis for a comprehensive understanding of the stock's movements.
Looking forward to your insights and trades, Alpha Traders! 🚀💼
Best regards,
Alpha Trading Station

🚀💡 Unlocking Profit Potential: Bank of India Analysis RevealedTraders, brace yourselves for an explosive opportunity as we delve into Bank of India's mesmerizing chart dynamics. 📈🔍
🔎 1-Hour Insight: Zooming into the 1-hour timeframe reveals an intriguing narrative—a compelling upward parallel channel that beckons us with promise.
📊 Channel Mastery: Bank of India's price action has gracefully adhered to the confines of this channel, consistently finding support and springing forth with renewed vigor.
💼 Supportive Evidence: As we speak, the stock delicately caresses its support level, a tantalizing hint at the potential upward surge that lies ahead.
💬 Expert Call to Action: While my analysis speaks volumes, I implore you to embark on your own journey of discovery. Explore, analyze, and fortify your convictions before taking the plunge.
🙌 Community Collaboration: Let's foster a culture of shared insight and collective wisdom. Your perspectives enrich our collective understanding and elevate us all to new heights.
Ready yourselves, traders! The journey to profit awaits, and together, we'll seize every opportunity that Bank of India presents. Until our next rendezvous! 🚀📊

📈 Tata Steel: Bouncing Off Support and Eyeing New Highs! 🚀Hello traders!
Today, let's dive into $NSE:TATASTEEL. Here's the breakdown:
📉 Support Bounce: Tata Steel has recently touched its support at Rs.132 and is now making a move upward.
📈 Targeting ₹140: The current trajectory suggests a push towards the near-term profit target of ₹140.
💹 Derivative Opportunity: For derivative traders, considering the 130 call option could be a strategic move.
✨ Potential Upside: With good support, there's a chance for Tata Steel to soar higher. Keep a close watch for further developments.
🔄 Dynamic Market: Always remember, the market is dynamic, and these are observations. Conduct your analysis before making any trading decisions.
🤔 Your Take: How do you interpret Tata Steel's movement? Share your insights in the comments!
📌 Stay Updated: Let's navigate these markets together. Stay tuned for more posts and updates!
Best regards,
Alpha Trading Station
